7.7. Añadir PCP Vector como fuente de datos
La fuente de datos PCP Vector muestra las métricas en vivo y utiliza las métricas de pcp. Analiza los datos de hosts individuales. Este procedimiento describe cómo añadir un PCP Vector como fuente de datos y cómo ver el panel de control con una visión general de cualquier métrica útil.
Requisitos previos
-
El sitio
grafana-serveres accesible. Para más información, consulte Sección 7.3, “Acceso a la interfaz web de Grafana”.
Procedimiento
Instale el paquete
pcp-pmda-bcc:# yum install pcp-pmda-bccInstale el
bccPMDA:# cd /var/lib/pcp/pmdas/bcc # ./Install [Wed Apr 1 00:27:48] pmdabcc(22341) Info: Initializing, currently in 'notready' state. [Wed Apr 1 00:27:48] pmdabcc(22341) Info: Enabled modules: [Wed Apr 1 00:27:48] pmdabcc(22341) Info: ['biolatency', 'sysfork', [...] Updating the Performance Metrics Name Space (PMNS) ... Terminate PMDA if already installed ... Updating the PMCD control file, and notifying PMCD ... Check bcc metrics have appeared ... 1 warnings, 1 metrics and 0 values- Inicie sesión en la interfaz web de Grafana. Para obtener más información, consulte Sección 7.3, “Acceso a la interfaz web de Grafana”.
Click the
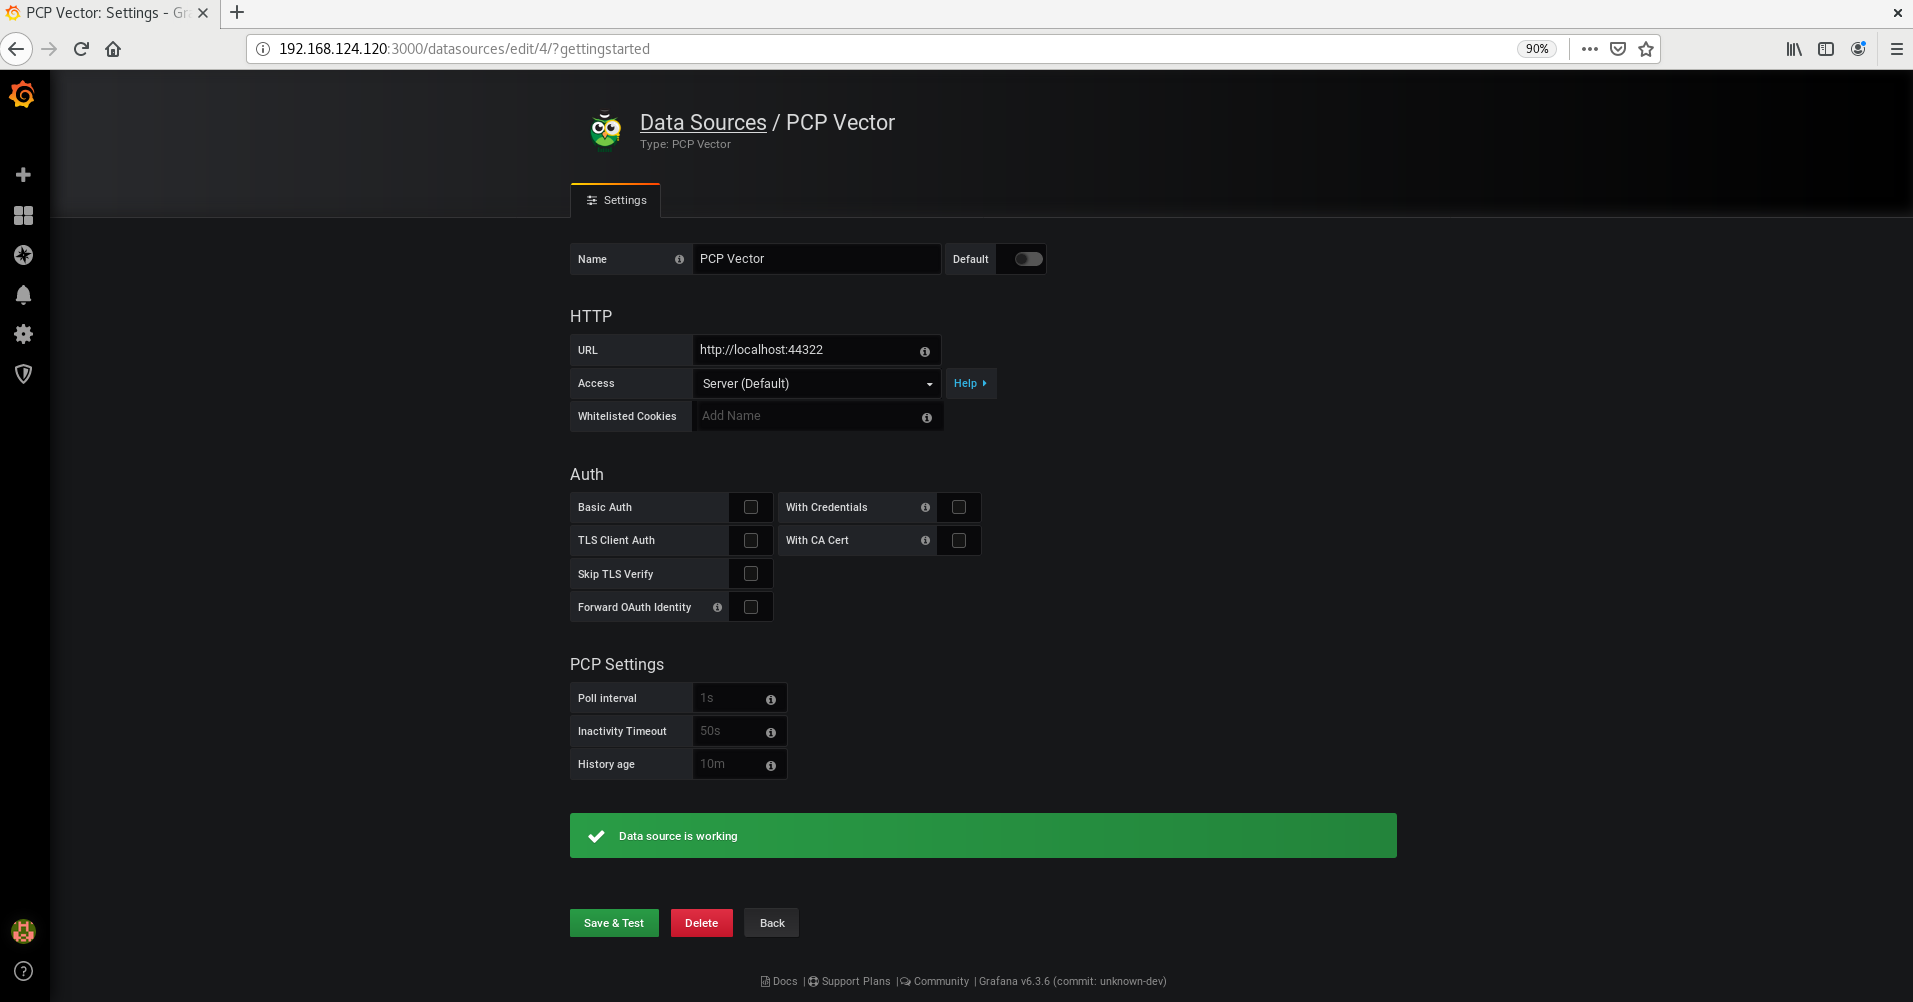
 icon > click Add data source > in the Filter by name or type, type vector > and click PCP Vector > in the URL field, accept the given suggestion http://localhost:44322 and > click Save & Test.
Figura 7.8. Añadir el vector PCP en la fuente de datos
In the pane, hover on the
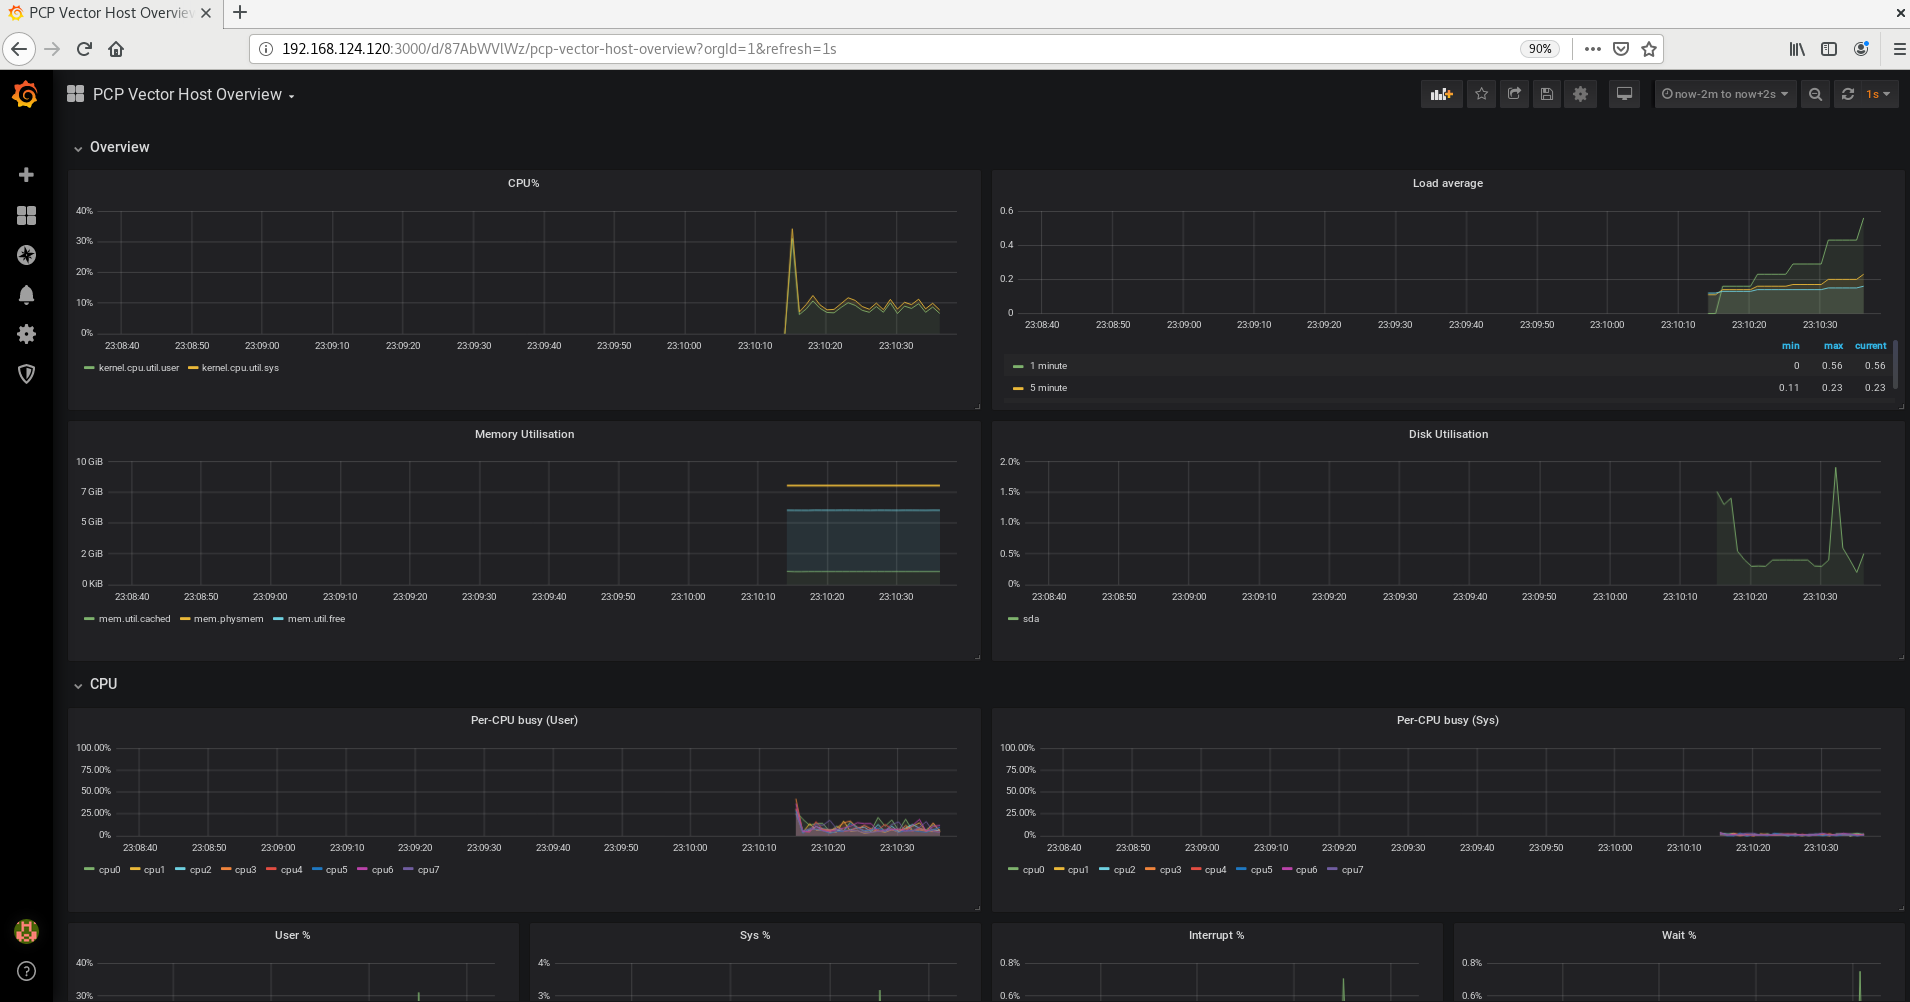
 icon > click Manage > in the Filter Dashboard by name, type pcp vector > select PCP Vector Host Overview to see a dashboard with an overview of useful metrics.
Figura 7.9. Visión general del anfitrión vectorial PCP
Recursos adicionales
-
La página de manual
pmdabcc.