OpenShift Container Storage is now OpenShift Data Foundation starting with version 4.9.
Este contenido no está disponible en el idioma seleccionado.
Chapter 10. Enabling Volume Metrics
To enable volume metrics for glusterfs plugin in order to collect the statistics of GlusterFS PVs, set up Prometheus, a monitoring toolkit. You can use Prometheus to visualize metrics and alerts for OpenShift Container Platform system resources.
For more information on how to setup Prometheus, see https://access.redhat.com/documentation/en-us/openshift_container_platform/3.10/html-single/configuring_clusters/#openshift-prometheus
10.1. Enabling Volume Metrics for File Storage and Block Storage
Copiar enlaceEnlace copiado en el portapapeles!
Following is the list of different metrics of the PVs that can be viewed on Prometheus:
kubelet_volume_stats_available_bytes: Number of available bytes in the volume.kubelet_volume_stats_capacity_bytes: Capacity in bytes of the volume.kubelet_volume_stats_inodes: Maximum number of inodes in the volume.kubelet_volume_stats_inodes_free: Number of free inodes in the volume.kubelet_volume_stats_inodes_used: Number of used inodes in the volume.kubelet_volume_stats_used_bytes: Number of used bytes in the volume.heketi_cluster_count: Number of clusters.heketi_device_brick_count: Number of bricks on device.heketi_device_count: Number of devices on host.heketi_device_free: Amount of free space available on the device.heketi_device_size: Total size of the device.heketi_device_used: Amount of space used on the device.heketi_nodes_count: Number of nodes on the cluster.heketi_up: Verifies if heketi is running.heketi_volumes_count: Number of volumes on cluster.
Viewing Metrics
To view any metrics:
- Add the metrics name in Prometheus, and click Execute.
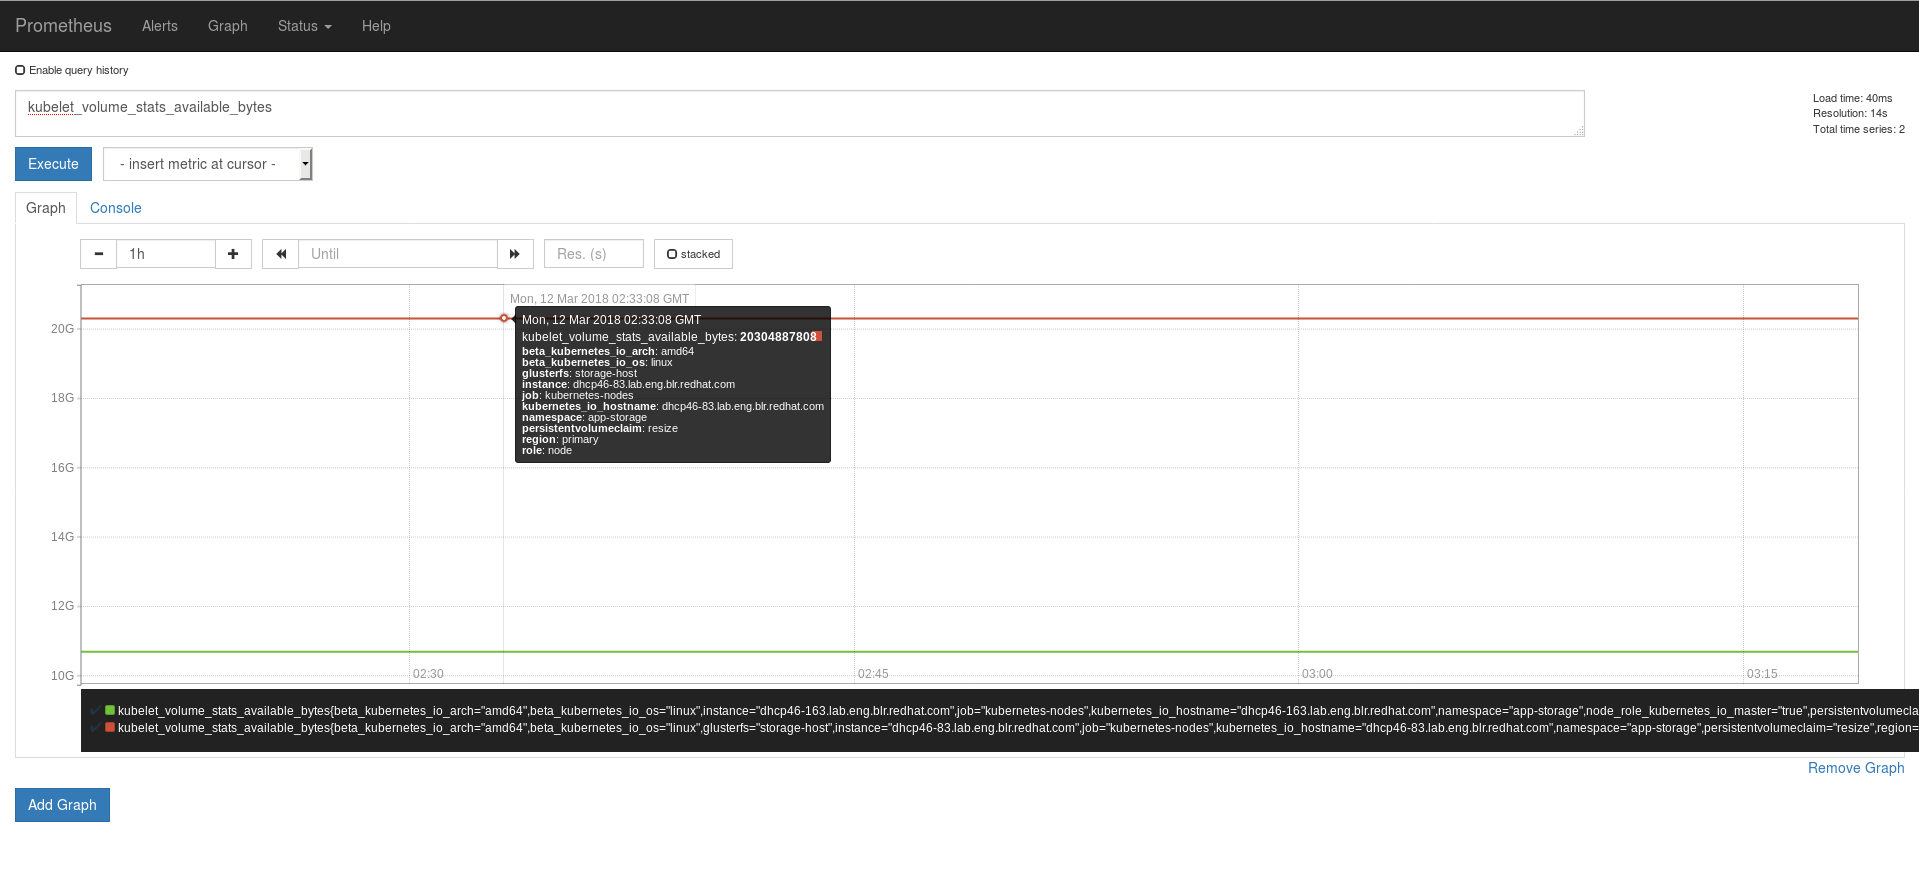
- In the Graph tab, the value for the metrics for the volume is displayed as a graph.For example, in the following image, to check the available bytes,
kubelet_volume_stats_available_bytesmetric is added to the search bar on Prometheus. On clickingExecute, the available bytes value is depicted as a graph. You can hover the mouse on the line to get more details. (To view the image in detail, right-click and select View Image.)
Viewing Heketi Metrics
To view Heketi metrics on Prometheus, execute the following commands:
- Add annotations to the
heketi-storage.oc annotate svc heketi-storage prometheus.io/scheme=http oc annotate svc heketi-storage prometheus.io/scrape=true
# oc annotate svc heketi-storage prometheus.io/scheme=http
# oc annotate svc heketi-storage prometheus.io/scrape=true
Copy to Clipboard Copied! Toggle word wrap Toggle overflow Copy to Clipboard Copied! Toggle word wrap Toggle overflow - Add the
app-storagenamespace for the heketi service in the Prometheus configmap.Copy to Clipboard Copied! Toggle word wrap Toggle overflow - Restart the
prometheus-0pod to query the Heketi metrics in Prometheus.