Este contenido no está disponible en el idioma seleccionado.
Chapter 2. Architecture
Monitoring tools use a client-server model with the client deployed onto the Red Hat OpenStack Platform overcloud nodes. The Fluentd service provides client-side centralized logging (CL) and the Sensu client service provides client-side availability monitoring (AM).
2.1. Centralized Logging
Centralized logging allows you to have one central place to view logs across your entire OpenStack environment. These logs come from the operating system, such as syslog and audit log files, infrastructure components such as RabbitMQ and MariaDB, and OpenStack services such as Identity, Compute, and others.
The centralized logging toolchain consists of a number of components, including:
- Log Collection Agent (Fluentd)
- Log Relay/Transformer (Fluentd)
- Data Store (Elasticsearch)
- API/Presentation Layer (Kibana)
The director does not deploy the server-side components for centralized logging. Red Hat does not support the server-side components, including the Elasticsearch database, Kibana, and Fluentd with plugins running as a log aggregator.
The centralized logging components and their interactions are laid out in the following diagrams:
Items shown in blue denote Red Hat-supported components.
Figure 2.1. Centralized logging architecture at a high level

Figure 2.2. Single-node deployment for Red Hat OpenStack Platform
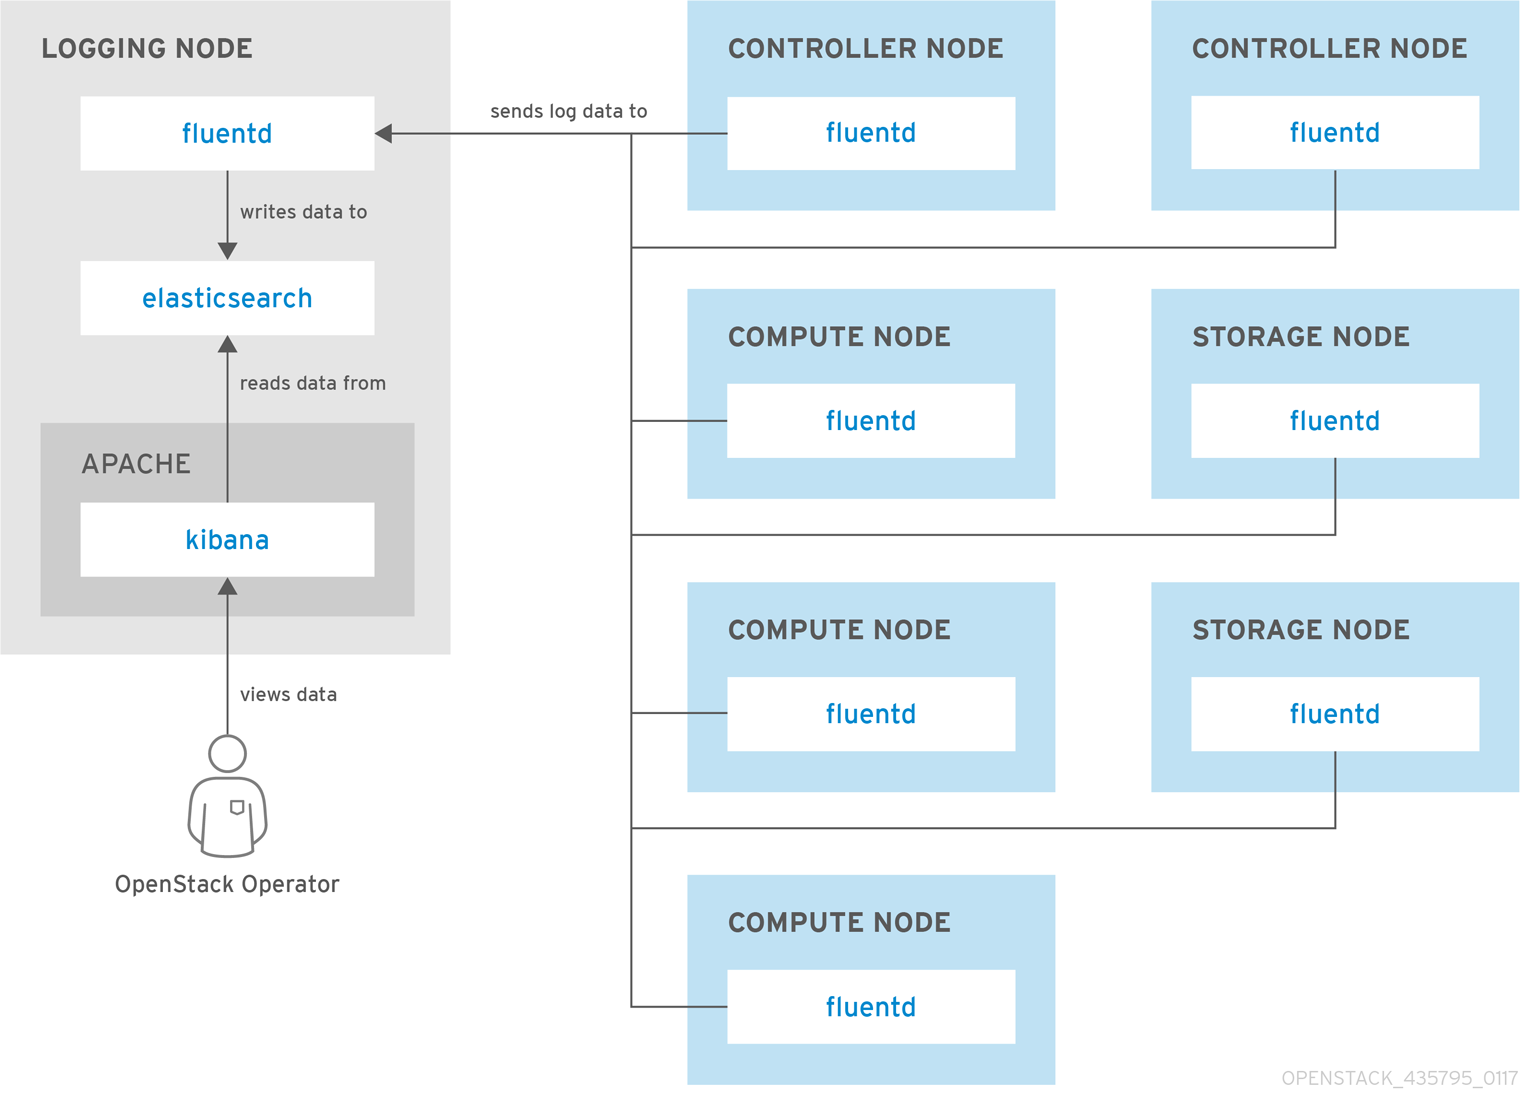
Figure 2.3. HA deployment for Red Hat OpenStack Platform

2.2. Availability Monitoring
Availability monitoring allows you to have one central place to monitor the high-level functionality of all components across your entire OpenStack environment.
The availability monitoring toolchain consists of a number of components, including:
- Monitoring Agent (Sensu client)
- Monitoring Relay/Proxy (RabbitMQ)
- Monitoring Controller/Server (Sensu server)
- API/Presentation Layer (Uchiwa)
The director does not deploy the server-side components for availability monitoring. Red Hat does not support the server-side components, including Uchiwa, Sensu Server, the Sensu API plus RabbitMQ, and a Redis instance running on a monitoring node.
The availability monitoring components and their interactions are laid out in the following diagrams:
Items shown in blue denote Red Hat-supported components.
Figure 2.4. Availability monitoring architecture at a high level

Figure 2.5. Single-node deployment for Red Hat OpenStack Platform

Figure 2.6. HA deployment for Red Hat OpenStack Platform
