Ce contenu n'est pas disponible dans la langue sélectionnée.
Chapter 3. Reviewing the reports
The report examples shown in the following sections are a result of analyzing the com.acme and org.apache packages in the jee-example-app-1.0.0.ear example application, which is located in the MTR GitHub source repository.
The report was generated using the following command.
<MTR_HOME>/mta-cli --input /home/username/mta-cli-source/test-files/jee-example-app-1.0.0.ear/ --output /home/username/mta-cli-reports/jee-example-app-1.0.0.ear-report --target eap:6 --packages com.acme org.apache
$ <MTR_HOME>/mta-cli --input /home/username/mta-cli-source/test-files/jee-example-app-1.0.0.ear/ --output /home/username/mta-cli-reports/jee-example-app-1.0.0.ear-report --target eap:6 --packages com.acme org.apache
Use a browser to open the index.html file located in the report output directory. This opens a landing page that lists the applications that were processed. Each row contains a high-level overview of the story points, number of incidents, and technologies encountered in that application.
Figure 3.1. Application list
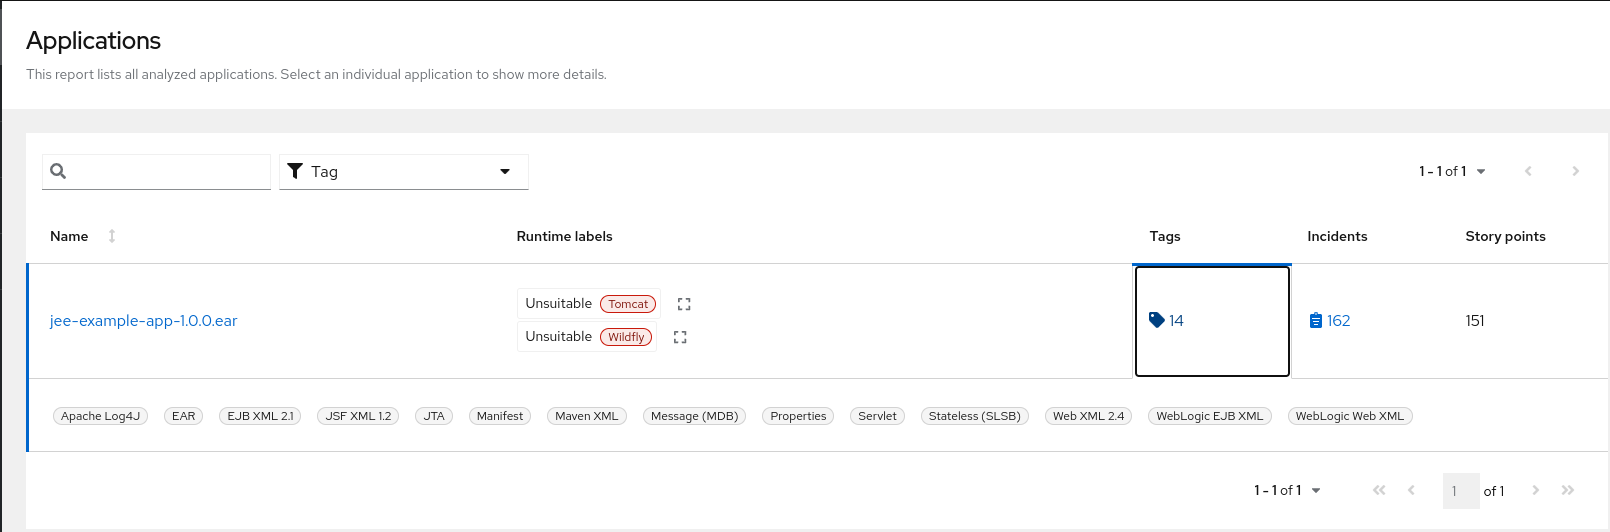
The incidents and estimated story points change as new rules are added to MTR. The values here may not match what you see when you test this application.
The following table lists all of the reports and pages that can be accessed from this main MTR landing page. Click the name of the application, jee-example-app-1.0.0.ear, to view the application report.
| Page | How to Access |
|---|---|
| Application | Click the name of the application. |
| Technologies report | Click the Technologies link at the top of the page. |
| Archives shared by multiple applications | Click the Archives shared by multiple applications link. Note that this link is only available when there are shared archives across multiple applications. |
| Rule providers execution overview | Click the Rule providers execution overview link at the bottom of the page. |
Note that if an application shares archives with other analyzed applications, you will see a breakdown of how many story points are from shared archives and how many are unique to this application.
Figure 3.2. Shared archives
Information about the archives that are shared among applications can be found in the Archives Shared by Multiple Applications reports.
3.1. Application report
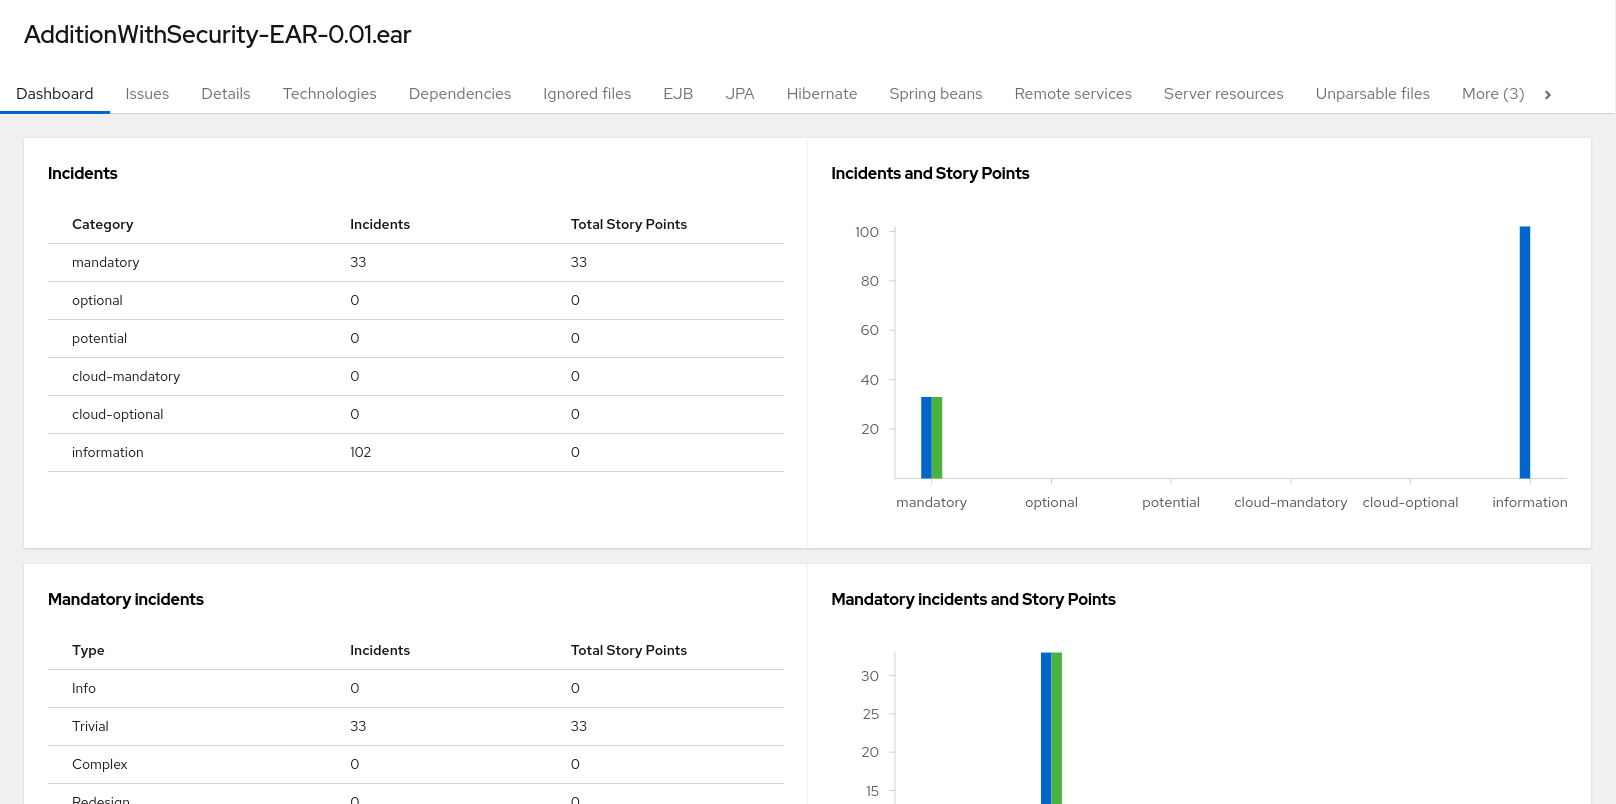
3.1.1. Dashboard
Access this report from the report landing page by clicking on the application name in the Application List.
The dashboard gives an overview of the entire application migration effort. It summarizes:
- The incidents and story points by category
- The incidents and story points by level of effort of the suggested changes
- The incidents by package
Figure 3.3. Dashboard
The top navigation bar lists the various reports that contain additional details about the migration of this application. Note that only those reports that are applicable to the current application will be available.
| Report | Description |
|---|---|
| Issues | Provides a concise summary of all issues that require attention. |
| Application details | Provides a detailed overview of all resources found within the application that may need attention during the migration. |
| Technologies | Displays all embedded libraries grouped by functionality, allowing you to quickly view the technologies used in each application. |
| Dependencies | Displays all Java-packaged dependencies found within the application. |
| Unparsable |
Shows all files that MTR could not parse in the expected format. For instance, a file with a |
| Remote services | Displays all remote services references that were found within the application. |
| EJBs | Contains a list of EJBs found within the application. |
| JBPM | Contains all of the JBPM-related resources that were discovered during analysis. |
| JPA | Contains details on all JPA-related resources that were found in the application. |
| Hibernate | Contains details on all Hibernate-related resources that were found in the application. |
| Server resources | Displays all server resources (for example, JNDI resources) in the input application. |
| Spring Beans | Contains a list of Spring Beans found during the analysis. |
| Hard-coded IP addresses | Provides a list of all hard-coded IP addresses that were found in the application. |
| Ignored files |
Lists the files found in the application that, based on certain rules and MTR configuration, were not processed. See the |
| About | Describes the current version of MTR and provides helpful links for further assistance. |
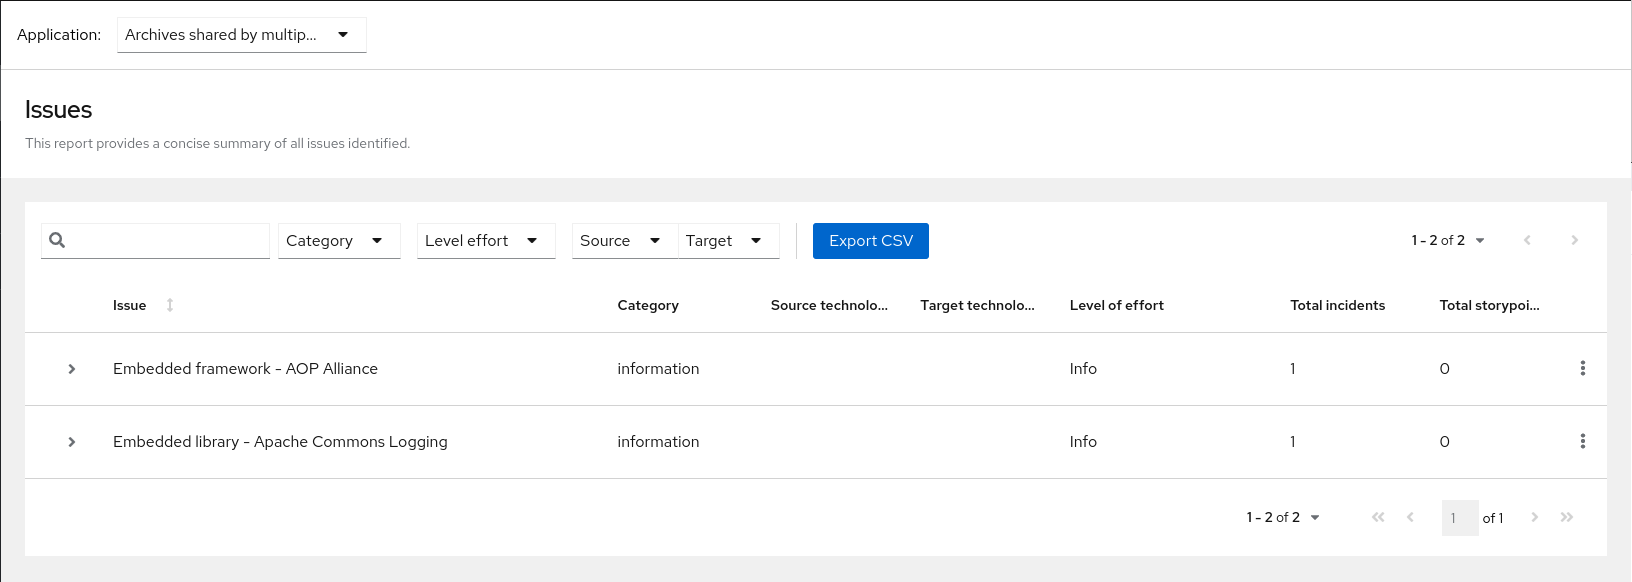
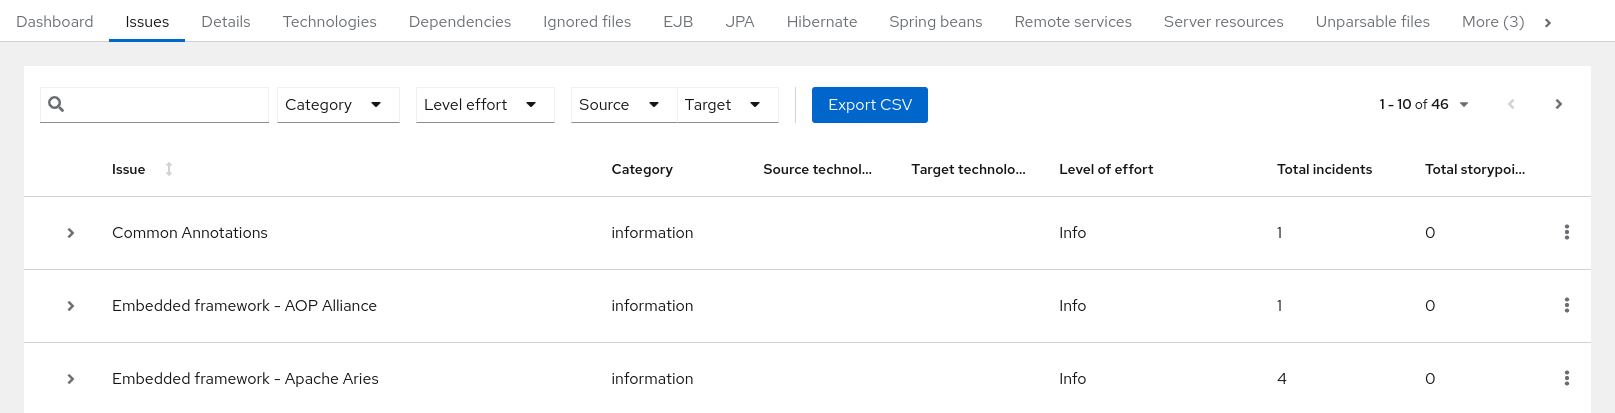
3.1.2. Issues report
Access this report from the dashboard by clicking the Issues link.
This report includes details about every issue that was raised by the selected migration paths. The following information is provided for each issue encountered:
- A title to summarize the issue.
- The total number of incidents, or times the issue was encountered.
- The rule story points to resolve a single instance of the issue.
- The estimated level of effort to resolve the issue.
- The total story points to resolve every instance encountered. This is calculated by multiplying the number of incidents found by the story points per incident.
Figure 3.4. Issues report
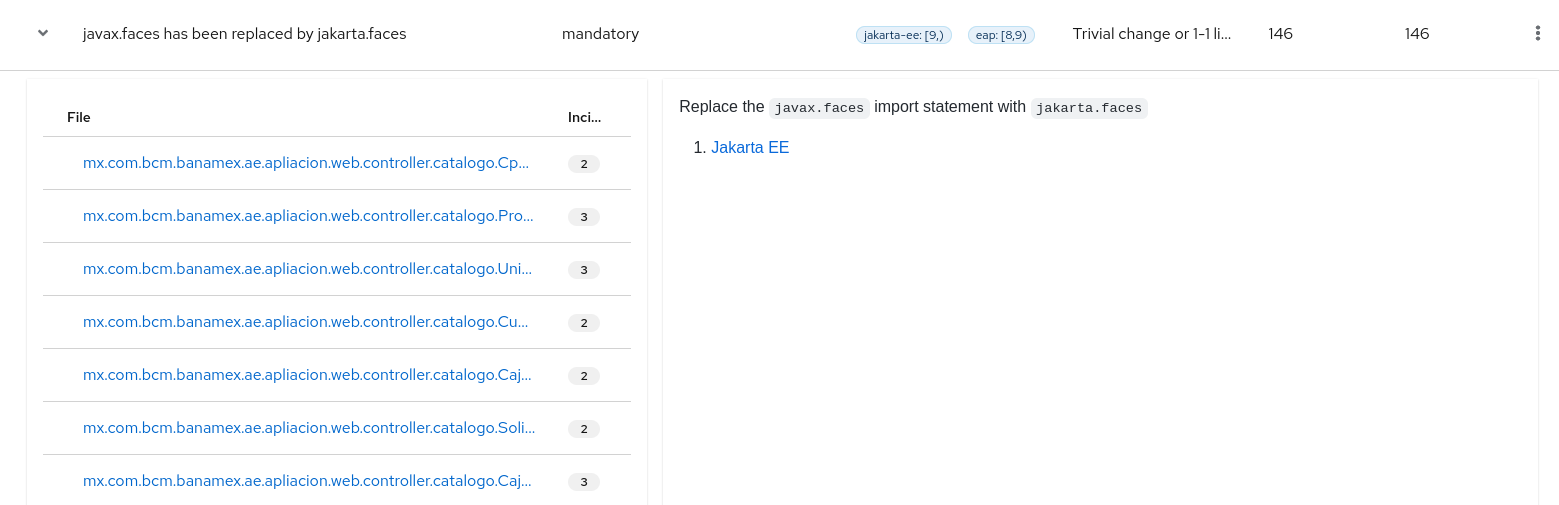
Each reported issue may be expanded, by clicking on the title, to obtain additional details. The following information is provided.
- A list of files where the incidents occurred, along with the number of incidents within each file. If the file is a Java source file, then clicking the filename will direct you to the corresponding Source report.
- A detailed description of the issue. This description outlines the problem, provides any known solutions, and references supporting documentation regarding either the issue or resolution.
- A direct link, entitled Show Rule, to the rule that generated the issue.
Figure 3.5. Expanded issue
Issues are sorted into four categories by default. Information on these categories is available at ask Category.
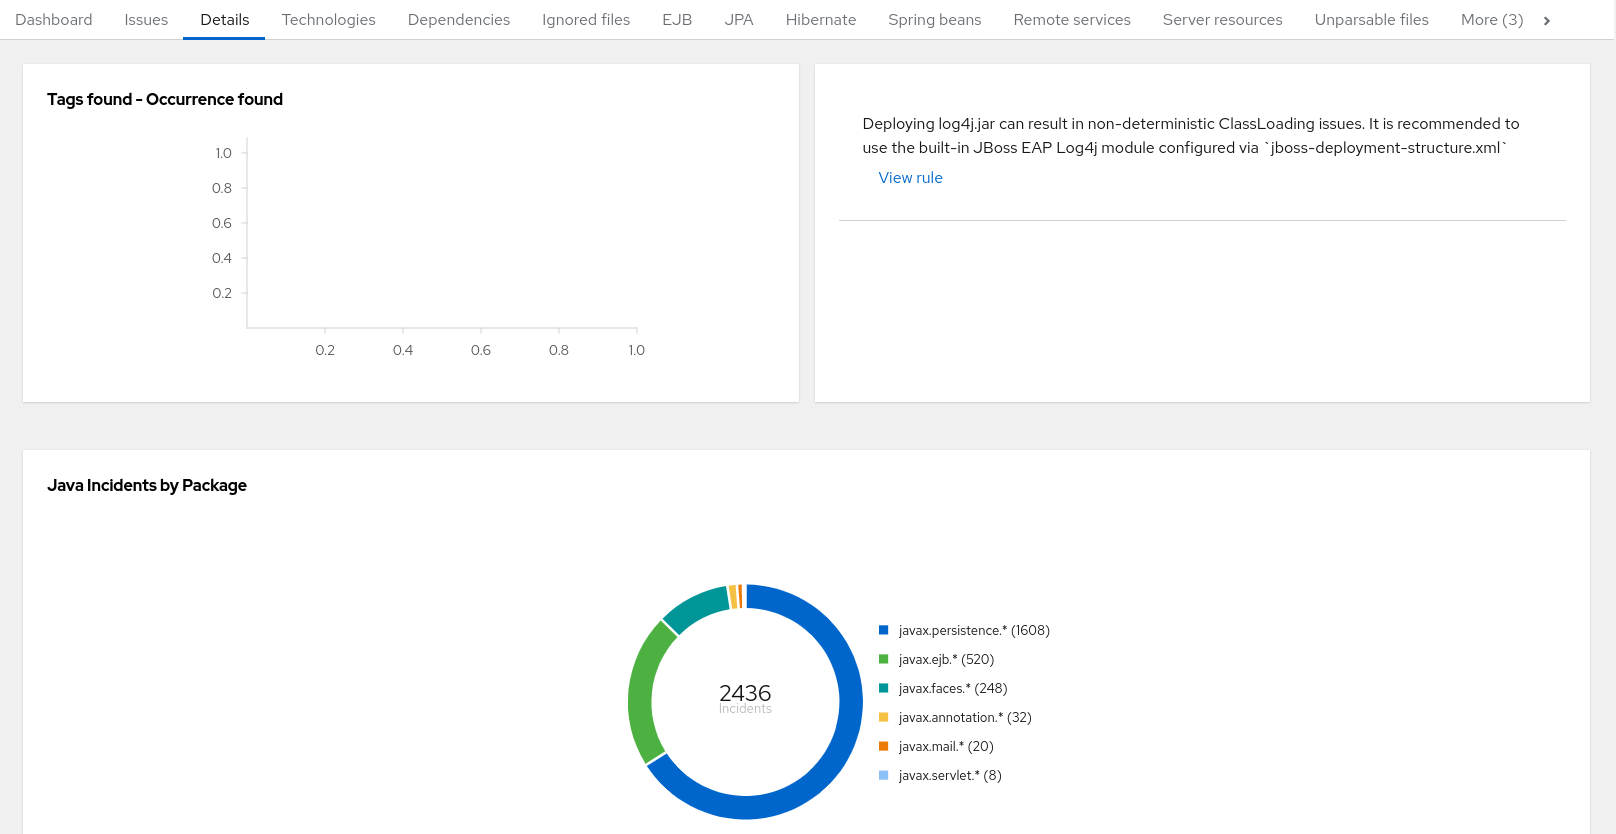
3.1.3. Application details report
Access this report from the dashboard by clicking the Application Details link.
The report lists the story points, the Java incidents by package, and a count of the occurrences of the technologies found in the application. Next is a display of application messages generated during the migration process. Finally, there is a breakdown of this information for each archive analyzed during the process.
Figure 3.6. Application Details report
Expand the jee-example-app-1.0.0.ear/jee-example-services.jar to review the story points, Java incidents by package, and a count of the occurrences of the technologies found in this archive. This summary begins with a total of the story points assigned to its migration, followed by a table detailing the changes required for each file in the archive. The report contains the following columns.
| Column Name | Description |
|---|---|
| Name | The name of the file being analyzed. |
| Technology | The type of file being analyzed, for example, Decompiled Java File or Properties. |
| Issues | Warnings about areas of code that need review or changes. |
| Story Points | Level of effort required to migrate the file. |
Note that if an archive is duplicated several times in an application, it will be listed just once in the report and will be tagged with [Included multiple times].
Figure 3.7. Duplicate archive in an application
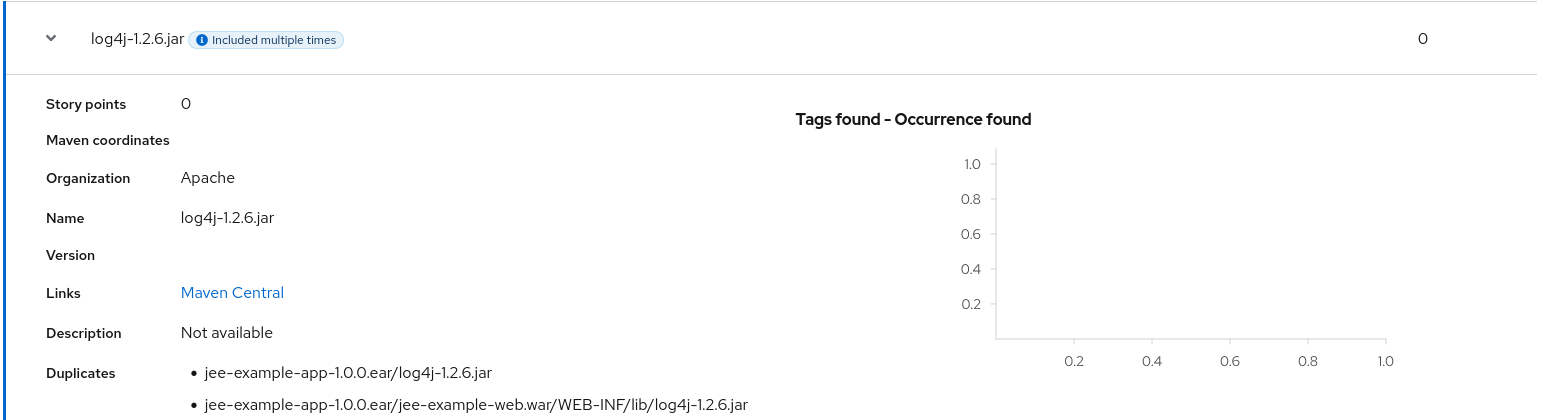
The story points for archives that are duplicated within an application will be counted only once in the total story point count for that application.
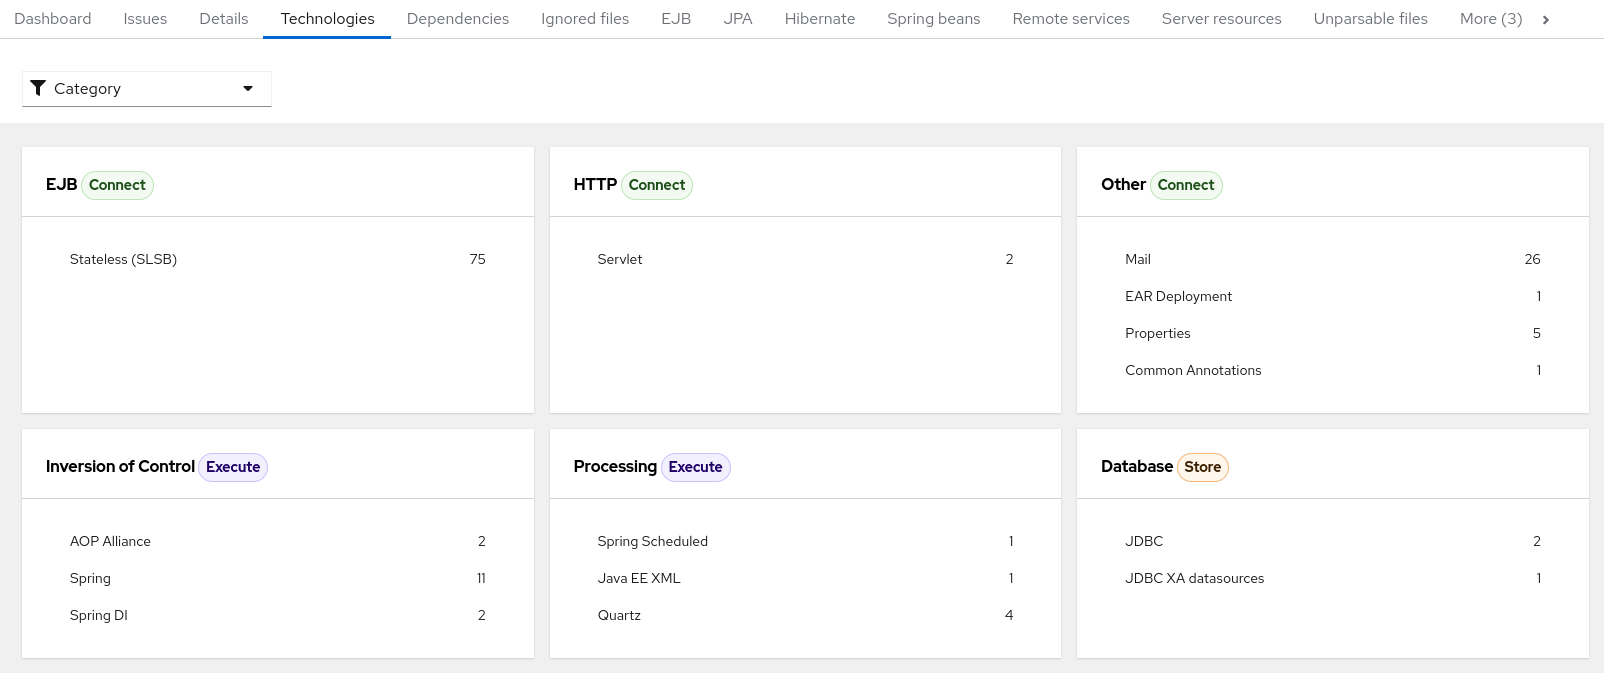
3.1.4. Technologies report
Access this report from the dashboard by clicking the Technologies link.
The report lists the occurrences of technologies, grouped by function, in the analyzed application. It is an overview of the technologies found in the application, and is designed to assist users in quickly understanding each application’s purpose.
The image below shows the technologies used in the jee-example-app.
Figure 3.8. Technologies in an application
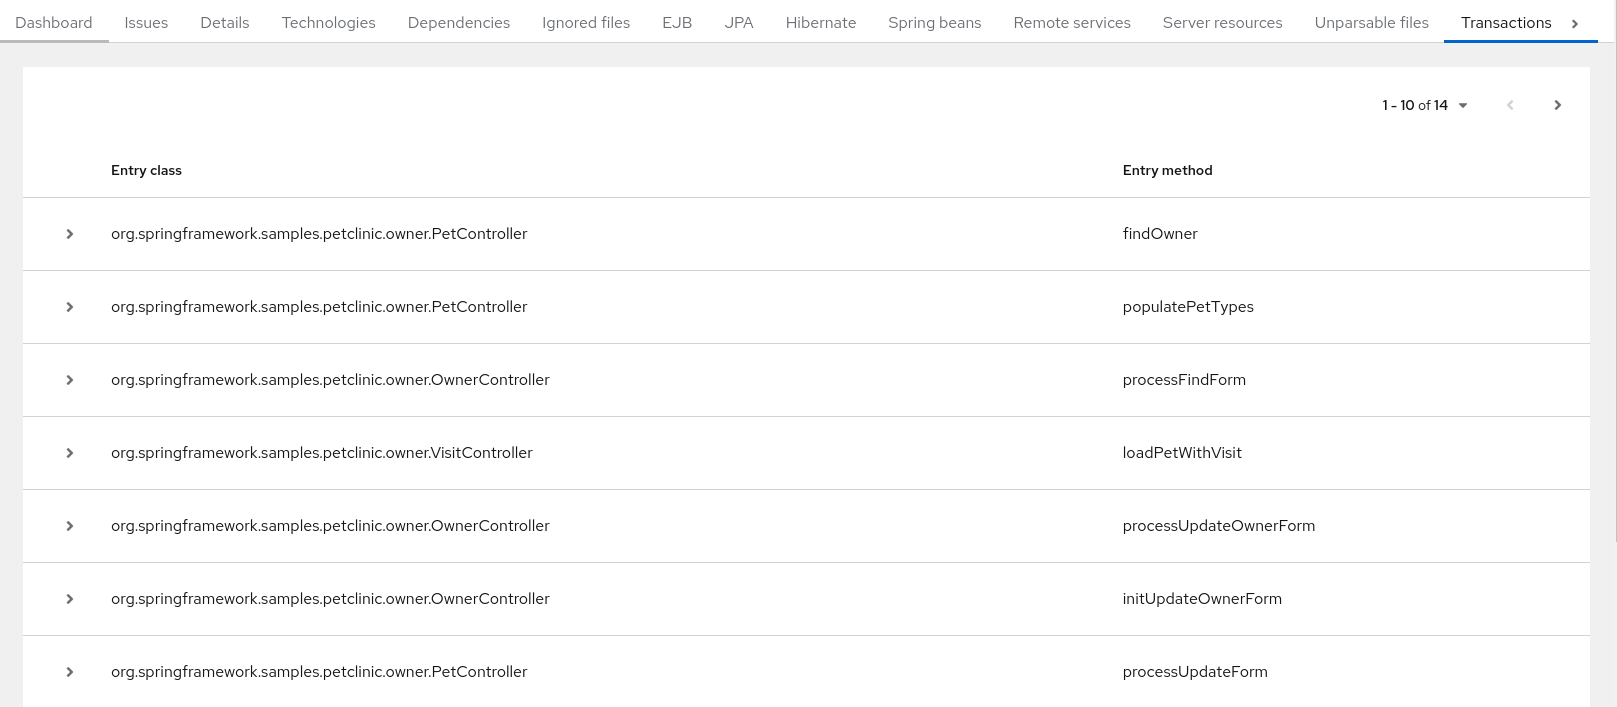
3.1.5. Transactions report
A Transactions report displays the call stack, which executes operations on relational database tables. The Enable Transaction Analysis feature supports Spring Data JPA and the traditional preparedStatement() method for SQL statement execution. It does not support ORM frameworks, such as Hibernate.
The image below shows an example of a Transactions report.
Figure 3.9. Transactions report
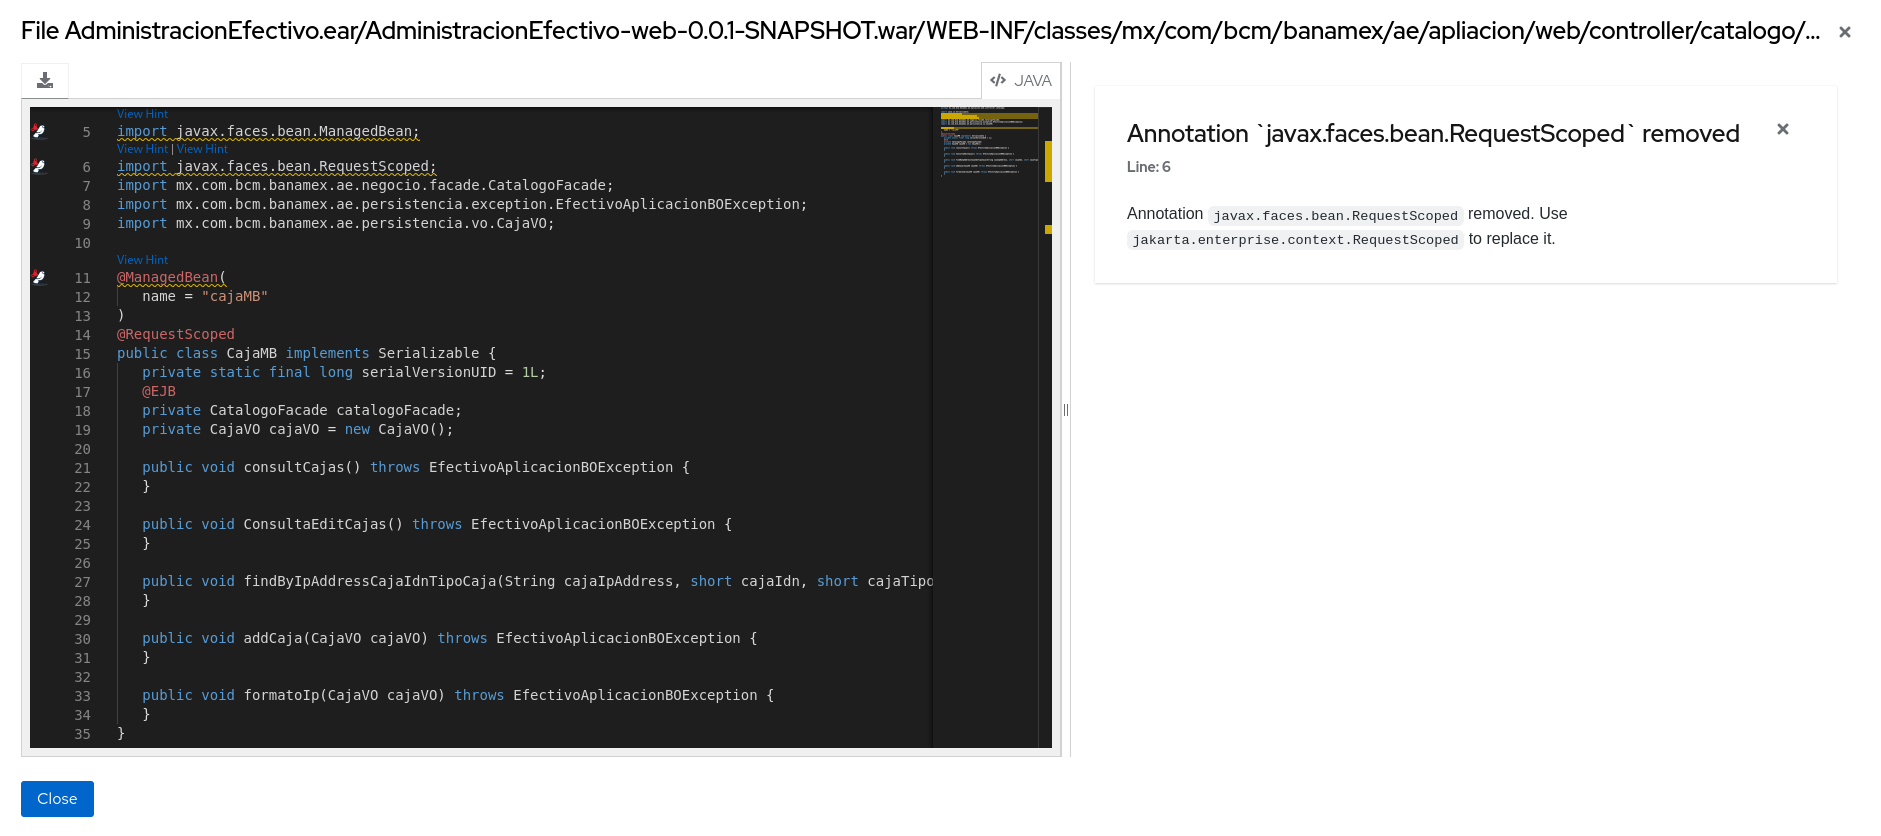
3.1.6. Source report
The Source report displays the migration issues in the context of the source file in which they were discovered.
Figure 3.10. Source report
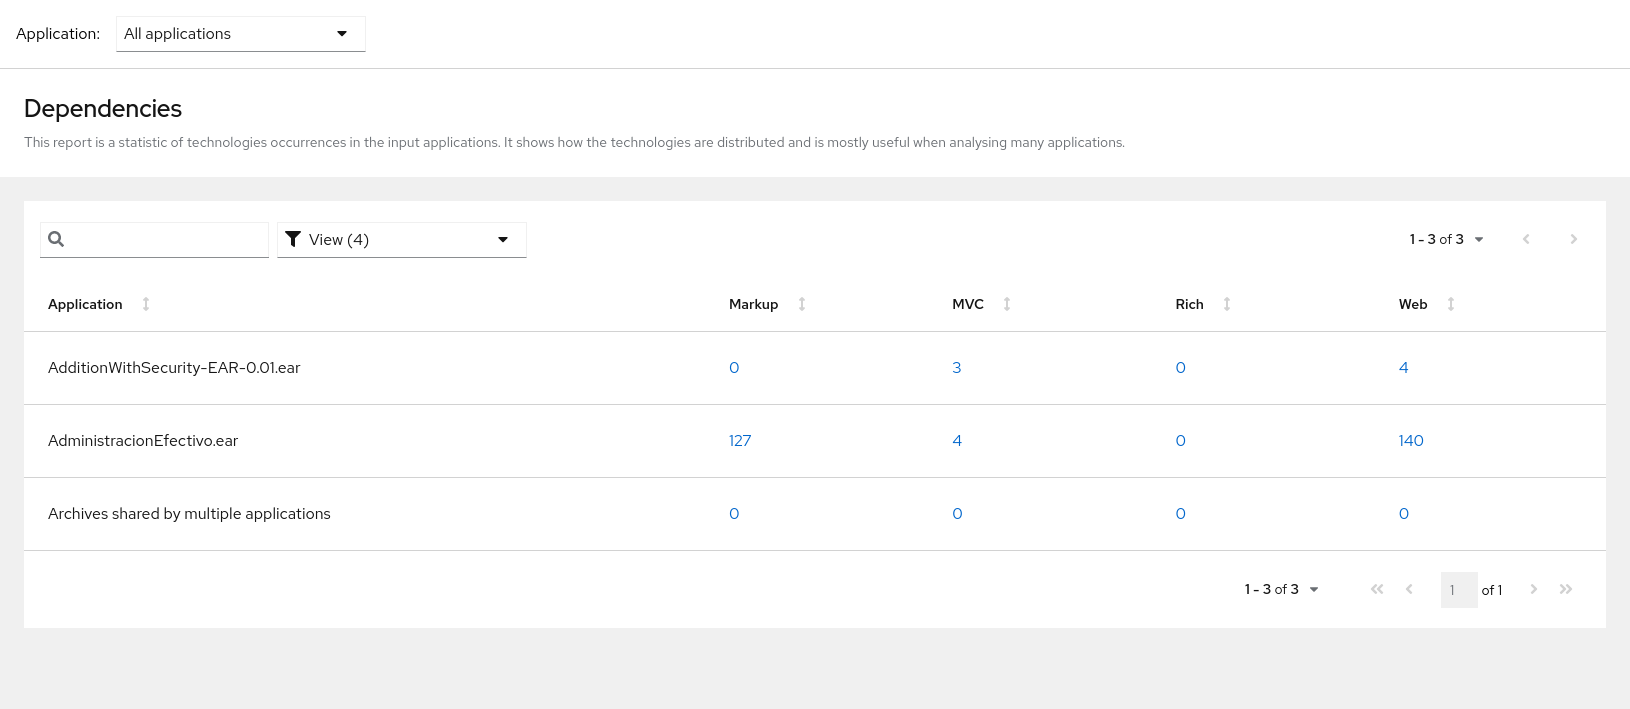
3.2. Technologies report
Access this report from the report landing page by clicking the Technologies link.
This report provides an aggregate listing of the technologies used, grouped by function, for the analyzed applications. It shows how the technologies are distributed, and is typically reviewed after analyzing a large number of applications to group the applications and identify patterns. It also shows the size, number of libraries, and story point totals of each application.
Clicking any of the headers, such as Markup, sorts the results in descending order. Selecting the same header again will resort the results in ascending order. The currently selected header is identified in bold, next to a directional arrow, indicating the direction of the sort.
Figure 3.11. Technologies used across multiple applications
3.3. Archives shared by multiple applications
Access these reports from the report landing page by clicking the Archives shared by multiple applications link. Note that this link is only available if there are applicable shared archives.
Figure 3.12. Archives shared by multiple applications
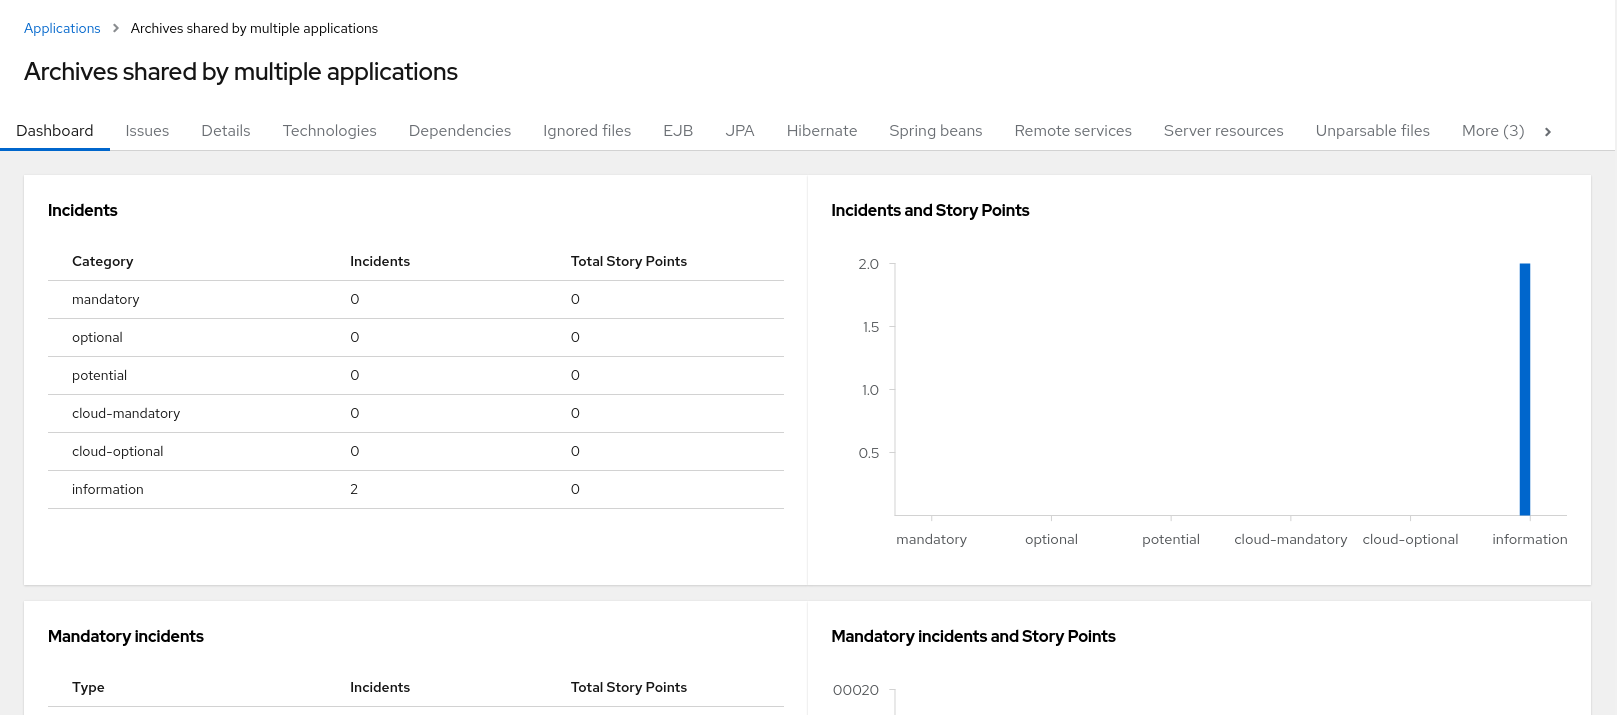
This allows you to view the detailed reports for all archives that are shared across multiple applications.
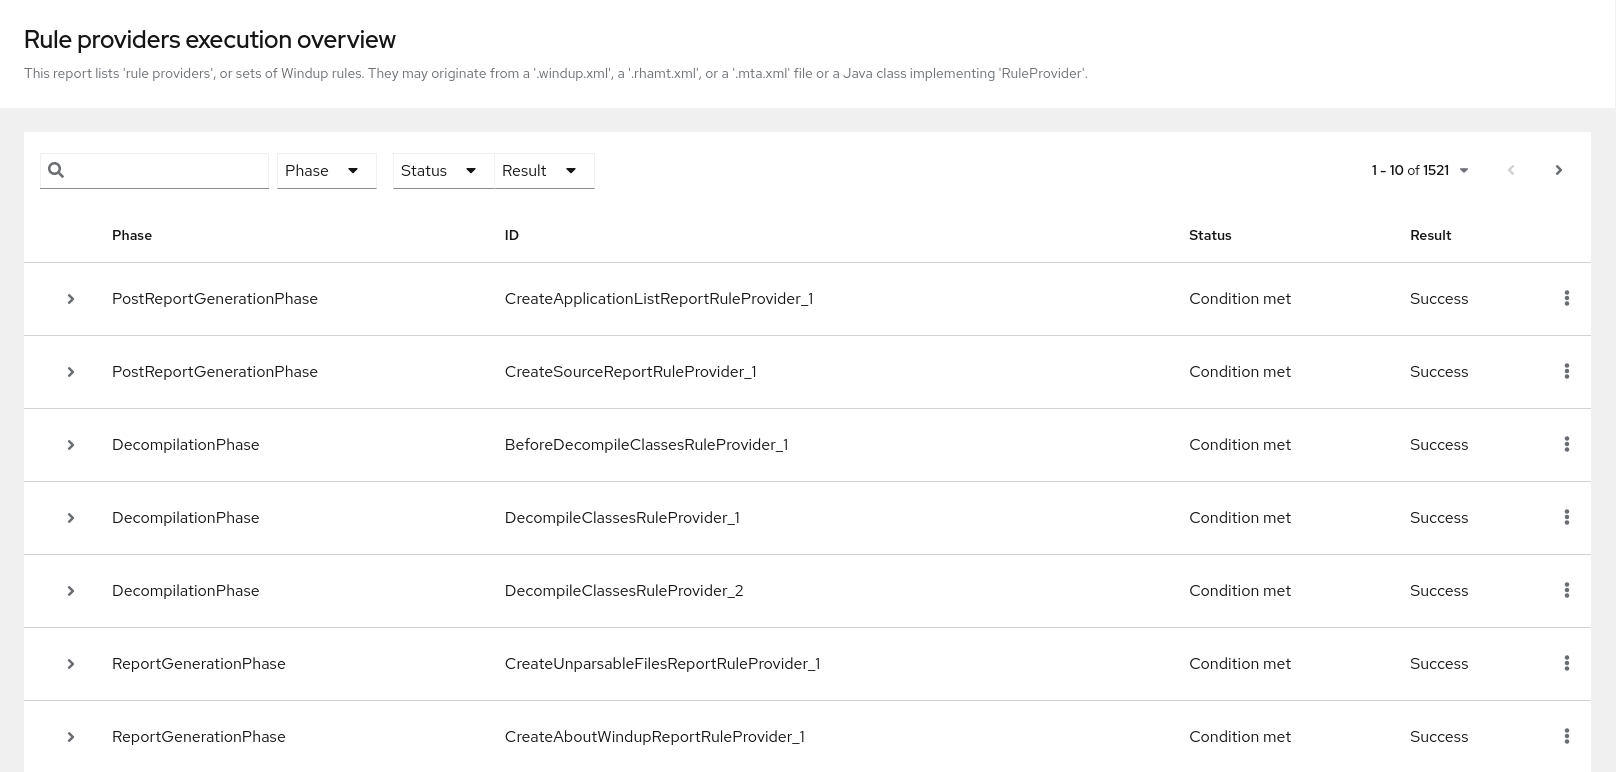
3.4. Rule providers execution overview
Access this report from the report landing page by clicking the Rule providers execution overview link.
This report provides the list of rules that ran when running the MTR migration command against the application.
Figure 3.13. Rule providers execution overview