Ce contenu n'est pas disponible dans la langue sélectionnée.
Chapter 10. Reviewing monitoring dashboards
OpenShift Container Platform 4.16 provides a comprehensive set of monitoring dashboards that help you understand the state of cluster components and user-defined workloads.
Use the Administrator perspective to access dashboards for the core OpenShift Container Platform components, including the following items:
- API performance
- etcd
- Kubernetes compute resources
- Kubernetes network resources
- Prometheus
- USE method dashboards relating to cluster and node performance
- Node performance metrics
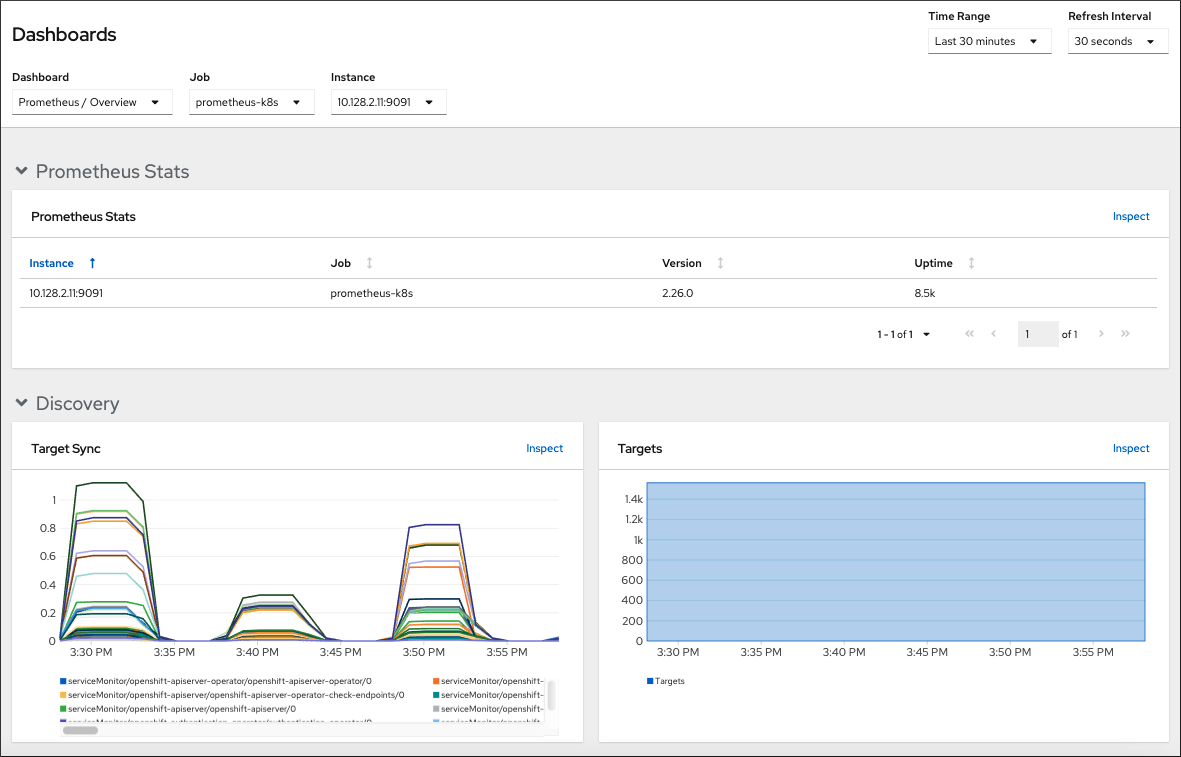
Figure 10.1. Example dashboard in the Administrator perspective
Use the Developer perspective to access Kubernetes compute resources dashboards that provide the following application metrics for a selected project:
- CPU usage
- Memory usage
- Bandwidth information
- Packet rate information
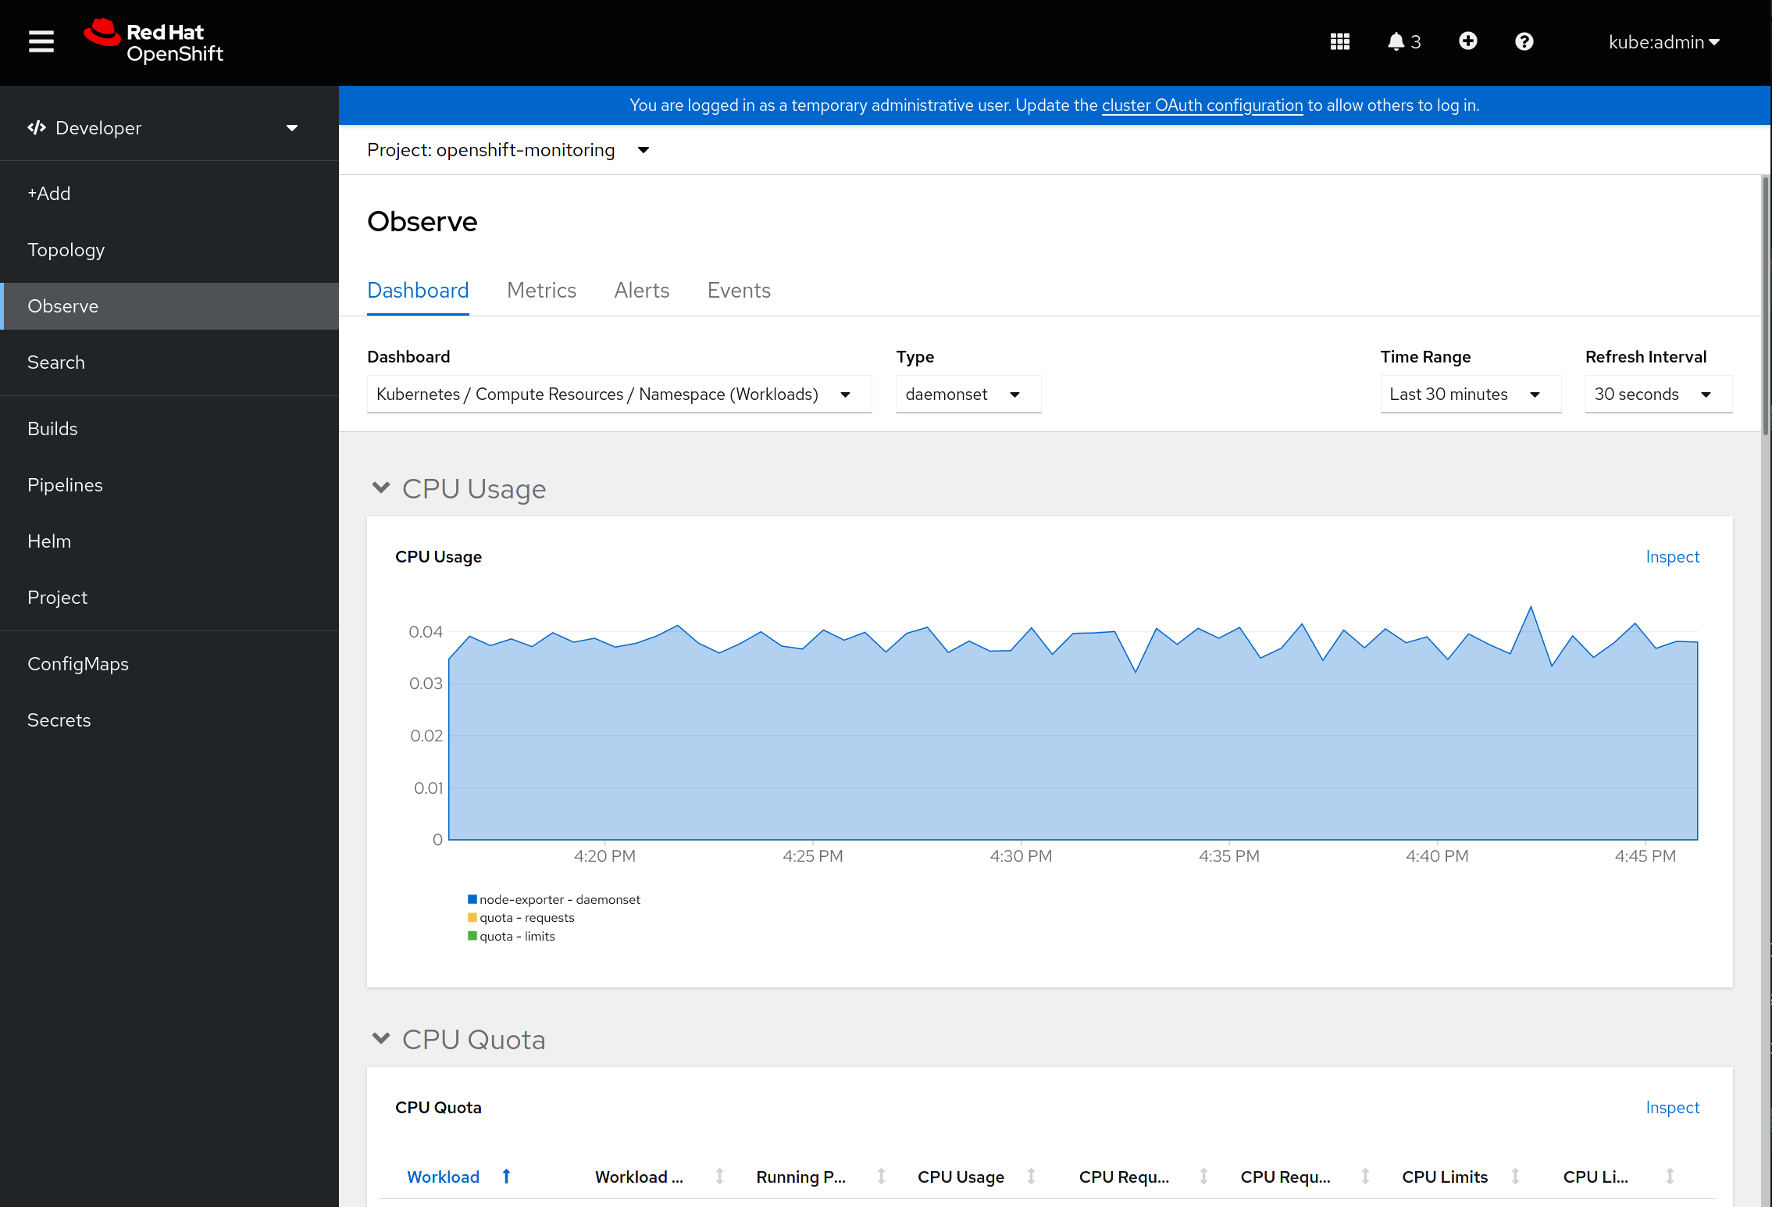
Figure 10.2. Example dashboard in the Developer perspective
In the Developer perspective, you can view dashboards for only one project at a time.
10.1. Reviewing monitoring dashboards as a cluster administrator
In the Administrator perspective, you can view dashboards relating to core OpenShift Container Platform cluster components.
Prerequisites
-
You have access to the cluster as a user with the
cluster-admincluster role.
Procedure
-
In the Administrator perspective in the OpenShift Container Platform web console, navigate to Observe
Dashboards. - Choose a dashboard in the Dashboard list. Some dashboards, such as etcd and Prometheus dashboards, produce additional sub-menus when selected.
Optional: Select a time range for the graphs in the Time Range list.
- Select a pre-defined time period.
Set a custom time range by selecting Custom time range in the Time Range list.
- Input or select the From and To dates and times.
- Click Save to save the custom time range.
- Optional: Select a Refresh Interval.
- Hover over each of the graphs within a dashboard to display detailed information about specific items.
10.2. Reviewing monitoring dashboards as a developer
In the Developer perspective, you can view dashboards relating to a selected project. You must have access to monitor a project to view dashboard information for it.
Prerequisites
- You have access to the cluster as a developer or as a user.
- You have view permissions for the project that you are viewing the dashboard for.
Procedure
-
In the Developer perspective in the OpenShift Container Platform web console, navigate to Observe
Dashboard. - Select a project from the Project: drop-down list.
Select a dashboard from the Dashboard drop-down list to see the filtered metrics.
NoteAll dashboards produce additional sub-menus when selected, except Kubernetes / Compute Resources / Namespace (Pods).
Optional: Select a time range for the graphs in the Time Range list.
- Select a pre-defined time period.
Set a custom time range by selecting Custom time range in the Time Range list.
- Input or select the From and To dates and times.
- Click Save to save the custom time range.
- Optional: Select a Refresh Interval.
- Hover over each of the graphs within a dashboard to display detailed information about specific items.
Additional resources