Ce contenu n'est pas disponible dans la langue sélectionnée.
Chapter 27. Editing running routes
Overview
You can experiment with changes to a running route without changing your project’s routing context.
To do so:
In the JMX Navigator view, enable the Edit Routes option on the running routing context.
This opens an in-memory model of it — Remote CamelContext:<camelContextId> — in the route editor.
In the route editor, make your changes to the in-memory model of the routing context. At the same time, you can set breakpoints on relevant nodes to use the Camel debugger and all of its features.
You can edit the in-memory model to add, remove, or rearrange nodes; to add or remove properties of existing nodes; and to modify property values set on existing nodes. You must save changes made to the in-memory model to update the running context and to see results in the Debug perspective if you set breakpoints.
- In the JMX Navigator view, drop messages on the running routing context, or wait for messages to arrive from a timer, ActiveMQ, file, or other continuous input node.
- In the Debug perspective, evaluate results and use the Camel debugger to gain deeper insight into your routing context.
Modifying a running route and evaluating results
- In the JMX Navigator view, select the routing context that contains the routes you want to edit.
Right-click the selected routing context to open the context menu, and select Edit Routes.
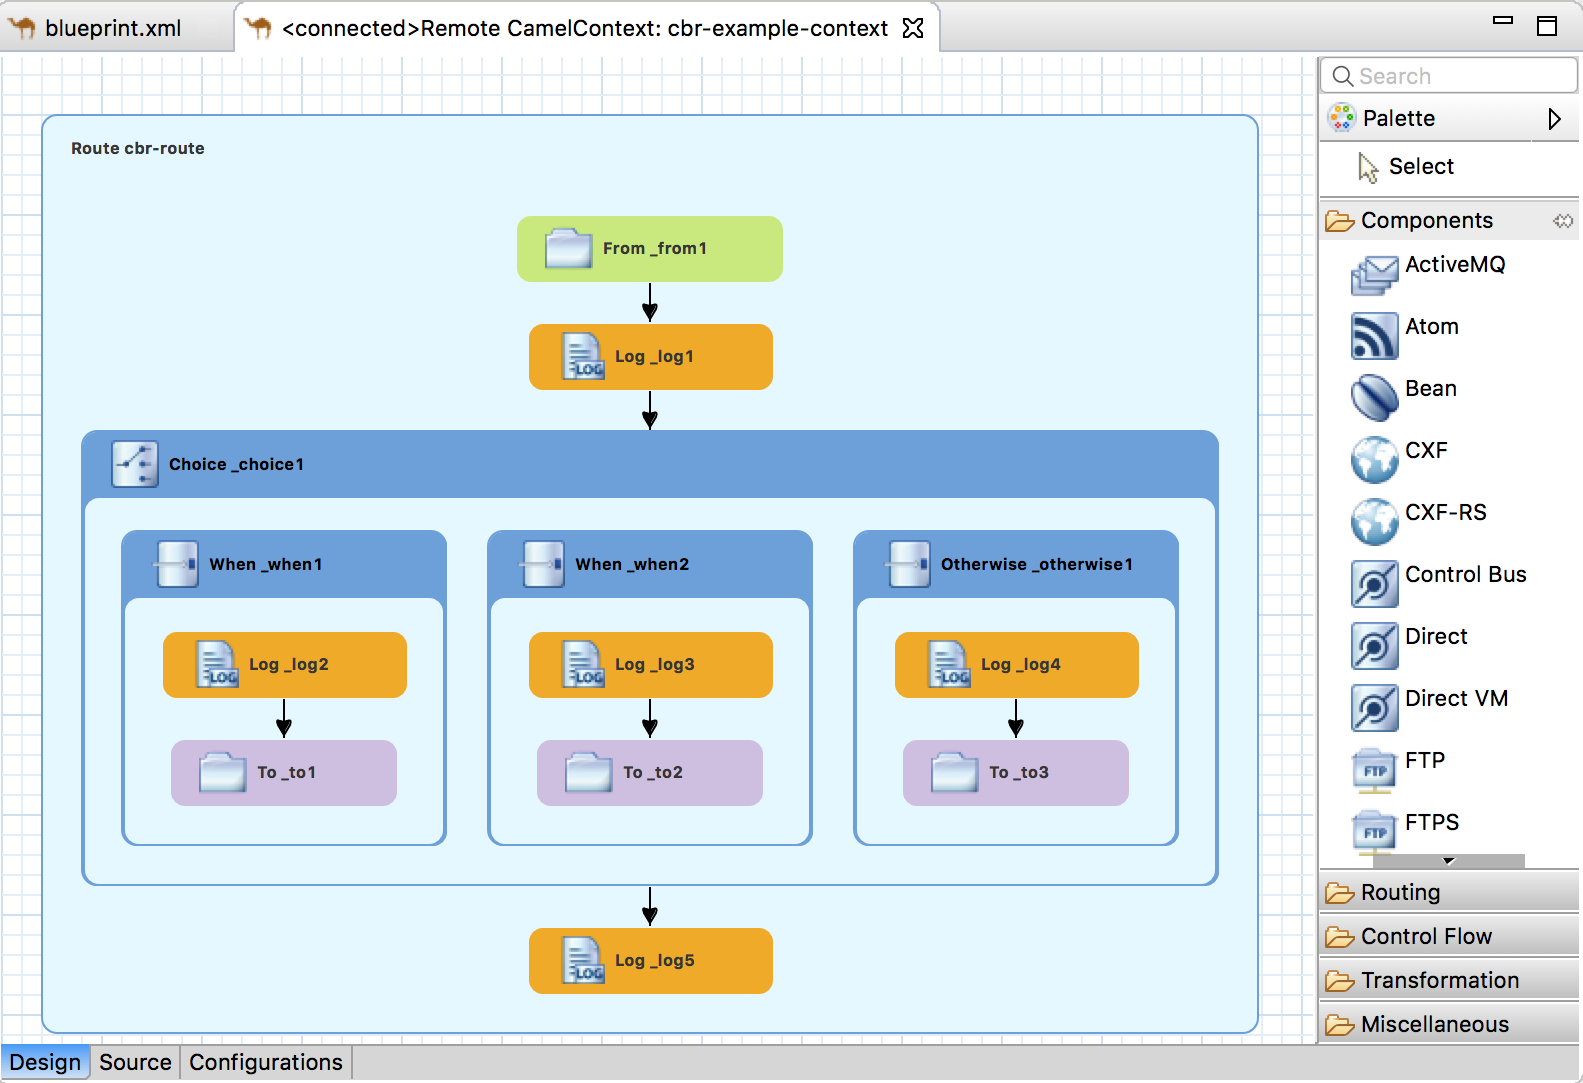
The route editor opens an in-memory model of the routing context, Remote CamelContext:<contextId>, and displays all routes in the context, for example:
 Note
Note<contextId>is the ID of thecamelContextelement in the project’s routing context .xmlfile. In this example, which is based on thebuilt-in template, the ID is cbr-example-context.-
Edit the route as described in Chapter 6, Editing a routing context in the route editor, then select
to save the changes you made to the in-memory model and to update the running routing context. - Set breakpoints on the relevant nodes as described in Chapter 15, Setting Breakpoints.
In the JMX Navigator view, drop a message on the running routing context’s input node.
If your project does not include test messages, you can create them as described in Section 24.1, “Creating test messages for route tracing”.
- Click to confirm the switch to the Debug perspective.
In the Camel debugger, step the message through the breakpoints as you normally would (see Chapter 16, Running the Camel Debugger) to see the results your changes generated.
The Camel debugger behaves the same in Edit Routes mode as in normal debug mode, so you can use any of the Camel debugger’s features while a message is transiting the routing context.
NoteWhen a message reaches the end of the routing context, the debugger is suspended. To continue debugging, switch back to the Fuse Integration perspective and drop another message on the input node in the JMX Navigator view. Each time you do so, the tooling asks you to confirm the switch to the Debug perspective.
NoteDuring a route editing session, it is possible to lose the connection to the running routing context. If this happens, then in the JMX Navigator view, you would see something like this:
[Disconnected]]. To continue the session, you must reconnect to the running routing context, select it in the JMX Navigator view, and then re-select Edit Routes.
Terminating the route editing session
-
In the Debug perspective’s Debug view, select the Remote Camel Debug - camelContext--<contextId>--xxxxxxxxxxxxxxxxxx.xml [Remote Camel Context] thread, and then click
 on the menu bar to terminate the debugging session.
-
On Console view’s menu bar, click
 to terminate the routing context.
-
If you want to clear console output, click
 on the Console view’s menu bar.
-
Switch to the Fuse Integration perspective, and in the route editor, click
 on the Remote CamelContext:<contextId> tab to close the in-memory model of the routing context file.