Ce contenu n'est pas disponible dans la langue sélectionnée.
Chapter 3. Dashboard Overview
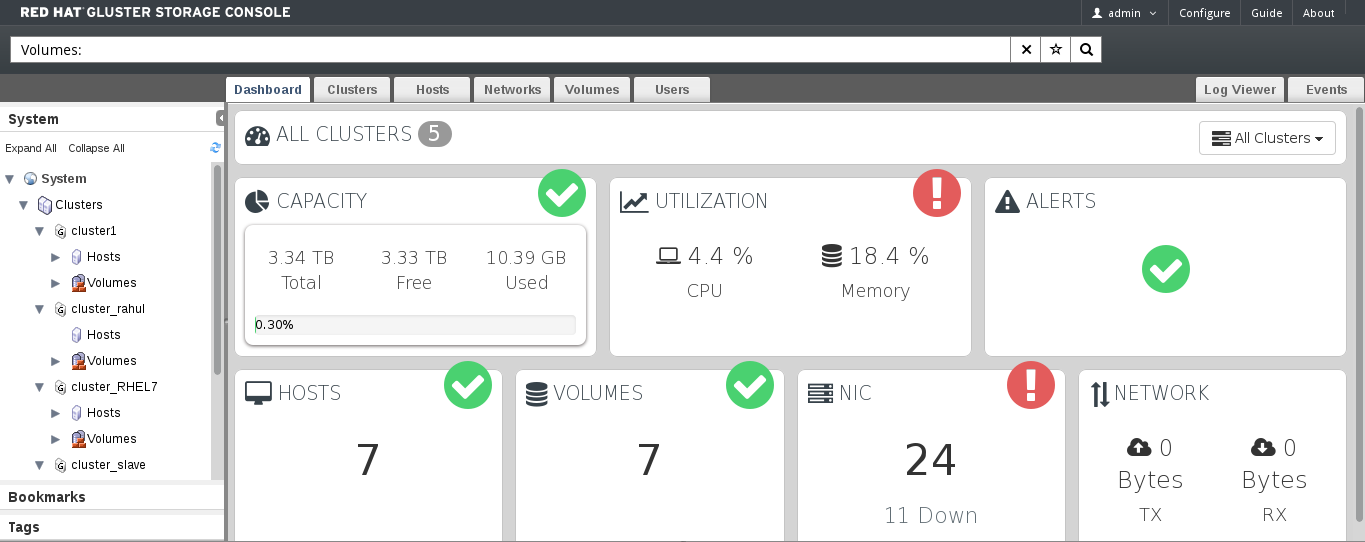
Red Hat Gluster Storage Console Dashboard displays an overview of all the entities in Red Hat Gluster Storage like Hosts, Volumes, Bricks, and Clusters. The Dashboard shows a consolidated view of the system and helps the administrator to know the status of the system. Listed below are the Dashboard items in Red Hat Gluster Storage Console:
- Capacity: Displays the Total, Used and Available storage capacity in the system. Its calculated by aggregating data from all the hosts in the System.
- Utilization: Displays the average usage percentage of CPU, Memory. This is averaged across all the hosts in system.
- Alerts : Displays the number of alerts in the system. The Alerts tab will display a red exclamation icon if there is an alert ot alerts. Click on the alerts arrow icon to open the alerts dialog box. To delete the alert/alerts, click the cross icon at the right hand side of the dialogue box.
- Hosts: Displays the total number of Hosts in the system and the number of hosts in down state.
- Volumes:Displays the total number of volumes in the system across all cluster and number of them in UP, DOWN, Degraded, Partial, or Stopped status.
- NICs: Displays the number of network interfaces in the hosts.
- Network: Displays the transmission and receiving rate of the NICs.
Note
Top Utilization popup: To see the top utlizers for Capacity, Utilization, and Network, hover over the individual tabs and a popup will appear with the top utilization data.
3.1. Viewing Cluster Summary
Copier lienLien copié sur presse-papiers!
Procedure 3.1. Viewing Cluster Summary
- In Dashboard tab, select the cluster name from drop-down list to view cluster capacity details of a specific cluster.Select All Clusters to view cluster capacity details of all clusters.
Figure 3.1. Dashboard Overview
- View the cluster and volume details by hovering over each dashboard item.
- Click CAPACITY or VOLUMES to view the cluster and volume details respectively.
- Click UTILIZATION, HOST, NIC, or NETWORK to view the host and network details.
Note
Clicking each item takes you to corresponding tab in Red Hat Gluster Storage Console.