Ce contenu n'est pas disponible dans la langue sélectionnée.
Chapter 2. Monitoring performance
You can monitor JBoss EAP performance using any tool that can examine JVMs running on your machine. Red Hat recommends that you use either JConsole, for which JBoss EAP includes a preconfigured wrapper script, or Java Mission Control (JMC). Both these tools provide basic monitoring of JVM processes, including memory usage, thread utilization, loaded classes, and other JVM metrics.
If you will be running one of these tools locally on the same machine that JBoss EAP is running on, then no configuration is necessary. However, if you will be running one of these tools to monitor JBoss EAP running on a remote machine, then some configuration is required for JBoss EAP to accept remote JMX connections.
2.1. Configuring JBoss EAP for remote monitoring connections
2.1.1. Configuring remote monitoring connections for a standalone server
Procedure
- Ensure that you have created a management user. You might want to create a separate management user to monitor your JBoss EAP server.
When starting JBoss EAP, bind the management interface to the IP address that you will use to remotely monitor the server:
$ EAP_HOME/bin/standalone.sh -bmanagement=IP_ADDRESS
WarningThis exposes all the JBoss EAP management interfaces, including the management console and management CLI, to the specified network. Ensure that you only bind the management interface to a private network.
Use the following URI with your management user name and password in your JVM monitoring tool to connect to the JBoss EAP server. The URI below uses the default management port (
9990).service:jmx:remote+http://IP_ADDRESS:9990
2.1.2. Configuring JBoss EAP remote monitoring connections for a managed domain host
Using the preceding procedure of binding the management interface on a managed domain host will only expose the host controller JVM for remote monitoring, and not the individual JBoss EAP servers running on that host.
To configure JBoss EAP to remotely monitor individual servers on a managed domain host, follow the procedure below.
Procedure
-
Create a new user in the
ApplicationRealmthat you will use to connect to the JBoss EAP servers for remote monitoring. To configure the
remotingsubsystem to use Elytron, execute the following commands:/profile=full/subsystem=jmx/remoting-connector=jmx:add(use-management-endpoint=false) /socket-binding-group=full-sockets/socket-binding=remoting:add(port=4447) /profile=full/subsystem=remoting/connector=remoting-connector:add(socket-binding=remoting,sasl-authentication-factory=application-sasl-authentication)
When starting your JBoss EAP managed domain host, bind one or both of the following interfaces to an IP address that you will use for monitoring.
If you want to connect to individual JBoss EAP server JVMs running on your managed domain host, bind the public interface:
$ EAP_HOME/bin/domain.sh -b=IP_ADDRESS
If you want to connect to the JBoss EAP host controller JVM, also bind the management interface:
$ EAP_HOME/bin/domain.sh -bmanagement=IP_ADDRESS
WarningThis exposes all the JBoss EAP management interfaces, including the management console and management CLI, to the specified network. Ensure that you only bind the management interface to a private network.
Use the following details in your JVM monitoring tool:
To connect to individual JBoss EAP server JVMs running on your managed domain host, use the following URI with your
ApplicationRealmuser name and password that was created earlier.service:jmx:remote+http://IP_ADDRESS:4447To connect to different JBoss EAP servers on a single host, add the respective server’s port offset value to the above port number.
To connect to the JBoss EAP host controller JVM, use the following URI with a management user name and password.
service:jmx:remote+http://IP_ADDRESS:9990
2.2. JConsole
A preconfigured JConsole wrapper script is bundled with JBoss EAP. Using this wrapper script ensures that all the required libraries are added to the class path, and also provides access to the JBoss EAP management CLI from within JConsole.
2.2.1. Connecting to a local JBoss EAP JVM using JConsole
To connect to a JBoss EAP JVM running on the same machine as JConsole:
Procedure
-
Run the
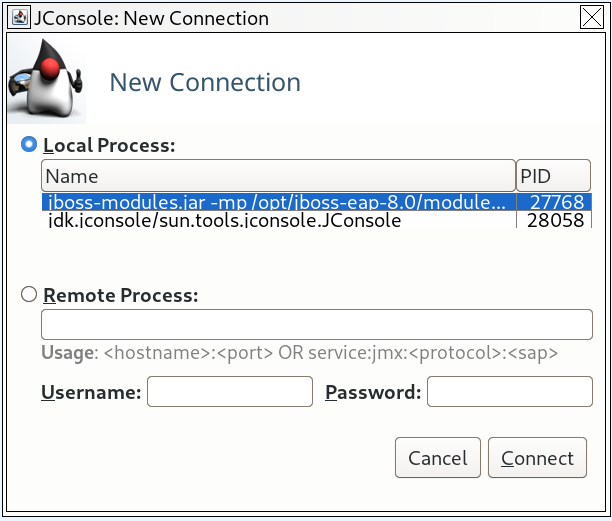
jconsolescript inEAP_HOME/bin. Under Local Process, select the JBoss EAP JVM process that you want to monitor.
For a standalone JBoss EAP server, there is one JBoss EAP JVM process.
Figure 2.1. JConsole Local Standalone JBoss EAP Server JVM
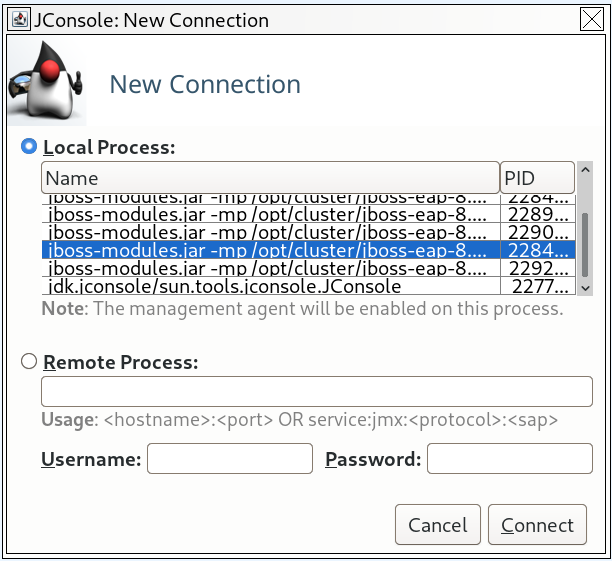
A JBoss EAP managed domain host has multiple JVM processes you can connect to: a host controller JVM process, a process controller JVM process, and a JVM process for each JBoss EAP server on the host. You can determine which JVM you have connected to by looking at the JVM arguments.
Figure 2.2. JConsole Local Managed Domain JBoss EAP JVMs
- Click Connect.
2.2.2. Connecting to a Remote JBoss EAP JVM Using JConsole
You can use JConsole to connect to a remote JBoss EAP JVM using the jconsole script.
Prerequisites
- Configure JBoss EAP for remote monitoring connections.
- Download and extract a ZIP installation of JBoss EAP to your local machine.
Procedure
-
Run the
jconsolescript inEAP_HOME/bin. Under Remote Process, insert the URI for the remote JBoss EAP JVM process that to want to monitor.
Figure 2.3. JConsole Remote JBoss EAP JVM
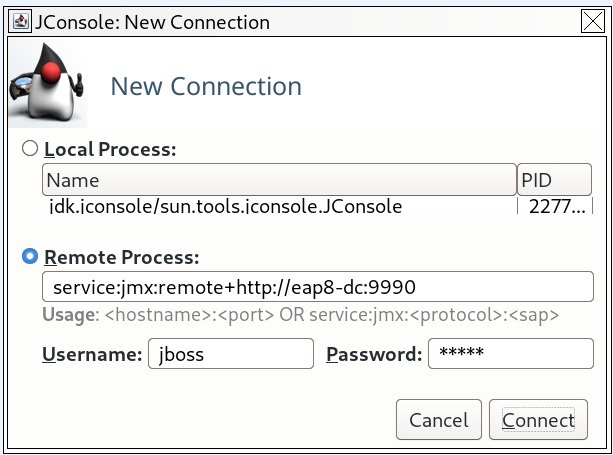
- Ensure that you provide the user name and password for the monitoring connection.
- Click Connect.
2.3. Java Mission Control
Developers can use Java Mission Control (JMC) to identify performance issues. JMC is a profiling and diagnostic tool that consists of the following components:
- Java Virtual Machine (JVM) Browser to view running Java applications and their related JVMs.
- Java Management (JMX) Console to monitor JVMs.
- Java Flight Recorder (JFR) to collect diagnostic data from running Java applications.
- Plug-ins for heap dump analysis.
Additional resources
- For more information about connecting JMC to local or remote JBoss EAP JVMs, see How to connect Java Mission Control with EAP remotely? on the Red Hat Customer Portal.
- For more information about downloading and installing JMC, see Install JDK Mission Control and Supported Plug-ins section of the Oracle JDK Mission Control user guide.