Ce contenu n'est pas disponible dans la langue sélectionnée.
Chapter 12. Monitoring Tools Configuration
Monitoring tools are an optional suite of tools designed to help operators maintain an OpenStack environment. The tools perform the following functions:
- Centralized logging: Allows you gather logs from all components in the OpenStack environment in one central location. You can identify problems across all nodes and services, and optionally, export the log data to Red Hat for assistance in diagnosing problems.
- Availability monitoring: Allows you to monitor all components in the OpenStack environment and determine if any components are currently experiencing outages or are otherwise not functional. You can also receive notifications when problems occur to optimize your response time.
12.1. Architecture
Monitoring tools use a client-server model with the client deployed onto the Red Hat OpenStack Platform overcloud nodes. The Fluentd service provides client-side centralized logging (CL) and the Sensu client service provides client-side availability monitoring (AM).
12.1.1. Centralized Logging
Centralized logging allows you to have one central place to view logs across your entire OpenStack environment. These logs come from the operating system, such as syslog and audit log files, infrastructure components such as RabbitMQ and MariaDB, and OpenStack services such as Identity, Compute, and others.
The centralized logging toolchain consists of a number of components, including:
- Log Collection Agent (Fluentd)
- Log Relay/Transformer (Fluentd)
- Data Store (Elasticsearch)
- API/Presentation Layer (Kibana)
The director does not deploy the server-side components for centralized logging. Red Hat does not support server-side components including the Elasticsearch database, Kibana, and Fluentd with plugins running as a log aggregator.
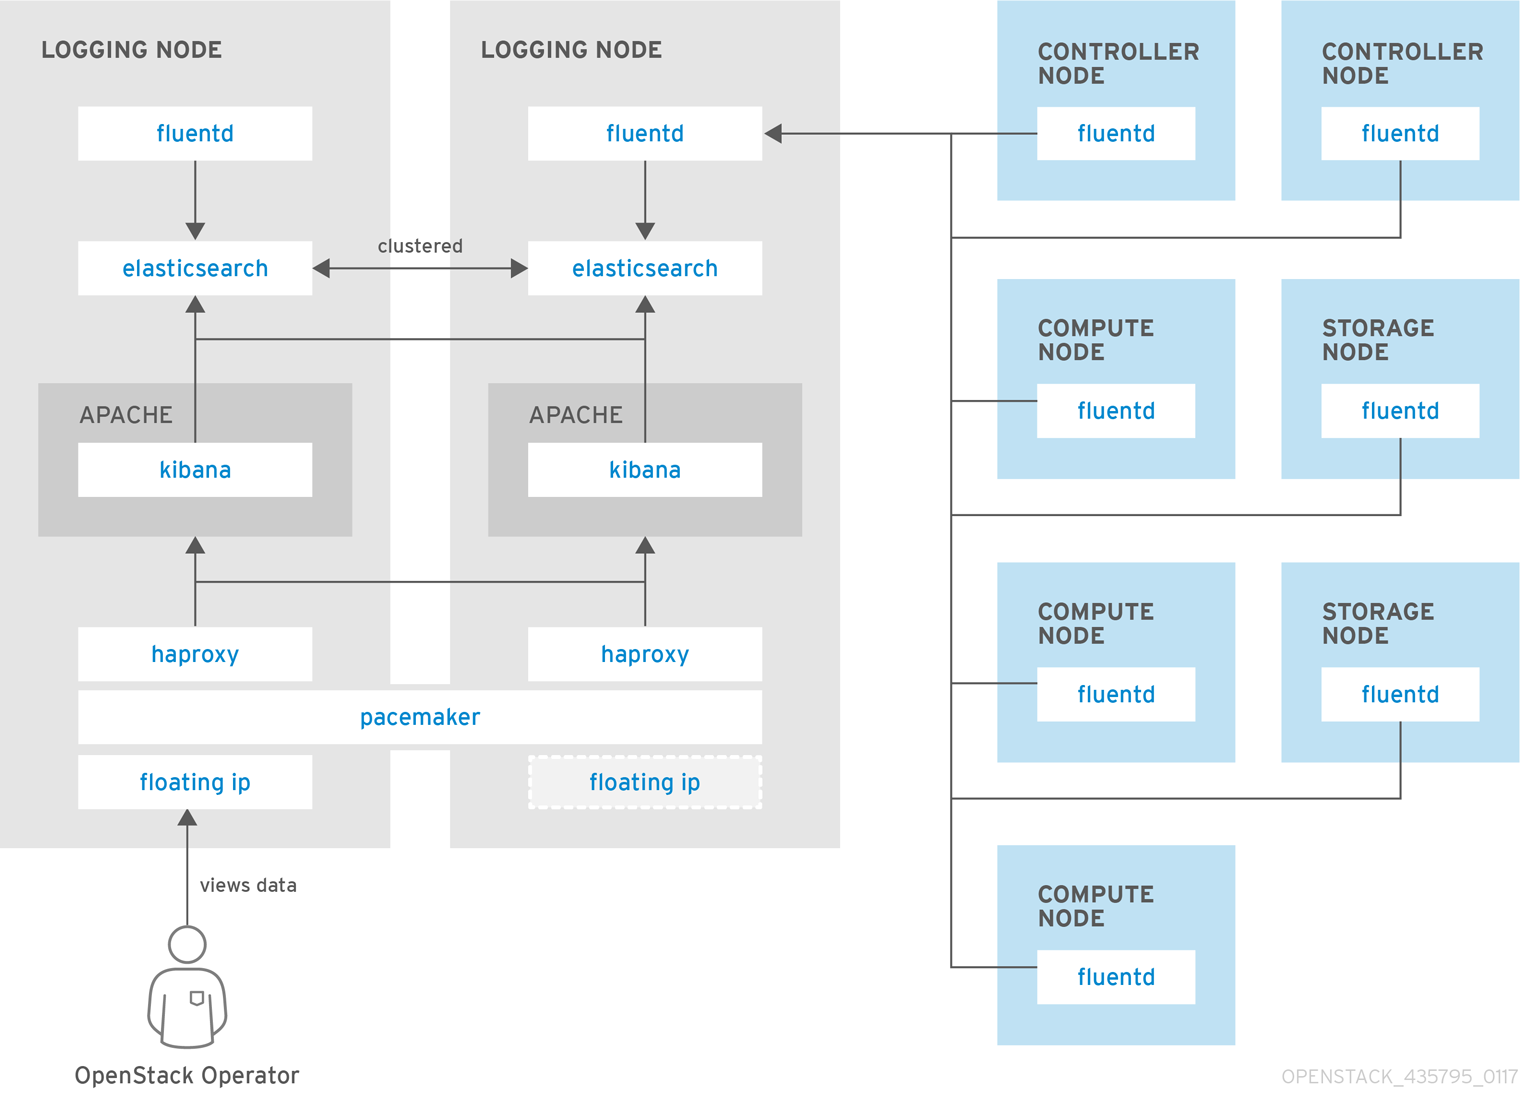
The centralized logging components and their interactions are laid out in the following diagrams:
Items shown in blue denote Red Hat-supported components.
Figure 12.1. Centralized logging architecture at a high level

Figure 12.2. Single-node deployment for Red Hat OpenStack Platform
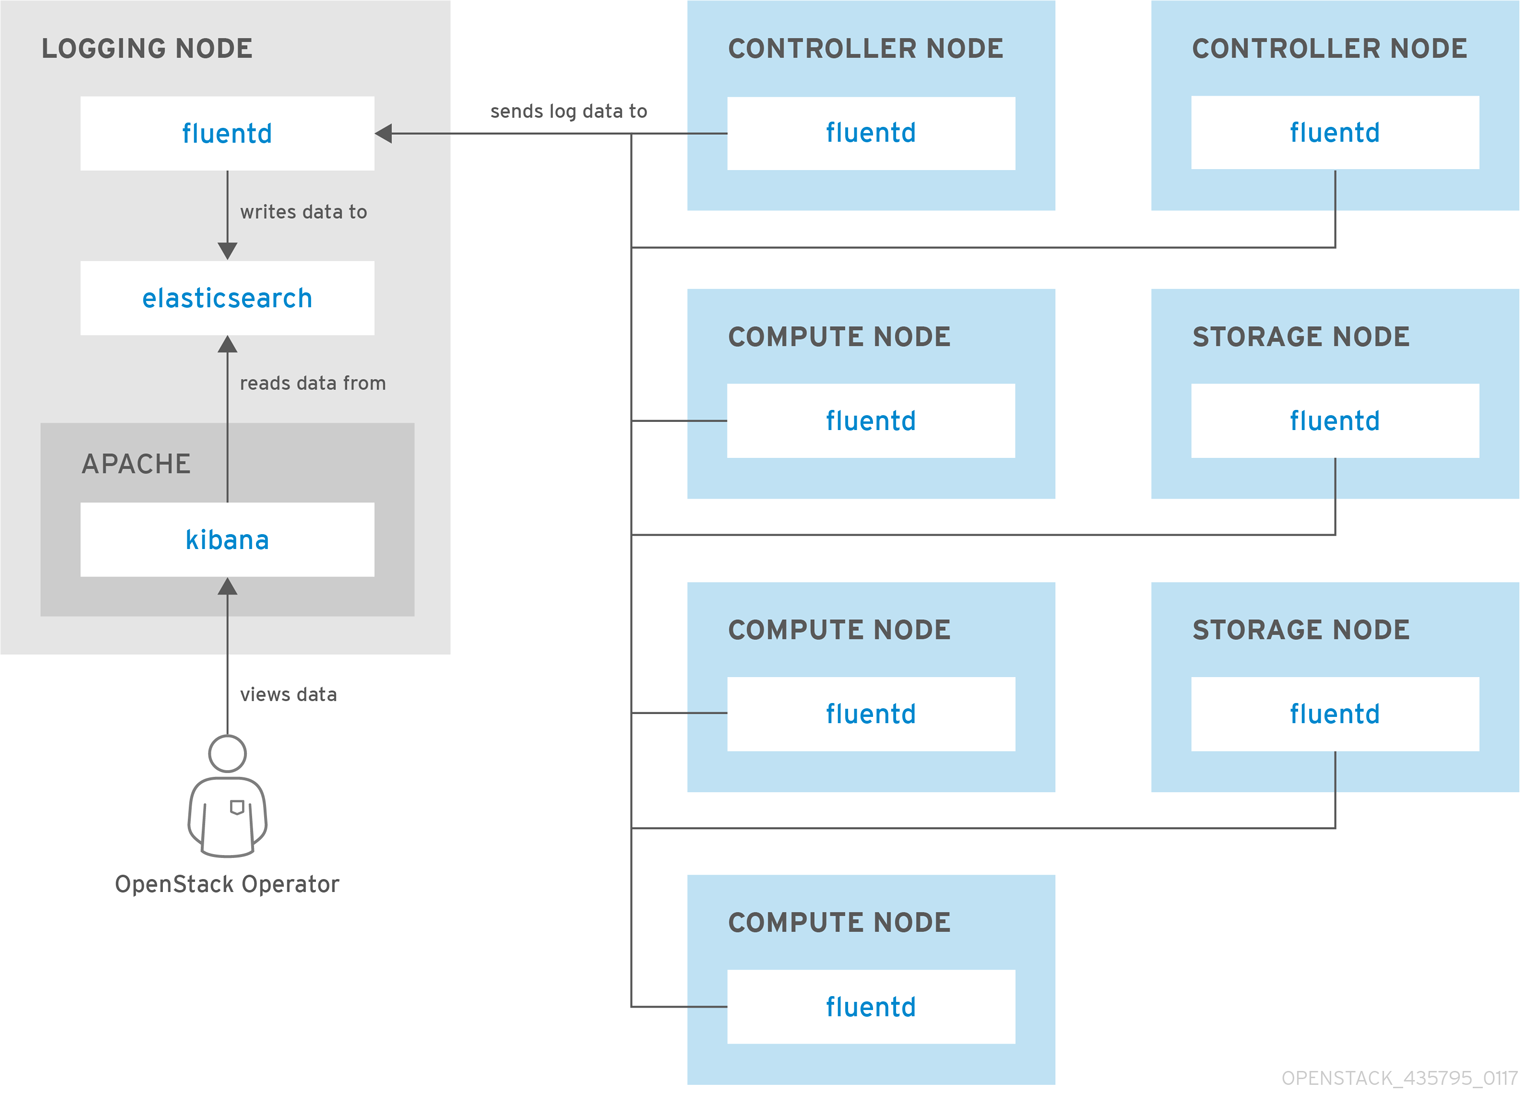
Figure 12.3. HA deployment for Red Hat OpenStack Platform
12.1.2. Availability Monitoring
Availability monitoring allows you to have one central place to monitor the high-level functionality of all components across your entire OpenStack environment.
The availability monitoring toolchain consists of a number of components, including:
- Monitoring Agent (Sensu client)
- Monitoring Relay/Proxy (RabbitMQ)
- Monitoring Controller/Server (Sensu server)
- API/Presentation Layer (Uchiwa)
The director does not deploy the server-side components for availability monitoring. Red Hat does not support server-side components including Uchiwa, Sensu Server, the Sensu API plus RabbitMQ, and a Redis instance running on a monitoring node.
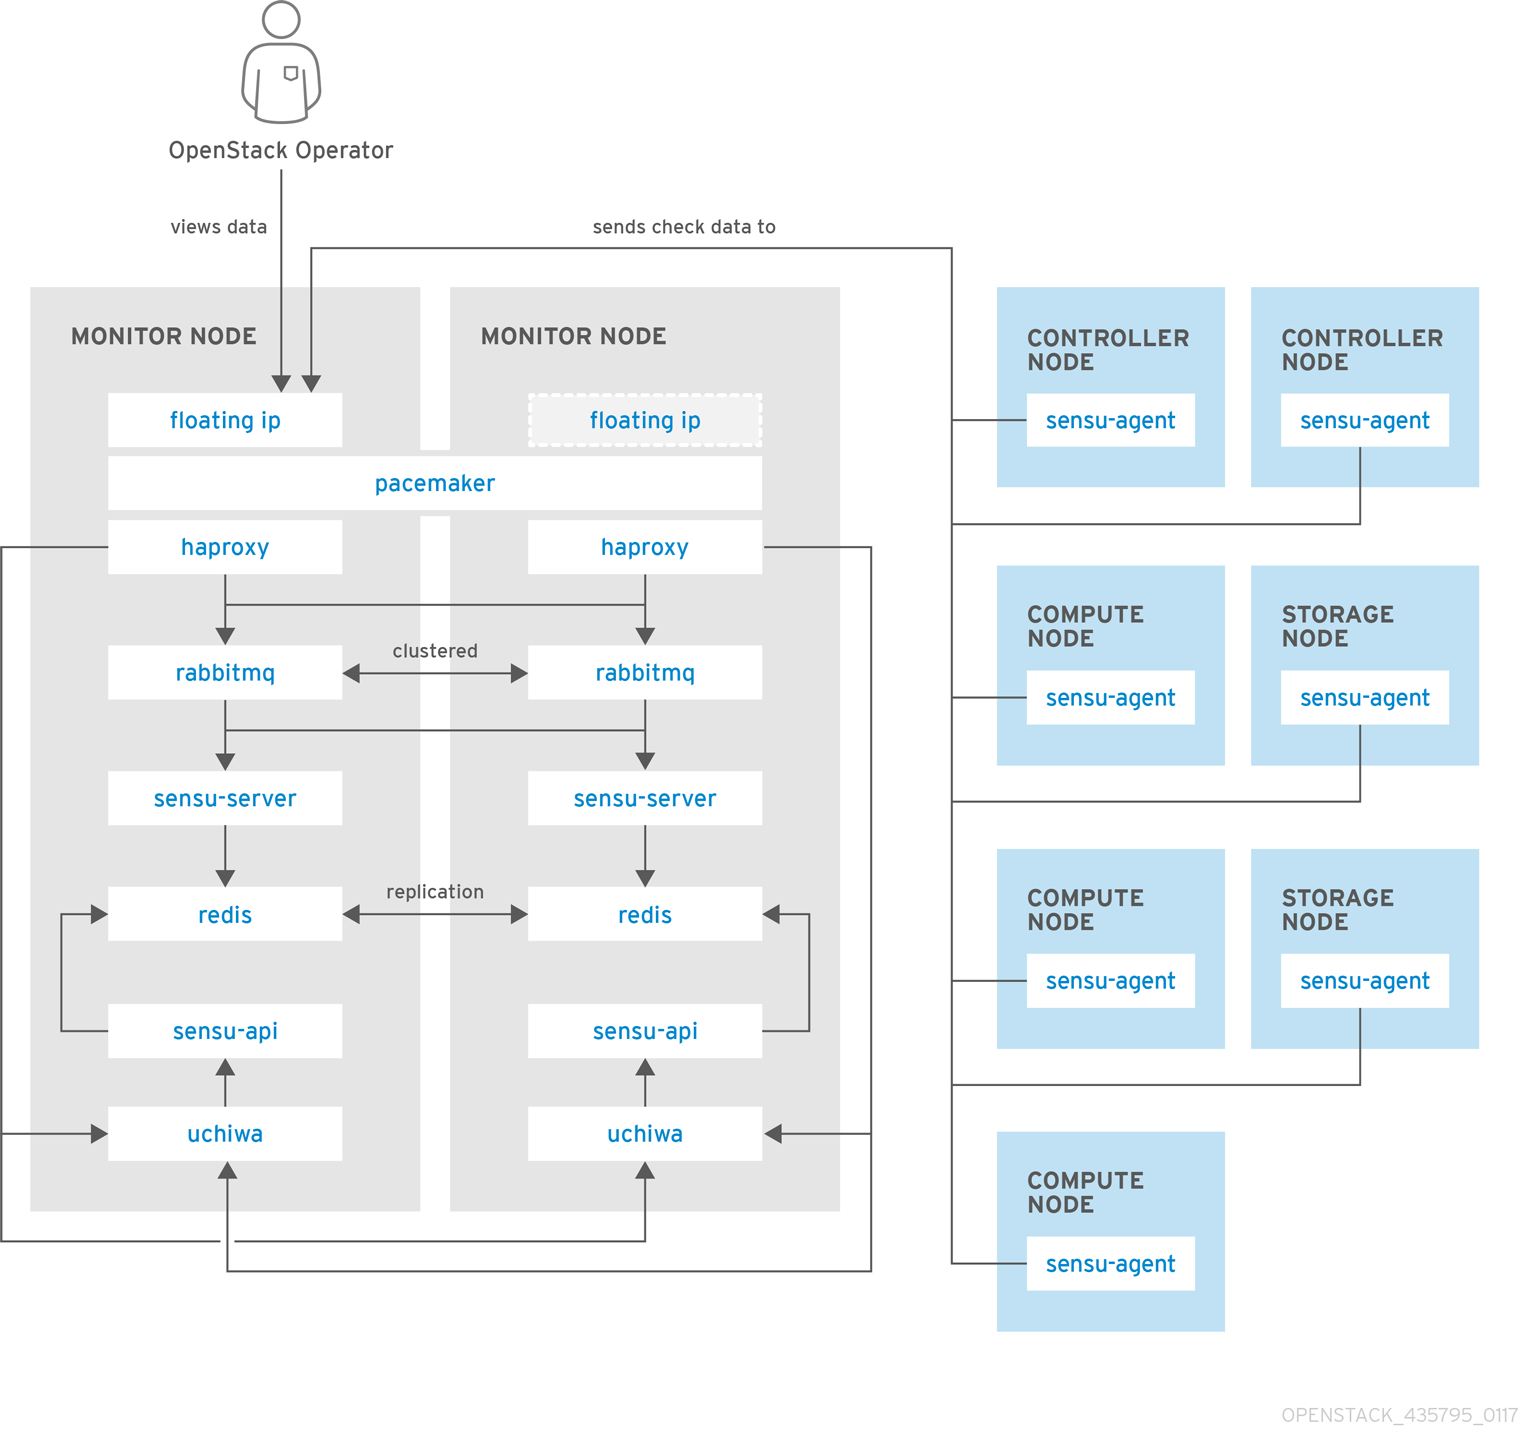
The availability monitoring components and their interactions are laid out in the following diagrams:
Items shown in blue denote Red Hat-supported components.
Figure 12.4. Availability monitoring architecture at a high level
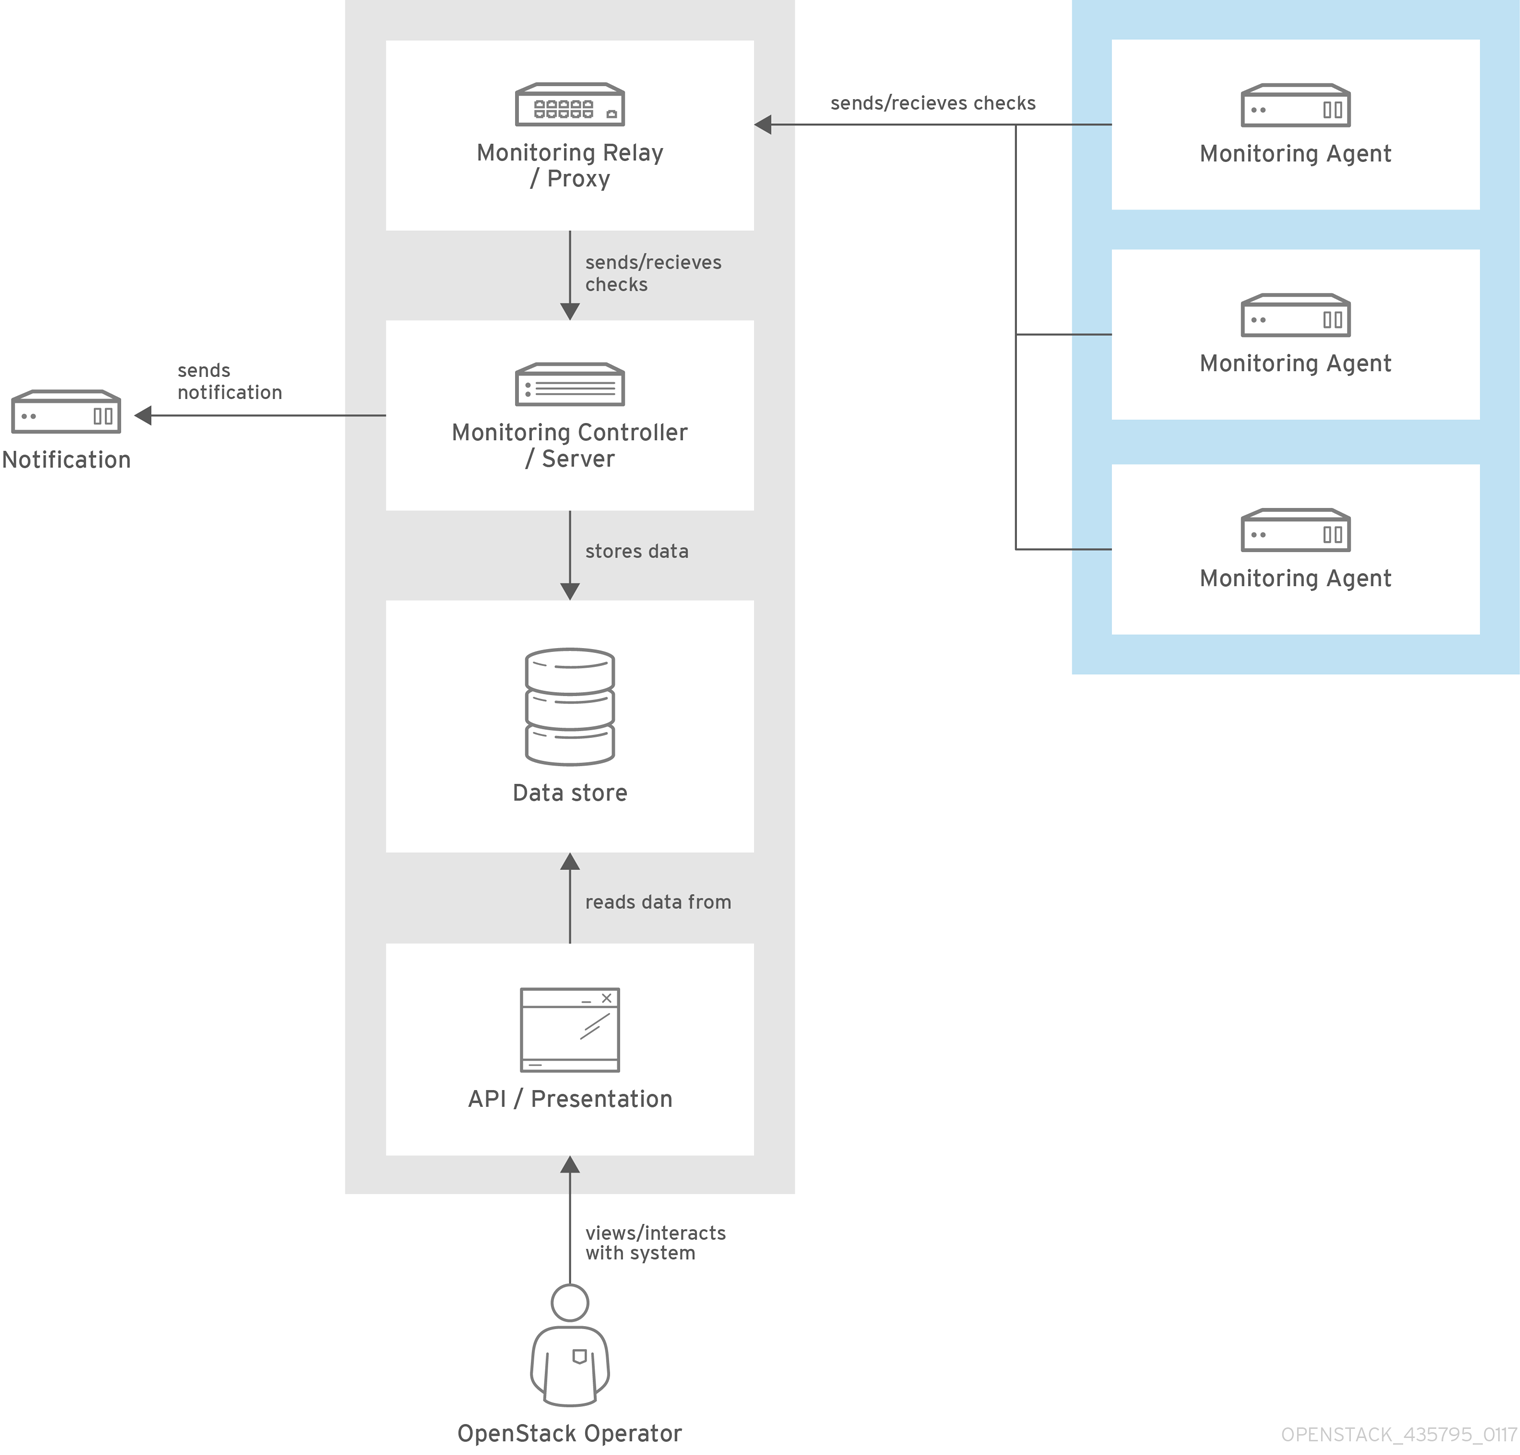
Figure 12.5. Single-node deployment for Red Hat OpenStack Platform

Figure 12.6. HA deployment for Red Hat OpenStack Platform
12.2. Install the Client-Side Tools
Prior to overcloud deployment, you need to determine the configuration settings to apply to each client. Copy the example environment files from the director’s Heat template collection and modify them to suit your environment.
12.2.1. Set Centralized Logging Client Parameters
For Fluentd configuration settings, copy /usr/share/openstack-tripleo-heat-templates/environments/logging-environment.yaml and modify the file to suit your environment. For example:
Simple configuration
Example SSL configuration
-
LoggingServers- The destination system that will receive Fluentd log messages. -
LoggingUsesSSL- Setting that determines whethersecure_forwardis used when forwarding log messages. -
LoggingSharedKey- The shared secret used bysecure_forward. -
LoggingSSLCertificate- The PEM-encoded contents of the SSL CA certificate.
12.2.2. Set Availability Monitoring Client Parameters
For the Sensu client configuration settings, copy /usr/share/openstack-tripleo-heat-templates/environments/monitoring-environment.yaml and modify the file to suit your environment. For example:
-
MonitoringRabbit*- These parameters connect the Sensu client services to the RabbitMQ instance that runs on the monitoring server. -
MonitoringRabbitUseSSL- This parameter is not currently available for availability monitoring. -
SensuClientCustomConfig- Specify additional Sensu client configuration. Defines the OpenStack credentials to be used, including username/password, auth_url, tenant, and region.
12.2.3. Install Operational Tools on Overcloud Nodes
Include the modified YAML files with your openstack overcloud deploy command to install the Sensu client and Fluentd tools on all overcloud nodes. For example:
openstack overcloud deploy --templates -e /usr/share/openstack-tripleo-heat-templates/environments/network-isolation.yaml -e network-environment.yaml -e ~/templates/monitoring-environment.yaml -e ~/templates/logging-environment.yaml --control-scale 3 --compute-scale 1 --ntp-server 192.168.122.10
$ openstack overcloud deploy --templates -e /usr/share/openstack-tripleo-heat-templates/environments/network-isolation.yaml -e network-environment.yaml -e ~/templates/monitoring-environment.yaml -e ~/templates/logging-environment.yaml --control-scale 3 --compute-scale 1 --ntp-server 192.168.122.1012.3. Install the Server-Side Components
Red Hat does not support the server-side components and their deployment process.
You can use the opstools-ansible playbook to install the server-side components onto Red Hat Enterprise Linux 7. These server-side components include availability monitoring and centralized logging services that complement the Red Hat-supported client-side components. The most tested opstools-ansible scenario is the deployment of server-side components onto CentOS 7. Detailed instructions can be found in the README.md: https://github.com/centos-opstools/opstools-ansible
12.4. Monitor the OpenStack Platform
See the Sensu documentation for further details about the Sensu stack infrastructure: https://sensuapp.org/docs/latest/overview/architecture.html
Red Hat supplies a set of check scripts in the osops-tools-monitoring-oschecks package. The majority of the check scripts only check the API connection to the OpenStack component. However, certain scripts also perform additional OpenStack resource tests for OpenStack Compute (nova), OpenStack Block Storage (cinder), OpenStack Image (glance), and OpenStack Networking (neutron). For example, the OpenStack Identity (keystone) API check gives the following result when keystone is running:
OK: Got a token, Keystone API is working.
OK: Got a token, Keystone API is working.12.5. Validate the Sensu Client Installation
Check the status of the
sensu-clienton each overcloud node:systemctl status sensu-client
# systemctl status sensu-clientCopy to Clipboard Copied! Toggle word wrap Toggle overflow -
Review the error log for any issues:
/var/log/sensu/sensu-client.log -
Verify that each overcloud node has the
/etc/sensu/conf.d/rabbitmq.jsonfile that sets the IP address of the monitoring server.
12.6. Review the State of a Node
If you have a deployment of the Uchiwa dashboard, you can use it with the Sensu server to review the state of your nodes:
Login to the Uchiwa dashboard and click the
Data Centertab to confirm that the Data Center is operational.http://<SERVER_IP_ADDRESS>/uchiwa
http://<SERVER_IP_ADDRESS>/uchiwaCopy to Clipboard Copied! Toggle word wrap Toggle overflow -
Check that all overcloud nodes are in a
Connectedstate. - At a suitable time, reboot one of the overcloud nodes and review the rebooted node’s status in the Uchiwa dashboard. After the reboot completes, verify that the node successfully re-connects to the Sensu server and starts executing checks.
12.7. Review the State of an OpenStack Service
This example tests the monitoring of the openstack-ceilometer-central service.
Confirm that the
openstack-ceilometer-centralservice is running:systemctl status openstack-ceilometer-central.service
systemctl status openstack-ceilometer-central.serviceCopy to Clipboard Copied! Toggle word wrap Toggle overflow -
Connect to the Uchiwa dashboard and confirm that a successful
ceilometercheck is present and running as defined in theceilometerJSON file. Stop the
openstack-ceilometer-centralservice.NoteThis may disrupt services, so run this test at an appropriate time.
systemctl stop openstack-ceilometer-central.service
systemctl stop openstack-ceilometer-central.serviceCopy to Clipboard Copied! Toggle word wrap Toggle overflow -
Log in to the Uchiwa dashboard and confirm that the failed
ceilometercheck has been reported. Start the
openstack-ceilometer-centralservice:systemctl start openstack-ceilometer-central.service
systemctl start openstack-ceilometer-central.serviceCopy to Clipboard Copied! Toggle word wrap Toggle overflow -
Log in to the Uchiwa dashboard and view the time interval between the
ceilometercheck reports to confirm that the check runs in the time interval defined in theceilometerJSON file.