Ce contenu n'est pas disponible dans la langue sélectionnée.
Chapter 2. Console monitoring and alerting
Red Hat Quay provides monitoring and alerting features in the OpenShift Container Platform console for instances deployed by the Operator. You can use Grafana dashboards, individual metrics, and alerts to monitor registry performance and receive notifications when Quay pods restart frequently.
To enable the monitoring features, you must select All namespaces on the cluster as the installation mode when installing the Red Hat Quay Operator.
2.1. Dashboard
On the OpenShift Container Platform console, click Monitoring
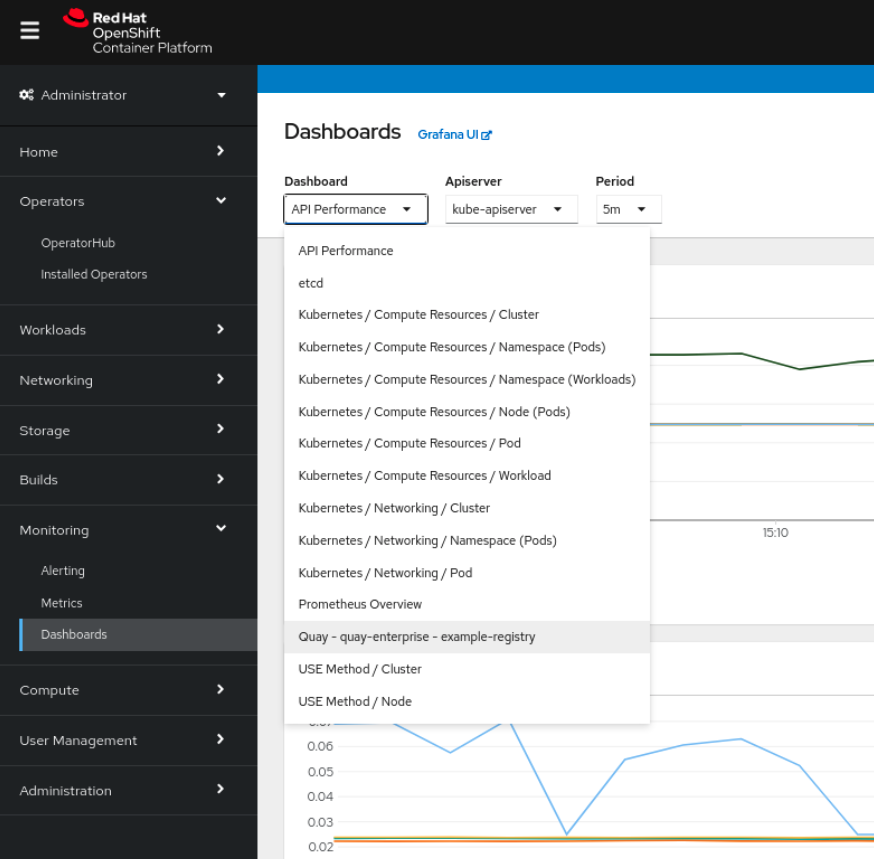
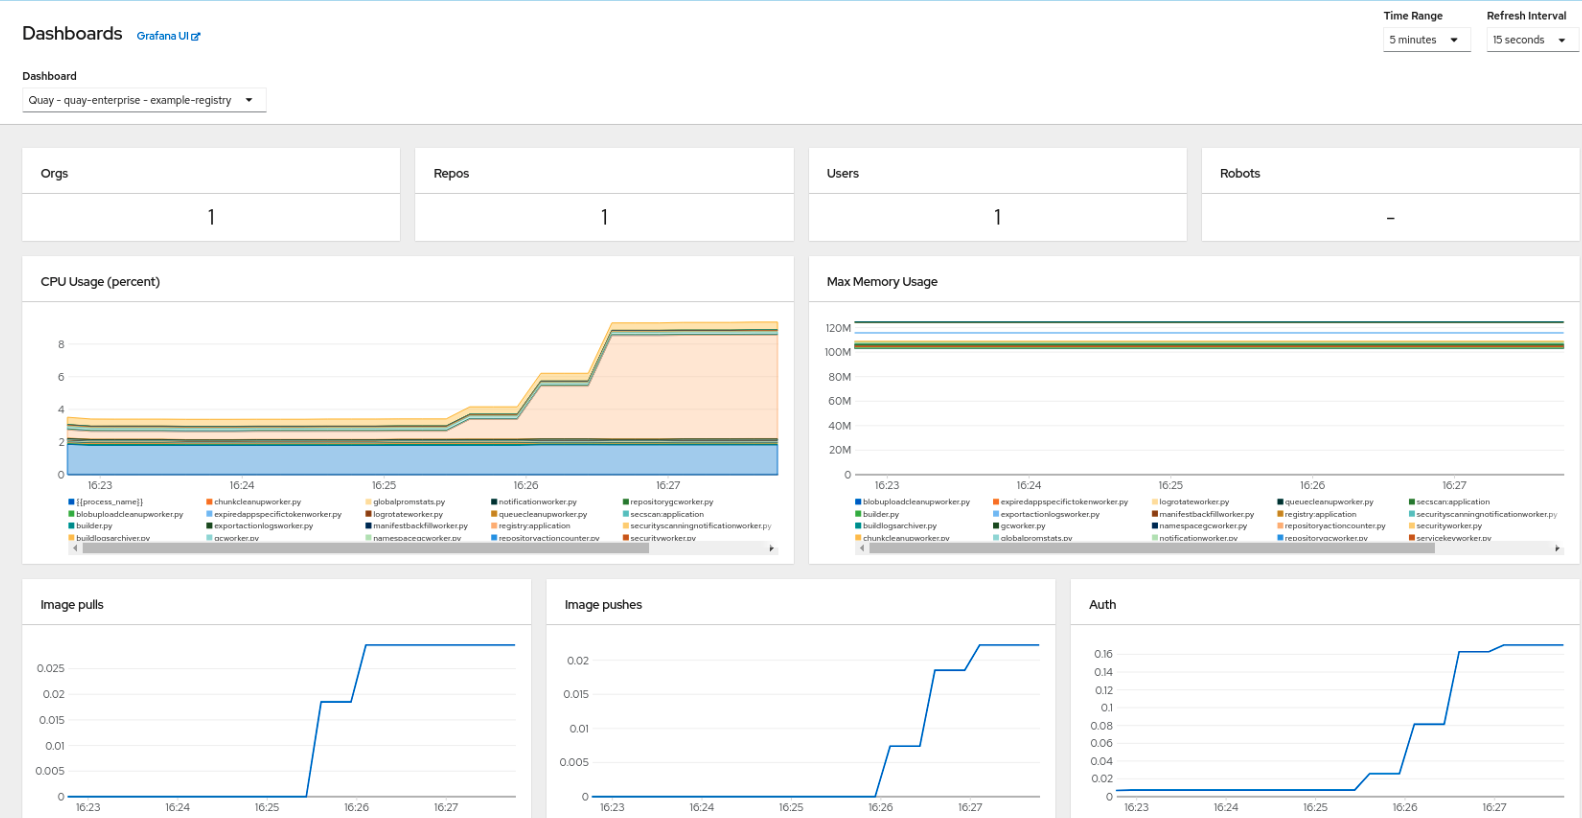
The dashboard shows various statistics including the following:
- The number of Organizations, Repositories, Users, and Robot accounts
- CPU Usage
- Max memory usage
- Rates of pulls and pushes, and authentication requests
- API request rate
- Latencies
2.2. Metrics
You can see the underlying metrics behind the Red Hat Quay dashboard by accessing Monitoring quay_ to see the list of metrics available:
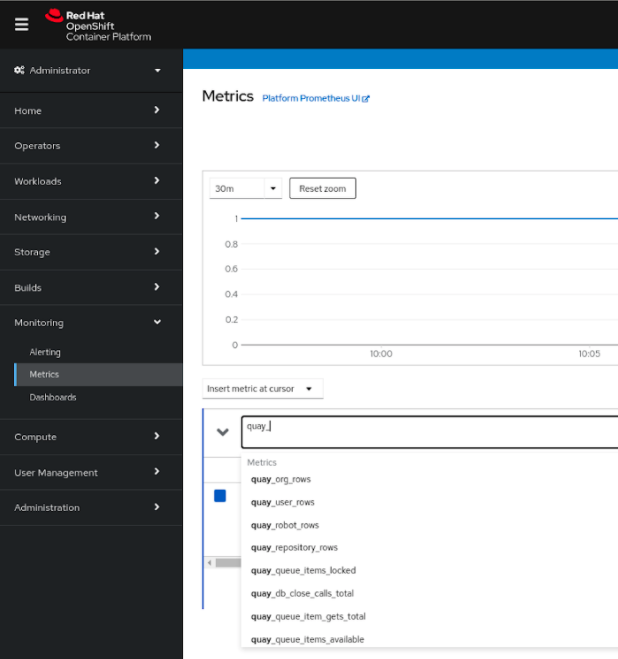
Select a sample metric, for example, quay_org_rows:
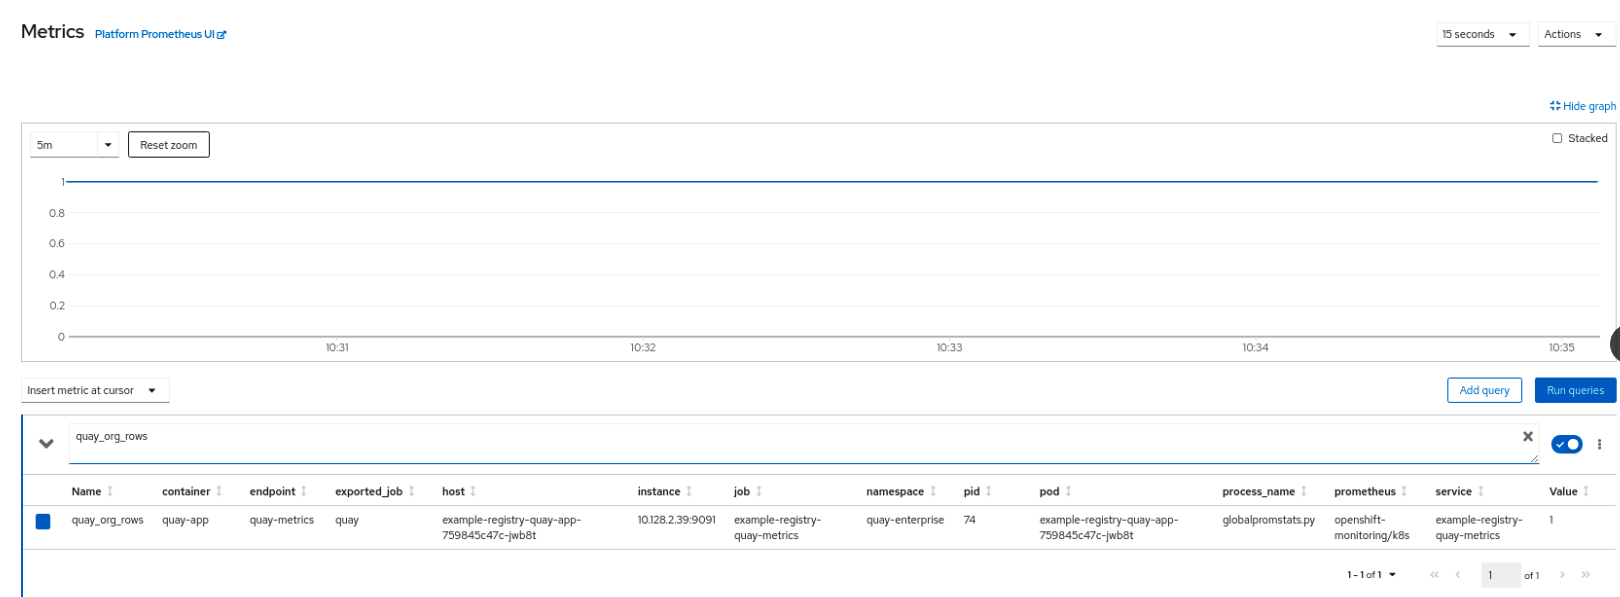
This metric shows the number of organizations in the registry. It is also directly surfaced in the dashboard.
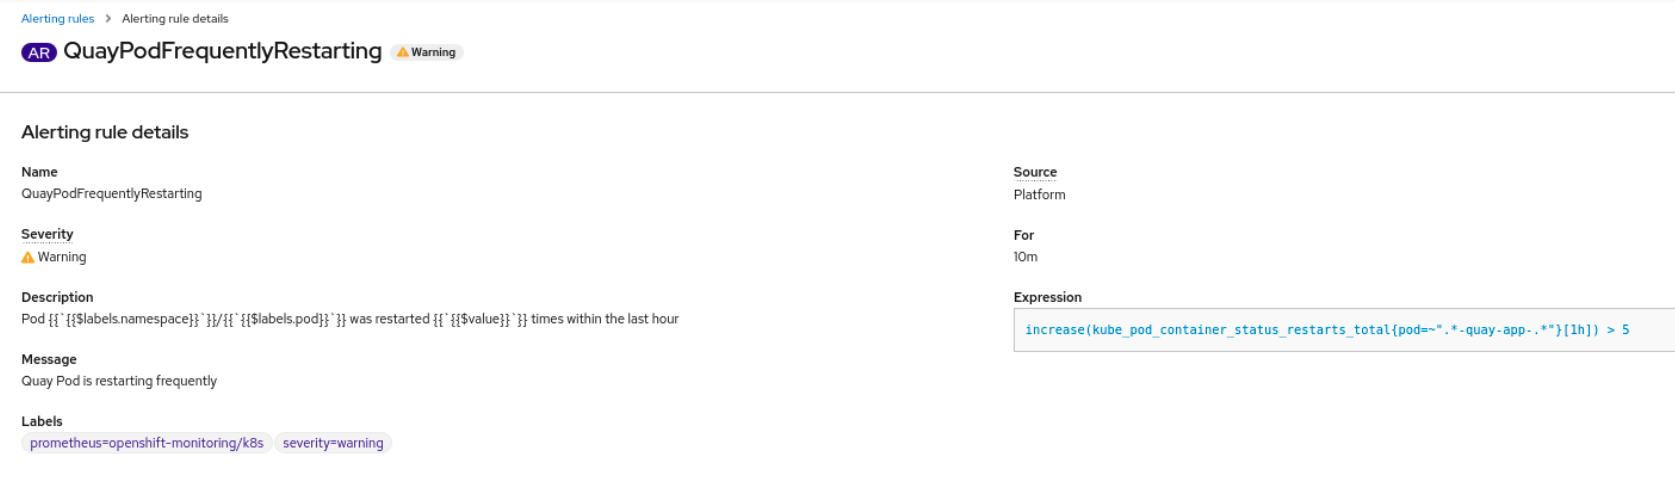
2.3. Alerting
An alert is raised if the Quay pods restart too often. The alert can be configured by accessing the Alerting rules tab from Monitoring
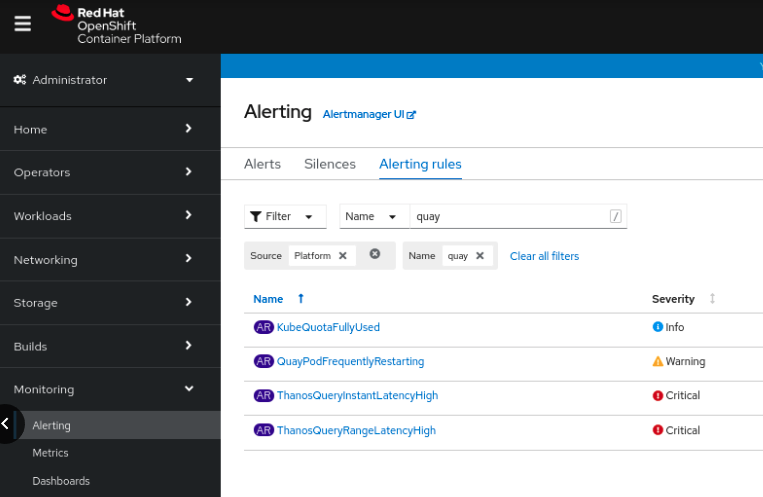
Select the QuayPodFrequentlyRestarting rule detail to configure the alert: