Questo contenuto non è disponibile nella lingua selezionata.
Chapter 10. Setting up graphical representation of PCP metrics
Using a combination of pcp, grafana, pcp redis, pcp bpftrace, and pcp vector provides graphical representation of the live data or data collected by Performance Co-Pilot (PCP).
10.1. Setting up PCP with pcp-zeroconf
This procedure describes how to set up PCP on a system with the pcp-zeroconf package. Once the pcp-zeroconf package is installed, the system records the default set of metrics into archived files.
Procedure
Install the
pcp-zeroconfpackage:yum install pcp-zeroconf
# yum install pcp-zeroconfCopy to Clipboard Copied! Toggle word wrap Toggle overflow
Verification
Ensure that the
pmloggerservice is active, and starts archiving the metrics:pcp | grep pmlogger
# pcp | grep pmlogger
 pmlogger: primary logger: /var/log/pcp/pmlogger/localhost.localdomain/20200401.00.12
Copy to Clipboard Copied! Toggle word wrap Toggle overflow
10.2. Setting up a grafana-server
Grafana generates graphs that are accessible from a browser. The grafana-server is a back-end server for the Grafana dashboard. It listens, by default, on all interfaces, and provides web services accessed through the web browser. The grafana-pcp plugin interacts with the pmproxy daemon in the backend.
This procedure describes how to set up a grafana-server.
Prerequisites
- PCP is configured. For more information, see Setting up PCP with pcp-zeroconf.
Procedure
Install the following packages:
yum install grafana grafana-pcp
# yum install grafana grafana-pcpCopy to Clipboard Copied! Toggle word wrap Toggle overflow Restart and enable the following service:
systemctl restart grafana-server
systemctl enable grafana-server
# systemctl restart grafana-server
# systemctl enable grafana-server
Copy to Clipboard Copied! Toggle word wrap Toggle overflow Open the server’s firewall for network traffic to the Grafana service.
firewall-cmd --permanent --add-service=grafana
firewall-cmd --reload
# firewall-cmd --permanent --add-service=grafana
success

# firewall-cmd --reload
success
Copy to Clipboard Copied! Toggle word wrap Toggle overflow
Verification
Ensure that the
grafana-serveris listening and responding to requests:ss -ntlp | grep 3000
# ss -ntlp | grep 3000
LISTEN  0  128  *:3000  *:*  users:(("grafana-server",pid=19522,fd=7))
Copy to Clipboard Copied! Toggle word wrap Toggle overflow Ensure that the
grafana-pcpplugin is installed:grafana-cli plugins ls | grep performancecopilot-pcp-app
# grafana-cli plugins ls | grep performancecopilot-pcp-app

performancecopilot-pcp-app @ 3.1.0
Copy to Clipboard Copied! Toggle word wrap Toggle overflow
10.3. Accessing the Grafana web UI
This procedure describes how to access the Grafana web interface.
Using the Grafana web interface, you can:
- add PCP Redis, PCP bpftrace, and PCP Vector data sources
- create dashboard
- view an overview of any useful metrics
- create alerts in PCP Redis
Prerequisites
- PCP is configured. For more information, see Setting up PCP with pcp-zeroconf.
-
The
grafana-serveris configured. For more information, see Setting up a grafana-server.
Procedure
On the client system, open a browser and access the
grafana-serveron port3000, using http://192.0.2.0:3000 link.Replace 192.0.2.0 with your machine IP when accessing Grafana web UI from a remote machine, or with
localhostwhen accessing the web UI locally.For the first login, enter admin in both the Email or username and Password field.
Grafana prompts to set a New password to create a secured account. If you want to set it later, click Skip.
-
From the menu, hover over the
 Configuration icon and then click Plugins.
- In the Plugins tab, type performance co-pilot in the Search by name or type text box and then click Performance Co-Pilot (PCP) plugin.
- In the Plugins / Performance Co-Pilot pane, click .
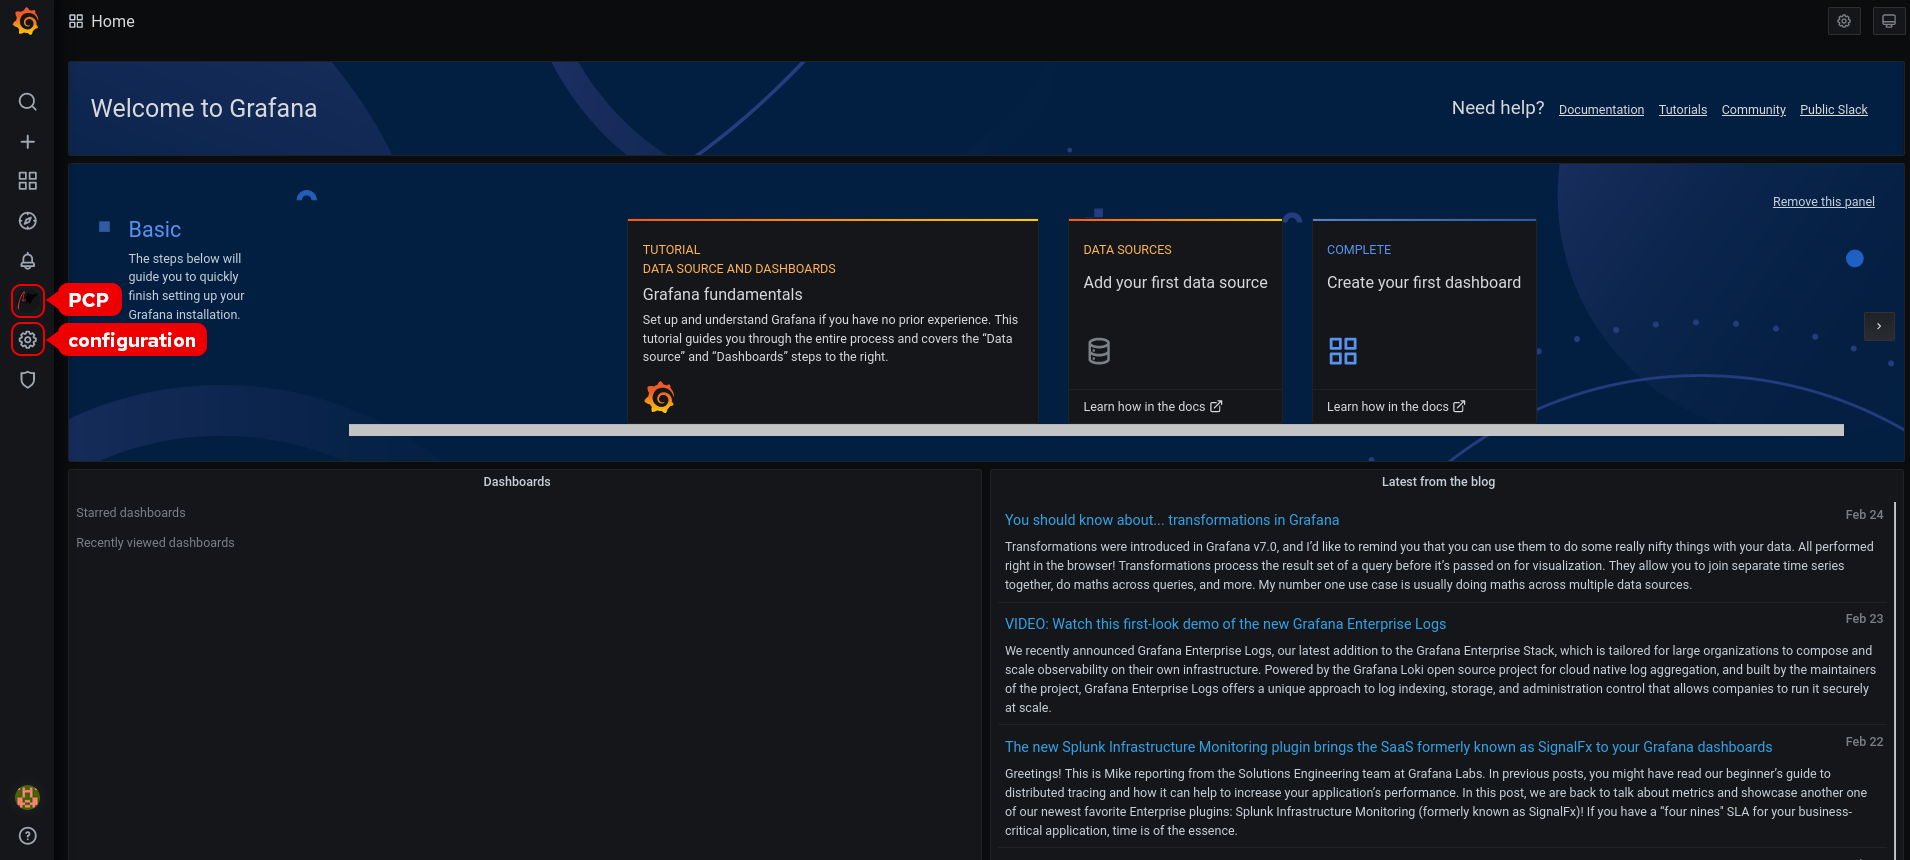
Click Grafana
 icon. The Grafana Home page is displayed.
Figure 10.1. Home Dashboard
NoteThe top corner of the screen has a similar
 icon, but it controls the general Dashboard settings.
In the Grafana Home page, click Add your first data source to add PCP Redis, PCP bpftrace, and PCP Vector data sources. For more information about adding data source, see:
- To add pcp redis data source, view default dashboard, create a panel, and an alert rule, see Creating panels and alert in PCP Redis data source.
- To add pcp bpftrace data source and view the default dashboard, see Viewing the PCP bpftrace System Analysis dashboard.
- To add pcp vector data source, view the default dashboard, and to view the vector checklist, see Viewing the PCP Vector Checklist.
-
Optional: From the menu, hover over the admin profile
 icon to change the Preferences including Edit Profile, Change Password, or to Sign out.
10.4. Configuring PCP Redis
Use the PCP Redis data source to:
- View data archives
- Query time series using pmseries language
- Analyze data across multiple hosts
Prerequisites
- PCP is configured. For more information, see Setting up PCP with pcp-zeroconf.
-
The
grafana-serveris configured. For more information, see Setting up a grafana-server. -
Mail transfer agent, for example,
sendmailorpostfixis installed and configured.
Procedure
Install the
redispackage:yum module install redis:6
# yum module install redis:6Copy to Clipboard Copied! Toggle word wrap Toggle overflow NoteFrom Red Hat Enterprise Linux 8.4, Redis 6 is supported but the
yum updatecommand does not update Redis 5 to Redis 6. To update from Redis 5 to Redis 6, run:# yum module switch-to redis:6
Start and enable the following services:
systemctl start pmproxy redis
systemctl enable pmproxy redis
# systemctl start pmproxy redis
# systemctl enable pmproxy redis
Copy to Clipboard Copied! Toggle word wrap Toggle overflow Restart the
grafana-server:systemctl restart grafana-server
# systemctl restart grafana-serverCopy to Clipboard Copied! Toggle word wrap Toggle overflow
Verification
Ensure that the
pmproxyandredisare working:pmseries disk.dev.read
# pmseries disk.dev.read
2eb3e58d8f1e231361fb15cf1aa26fe534b4d9df
Copy to Clipboard Copied! Toggle word wrap Toggle overflow This command does not return any data if the
redispackage is not installed.
10.5. Creating panels and alerts in PCP Redis data source
After adding the PCP Redis data source, you can view the dashboard with an overview of useful metrics, add a query to visualize the load graph, and create alerts that help you to view the system issues after they occur.
Prerequisites
- The PCP Redis is configured. For more information, see Configuring PCP Redis.
-
The
grafana-serveris accessible. For more information, see Accessing the Grafana web UI.
Procedure
- Log into the Grafana web UI.
- In the Grafana Home page, click Add your first data source.
- In the Add data source pane, type redis in the Filter by name or type text box and then click PCP Redis.
In the Data Sources / PCP Redis pane, perform the following:
-
Add
http://localhost:44322in the URL field and then click . Click
to see a dashboard with an overview of any useful metrics. Figure 10.2. PCP Redis: Host Overview
-
Add
Add a new panel:
-
From the menu, hover over the

to add a panel. -
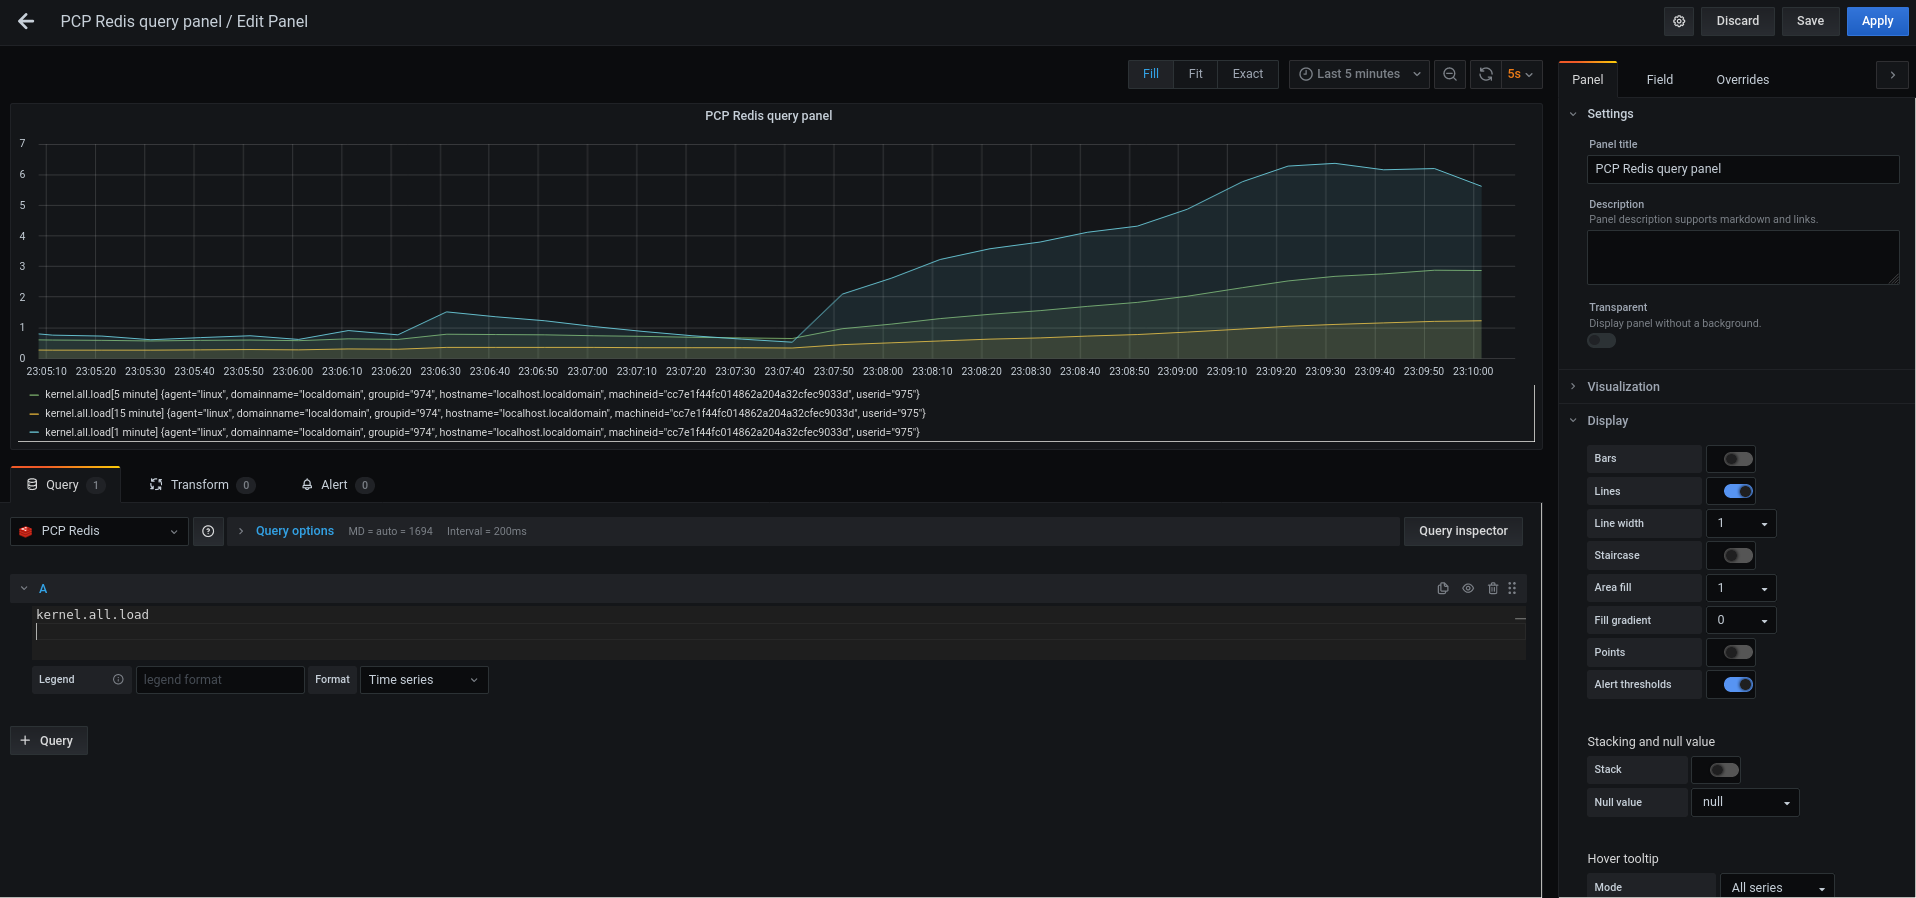
In the Query tab, select the PCP Redis from the query list instead of the selected default option and in the text field of A, enter metric, for example,
kernel.all.loadto visualize the kernel load graph. - Optional: Add Panel title and Description, and update other options from the Settings.
- Click to apply changes and save the dashboard. Add Dashboard name.
Click to apply changes and go back to the dashboard.
Figure 10.3. PCP Redis query panel
-
From the menu, hover over the
Create an alert rule:
-
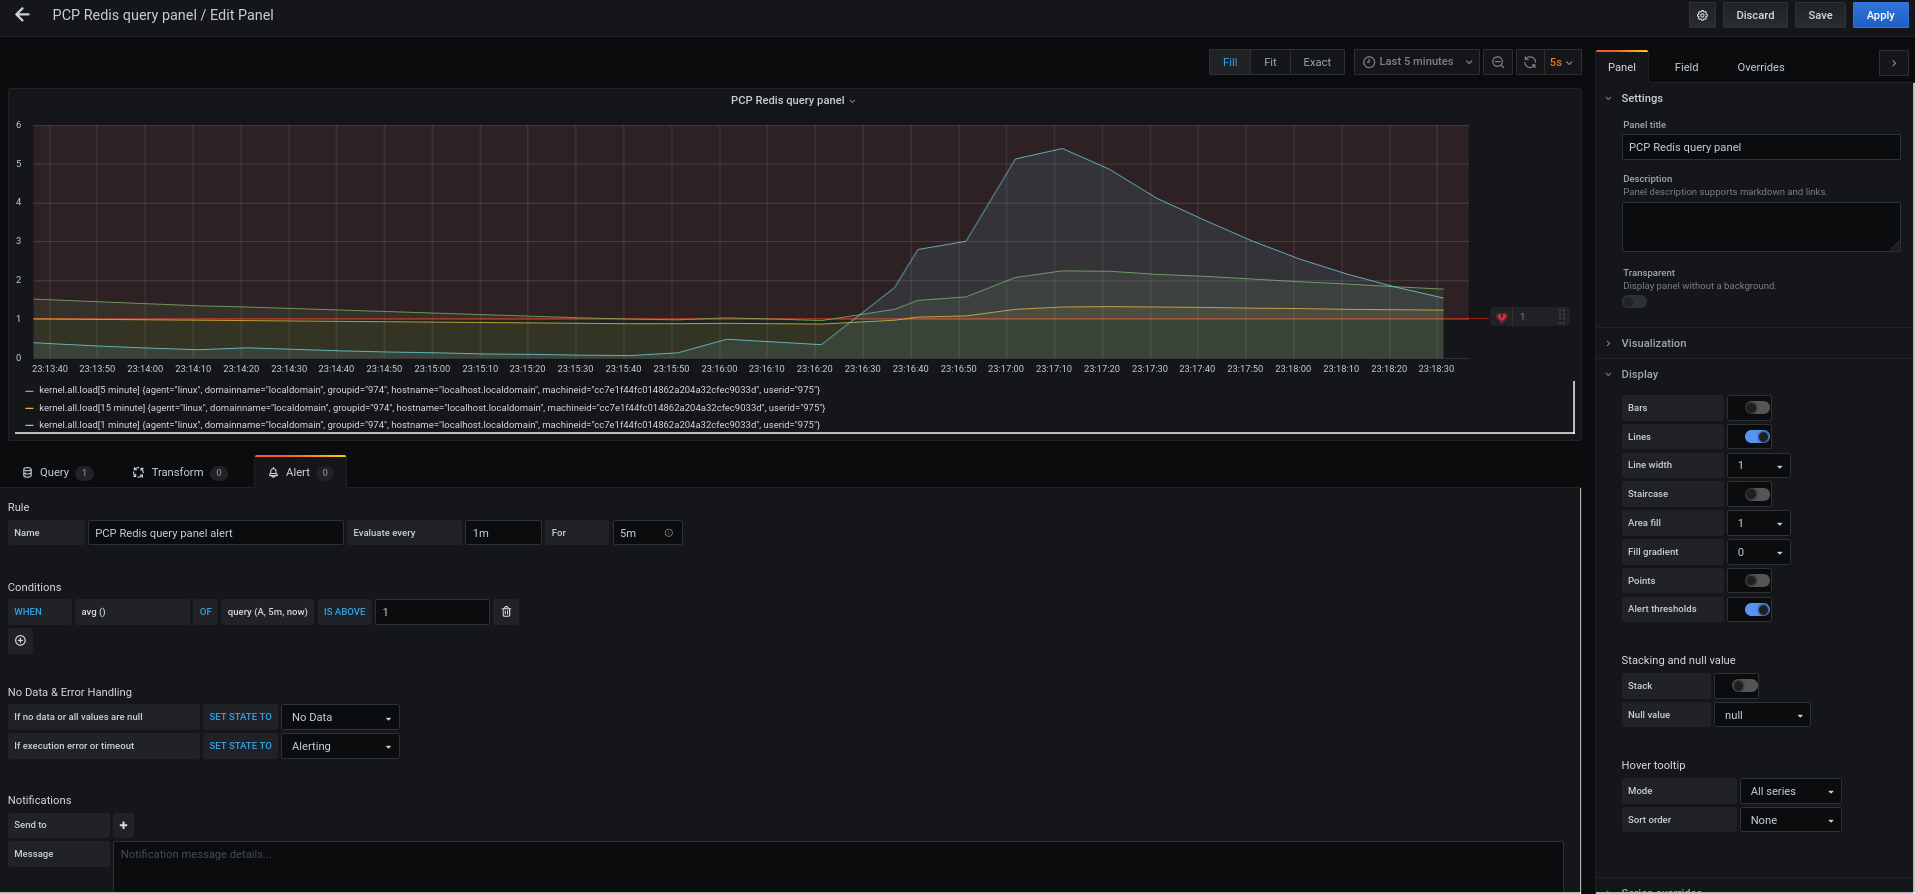
In the PCP Redis query panel, click
 Alert and then click Create Alert.
- Edit the Name, Evaluate query, and For fields from the Rule, and specify the Conditions for your alert.
Click to apply changes and save the dashboard. Click to apply changes and go back to the dashboard.
Figure 10.4. Creating alerts in the PCP Redis panel
- Optional: In the same panel, scroll down and click icon to delete the created rule.
Optional: From the menu, click
 Alerting icon to view the created alert rules with different alert statuses, to edit the alert rule, or to pause the existing rule from the Alert Rules tab.
To add a notification channel for the created alert rule to receive an alert notification from Grafana, see Adding notification channels for alerts.
-
In the PCP Redis query panel, click

10.6. Adding notification channels for alerts
By adding notification channels, you can receive an alert notification from Grafana whenever the alert rule conditions are met and the system needs further monitoring.
You can receive these alerts after selecting any one type from the supported list of notifiers, which includes DingDing, Discord, Email, Google Hangouts Chat, HipChat, Kafka REST Proxy, LINE, Microsoft Teams, OpsGenie, PagerDuty, Prometheus Alertmanager, Pushover, Sensu, Slack, Telegram, Threema Gateway, VictorOps, and webhook.
Prerequisites
-
The
grafana-serveris accessible. For more information, see Accessing the Grafana web UI. - An alert rule is created. For more information, see Creating panels and alert in PCP Redis data source.
Configure SMTP and add a valid sender’s email address in the
grafana/grafana.inifile:vi /etc/grafana/grafana.ini
# vi /etc/grafana/grafana.ini

[smtp]
enabled = true
from_address = abc@gmail.com
Copy to Clipboard Copied! Toggle word wrap Toggle overflow Replace abc@gmail.com by a valid email address.
Restart
grafana-serversystemctl restart grafana-server.service
# systemctl restart grafana-server.serviceCopy to Clipboard Copied! Toggle word wrap Toggle overflow
Procedure
-
From the menu, hover over the
. In the Add notification channel details pane, perform the following:
- Enter your name in the Name text box
-
Select the communication Type, for example, Email and enter the email address. You can add multiple email addresses using the
;separator. - Optional: Configure Optional Email settings and Notification settings.
- Click .
Select a notification channel in the alert rule:
-
From the menu, hover over the
Alerting icon and then click Alert rules.
- From the Alert Rules tab, click the created alert rule.
- On the Notifications tab, select your notification channel name from the Send to option, and then add an alert message.
- Click .
-
From the menu, hover over the
10.7. Setting up authentication between PCP components
You can setup authentication using the scram-sha-256 authentication mechanism, which is supported by PCP through the Simple Authentication Security Layer (SASL) framework.
From Red Hat Enterprise Linux 8.3, PCP supports the scram-sha-256 authentication mechanism.
Procedure
Install the
saslframework for thescram-sha-256authentication mechanism:yum install cyrus-sasl-scram cyrus-sasl-lib
# yum install cyrus-sasl-scram cyrus-sasl-libCopy to Clipboard Copied! Toggle word wrap Toggle overflow Specify the supported authentication mechanism and the user database path in the
pmcd.conffile:vi /etc/sasl2/pmcd.conf
# vi /etc/sasl2/pmcd.conf

mech_list: scram-sha-256

sasldb_path: /etc/pcp/passwd.db
Copy to Clipboard Copied! Toggle word wrap Toggle overflow Create a new user:
useradd -r metrics
# useradd -r metricsCopy to Clipboard Copied! Toggle word wrap Toggle overflow Replace metrics by your user name.
Add the created user in the user database:
saslpasswd2 -a pmcd metrics
# saslpasswd2 -a pmcd metrics

Password:
Again (for verification):
Copy to Clipboard Copied! Toggle word wrap Toggle overflow To add the created user, you are required to enter the metrics account password.
Set the permissions of the user database:
chown root:pcp /etc/pcp/passwd.db
chmod 640 /etc/pcp/passwd.db
# chown root:pcp /etc/pcp/passwd.db
# chmod 640 /etc/pcp/passwd.db
Copy to Clipboard Copied! Toggle word wrap Toggle overflow Restart the
pmcdservice:systemctl restart pmcd
# systemctl restart pmcdCopy to Clipboard Copied! Toggle word wrap Toggle overflow
Verification
Verify the
saslconfiguration:pminfo -f -h "pcp://127.0.0.1?username=metrics" disk.dev.read
# pminfo -f -h "pcp://127.0.0.1?username=metrics" disk.dev.read
Password:
disk.dev.read
inst [0 or "sda"] value 19540
Copy to Clipboard Copied! Toggle word wrap Toggle overflow
10.8. Installing PCP bpftrace
The pcp-bpftrace package in Red Hat Enterprise Linux is the combination of Performance Co-Pilot (PCP) and bpftrace to create custom tracing tools that use the extended Berkeley Packet Filter (eBPF) technology within the kernel. With pcp-bpftrace, you can optimize the system behaviour from the performance data gathered by bpftrace scripts.
The bpftrace scripts use the enhanced Berkeley Packet Filter (eBPF).
Prerequisites
- PCP is configured. For more information, see Setting up PCP with pcp-zeroconf.
-
The
grafana-serveris configured. For more information, see Setting up a grafana-server. -
The
scram-sha-256authentication mechanism is configured. For more information, see Setting up authentication between PCP components.
Procedure
Install the
pcp-pmda-bpftracepackage:yum install pcp-pmda-bpftrace
# yum install pcp-pmda-bpftraceCopy to Clipboard Copied! Toggle word wrap Toggle overflow Edit the
bpftrace.conffile and add the user that you have created in Setting up authentication between PCP components:Copy to Clipboard Copied! Toggle word wrap Toggle overflow Replace metrics by your user name.
Install
bpftracePMDA:Copy to Clipboard Copied! Toggle word wrap Toggle overflow The
pmda-bpftraceis now installed, and can only be used after authenticating your user. For more information, see Viewing the PCP bpftrace System Analysis dashboard.
10.9. Viewing the PCP bpftrace System Analysis dashboard
Using the PCP bpftrace data source, you can access the live data from sources which are not available as normal data from the pmlogger or archives
In the PCP bpftrace data source, you can view the dashboard with an overview of useful metrics.
Prerequisites
- The PCP bpftrace is installed. For more information, see Installing PCP bpftrace.
-
The
grafana-serveris accessible. For more information, see Accessing the Grafana web UI.
Procedure
- Log into the Grafana web UI.
- In the Grafana Home page, click Add your first data source.
- In the Add data source pane, type bpftrace in the Filter by name or type text box and then click PCP bpftrace.
In the Data Sources / PCP bpftrace pane, perform the following:
-
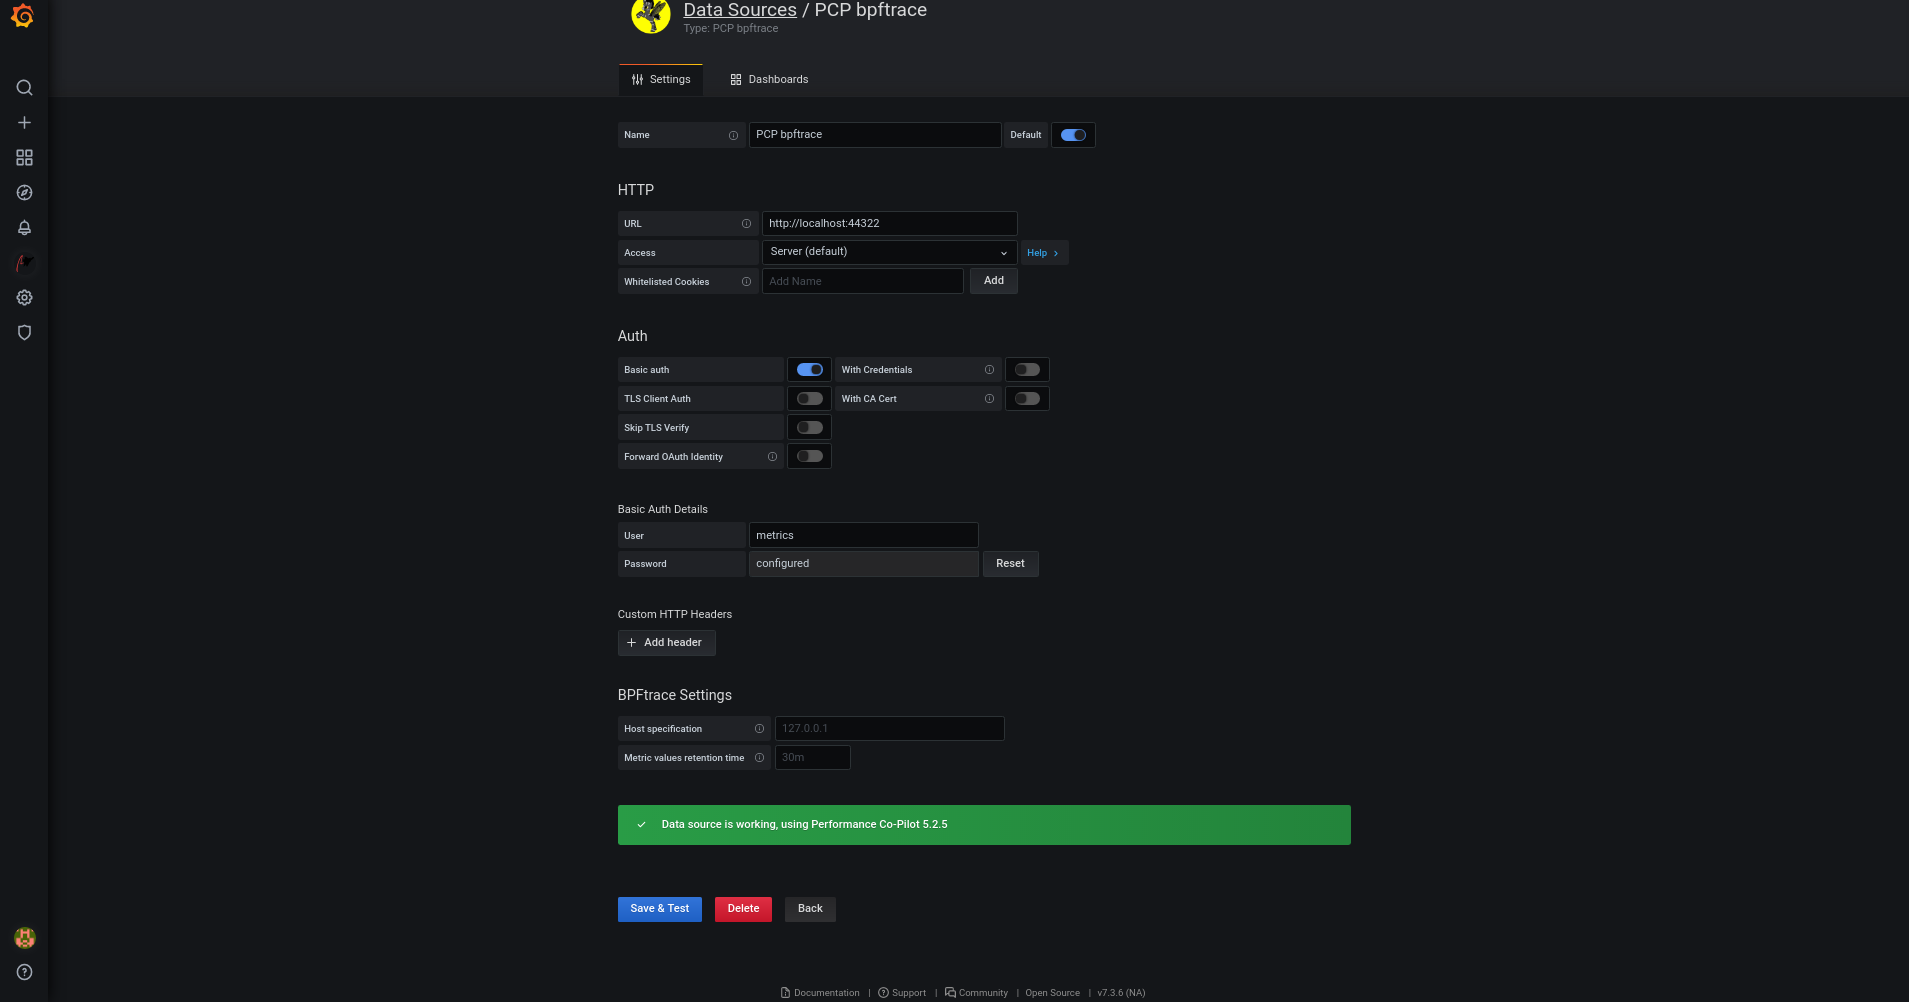
Add
http://localhost:44322in the URL field. - Toggle the Basic Auth option and add the created user credentials in the User and Password field.
Click .
Figure 10.5. Adding PCP bpftrace in the data source
Click
to see a dashboard with an overview of any useful metrics. Figure 10.6. PCP bpftrace: System Analysis
-
Add

10.10. Installing PCP Vector
Install a pcp vector data source to show live, on-host metrics from the real-time pmwebapi interfaces. This data source is intended for on-demand performance monitoring of an individual host and includes container support.
Prerequisites
- PCP is configured. For more information, see Setting up PCP with pcp-zeroconf.
-
The
grafana-serveris configured. For more information, see Setting up a grafana-server.
Procedure
Install the
pcp-pmda-bccpackage:yum install pcp-pmda-bcc
# yum install pcp-pmda-bccCopy to Clipboard Copied! Toggle word wrap Toggle overflow Install the
bccPMDA:Copy to Clipboard Copied! Toggle word wrap Toggle overflow
10.11. Viewing the PCP Vector Checklist
The PCP Vector data source displays live metrics and uses the pcp metrics. It analyzes data for individual hosts.
After adding the PCP Vector data source, you can view the dashboard with an overview of useful metrics and view the related troubleshooting or reference links in the checklist.
Prerequisites
- The PCP Vector is installed. For more information, see Installing PCP Vector.
-
The
grafana-serveris accessible. For more information, see Accessing the Grafana web UI.
Procedure
- Log into the Grafana web UI.
- In the Grafana Home page, click Add your first data source.
- In the Add data source pane, type vector in the Filter by name or type text box and then click PCP Vector.
In the Data Sources / PCP Vector pane, perform the following:
-
Add
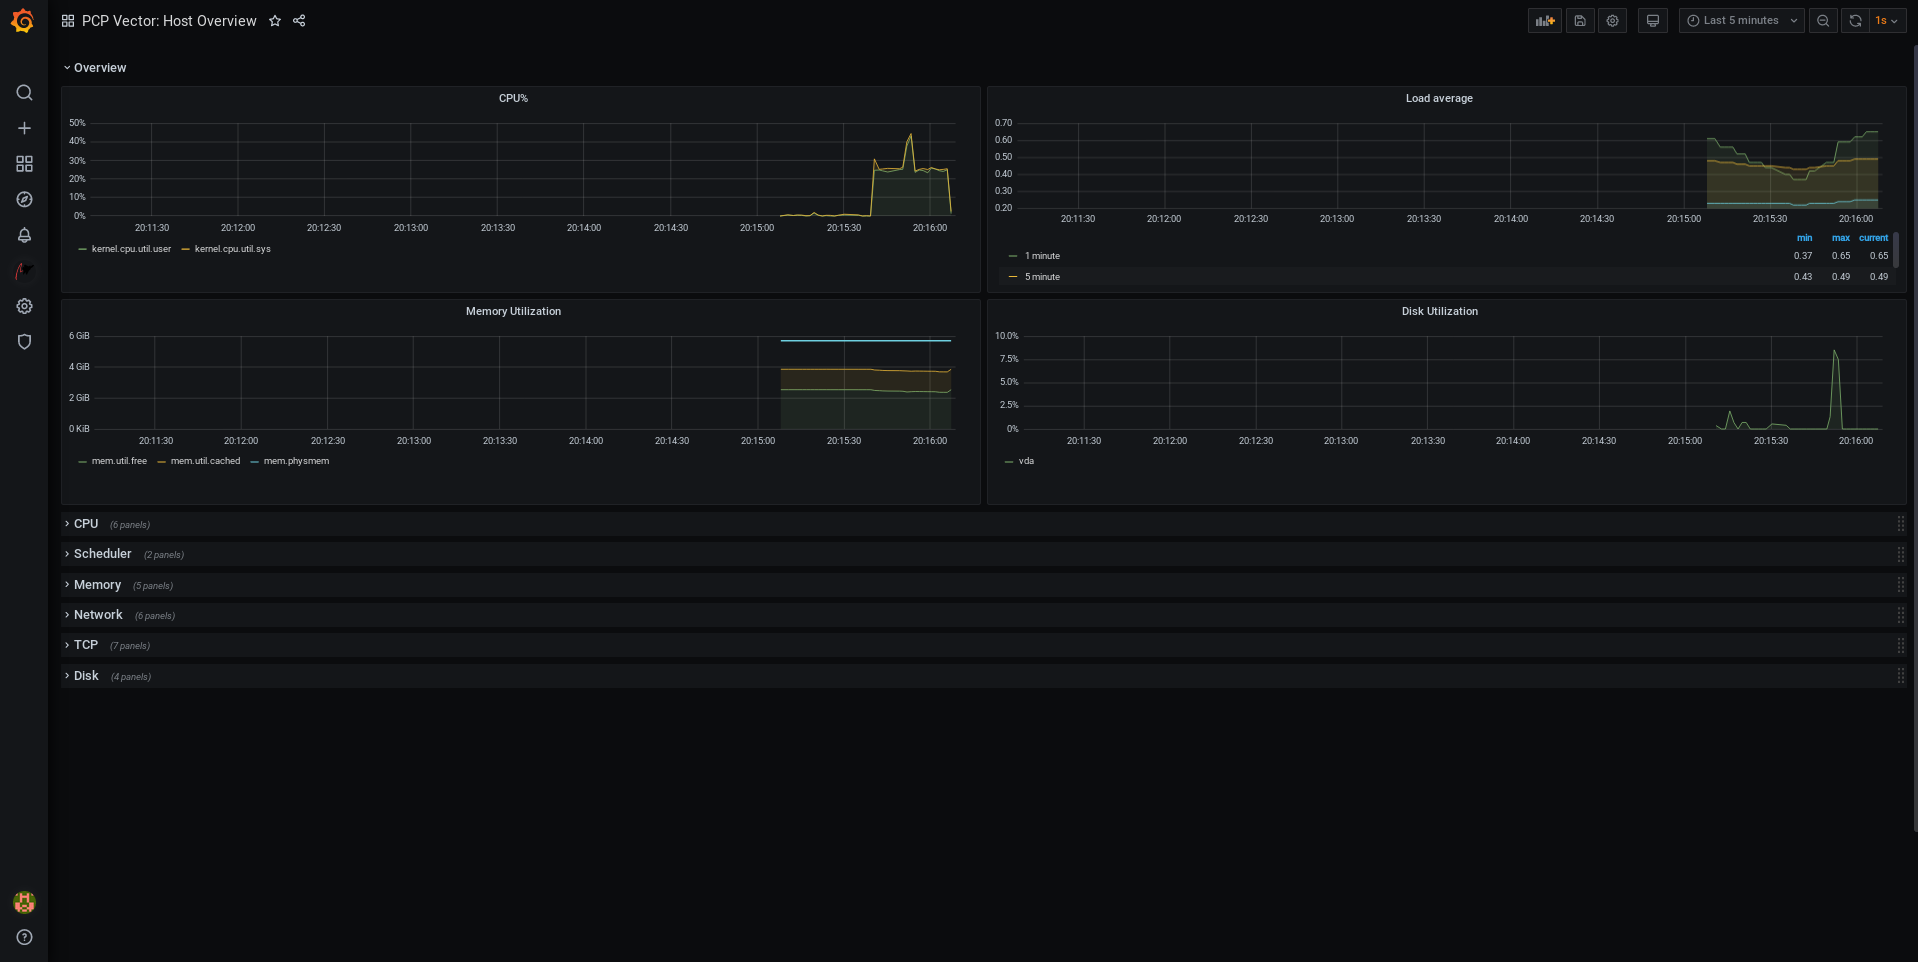
http://localhost:44322in the URL field and then click . Click
to see a dashboard with an overview of any useful metrics. Figure 10.7. PCP Vector: Host Overview
-
Add
From the menu, hover over the
 Performance Co-Pilot plugin and then click PCP Vector Checklist.
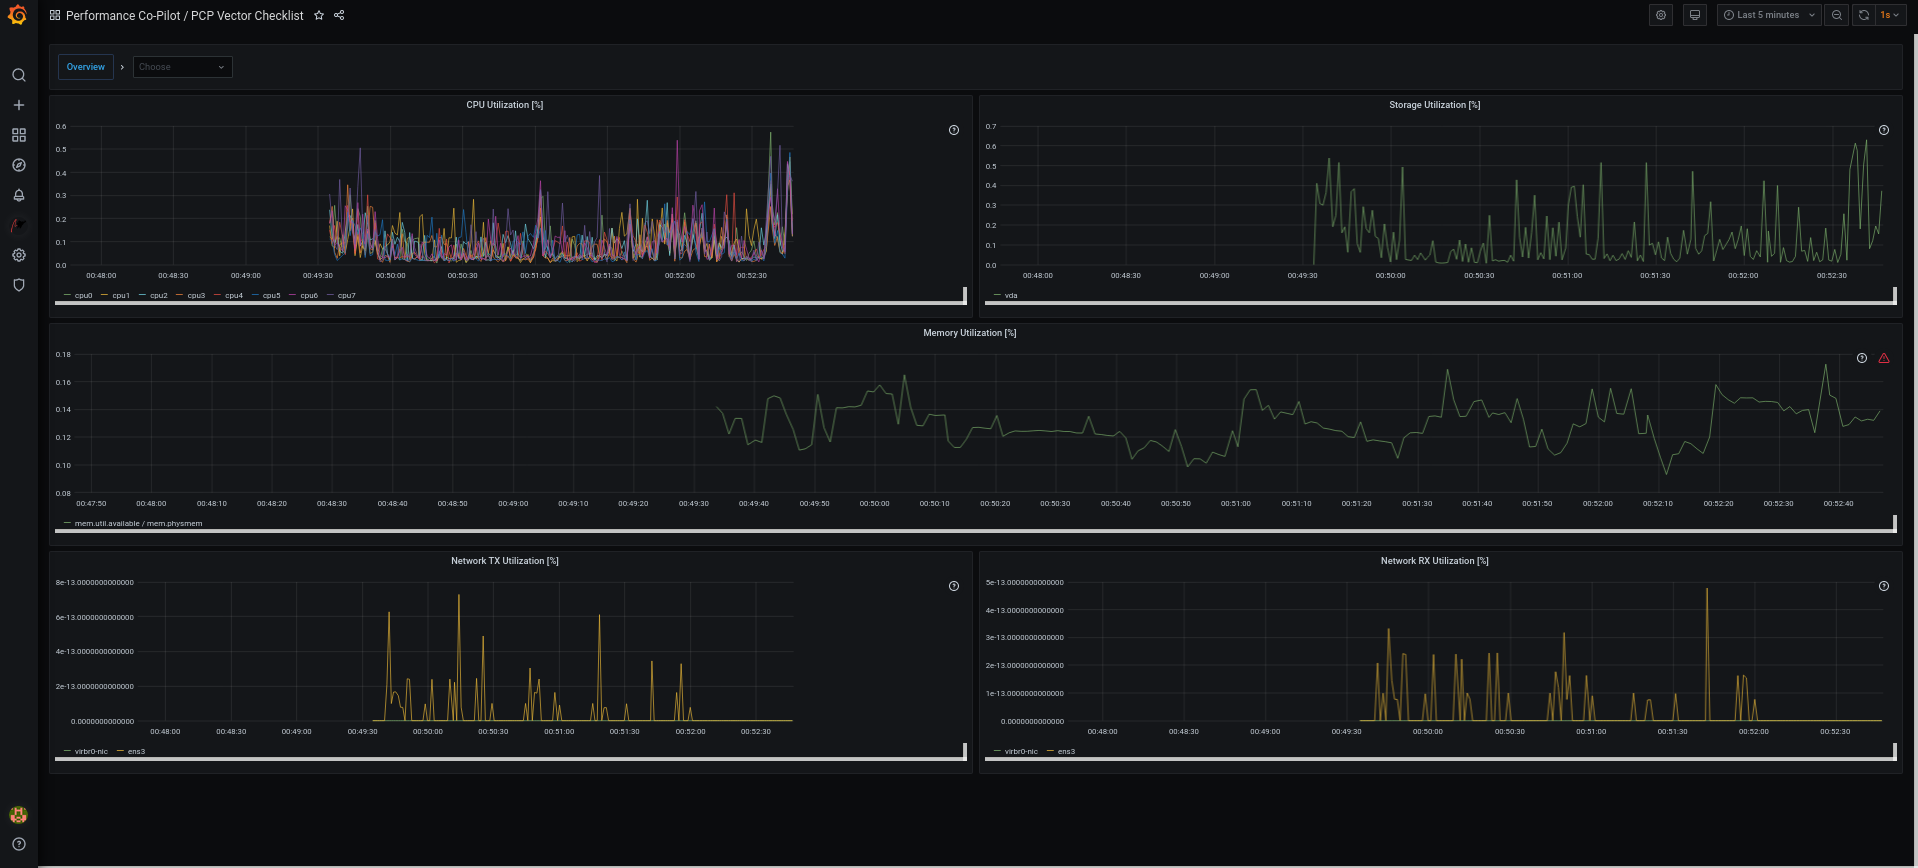
In the PCP checklist, click
 help or
 warning icon to view the related troubleshooting or reference links.
Figure 10.8. Performance Co-Pilot / PCP Vector Checklist
10.12. Using heatmaps in Grafana
You can use heatmaps in Grafana to view histograms of your data over time, identify trends and patterns in your data, and see how they change over time. Each column within a heatmap represents a single histogram with different colored cells representing the different densities of observation of a given value within that histogram.
This specific workflow is for the heatmaps in Grafana version 9.2.10 and later on RHEL8.
Prerequisites
- PCP Redis is configured. For more information see Configuring PCP Redis.
-
The
grafana-serveris accessible. For more information see Accessing the Grafana Web UI. - The PCP Redis data source is configured. For more information see Creating panels and alerts in PCP Redis data source.
Procedure
- Hover the cursor over the Dashboards tab and click + New dashboard.
- In the Add panel menu, click Add a new panel.
In the Query tab:
- Select PCP Redis from the query list instead of the selected default option.
-
In the text field of A, enter a metric, for example,
kernel.all.loadto visualize the kernel load graph.
- Click the visualization dropdown menu, which is set to Time series by default, and then click Heatmap.
- Optional: In the Panel Options dropdown menu, add a Panel Title and Description.
In the Heatmap dropdown menu, under the Calculate from data setting, click Yes.
Heatmap

- Optional: In the Colors dropdown menu, change the Scheme from the default Orange and select the number of steps (color shades).
Optional: In the Tooltip dropdown menu, under the Show histogram (Y Axis) setting, click the toggle to display a cell’s position within its specific histogram when hovering your cursor over a cell in the heatmap. For example:
Show histogram (Y Axis) cell display

10.13. Managing SELinux booleans for Grafana
The grafana-selinux subpackage includes several SELinux booleans that control Grafana’s access to external services. These booleans are off by default. You can turn them on or off based on your system requirements.
Prerequisites
-
You have installed
grafana-selinuxsubpackage. - You have root privileges.
Procedure
View all Grafana-related SELinux booleans:
semanage boolean -l | grep grafana
# semanage boolean -l | grep grafanaCopy to Clipboard Copied! Toggle word wrap Toggle overflow Enable a SELinux boolean:
setsebool [-P] <boolean_name> on
# setsebool [-P] <boolean_name> onCopy to Clipboard Copied! Toggle word wrap Toggle overflow - Replace <boolean_name> with the name of the SELinux boolean you want to enable.
- Use the -P option to make the change persistent across system reboots.
Optional: Turn off any SELinux option:
setsebool [-P] <boolean_name> off
# setsebool [-P] <boolean_name> offCopy to Clipboard Copied! Toggle word wrap Toggle overflow
10.14. Troubleshooting Grafana issues
It is sometimes neccesary to troubleshoot Grafana issues, such as, Grafana does not display any data, the dashboard is black, or similar issues.
Procedure
Verify that the
pmloggerservice is up and running by executing the following command:systemctl status pmlogger
$ systemctl status pmloggerCopy to Clipboard Copied! Toggle word wrap Toggle overflow Verify if files were created or modified to the disk by executing the following command:
Copy to Clipboard Copied! Toggle word wrap Toggle overflow Verify that the
pmproxyservice is running by executing the following command:systemctl status pmproxy
$ systemctl status pmproxyCopy to Clipboard Copied! Toggle word wrap Toggle overflow Verify that
pmproxyis running, time series support is enabled, and a connection to Redis is established by viewing the/var/log/pcp/pmproxy/pmproxy.logfile and ensure that it contains the following text:pmproxy(1716) Info: Redis slots, command keys, schema version setup
pmproxy(1716) Info: Redis slots, command keys, schema version setupCopy to Clipboard Copied! Toggle word wrap Toggle overflow Here, 1716 is the PID of pmproxy, which will be different for every invocation of
pmproxy.Verify if the Redis database contains any keys by executing the following command:
redis-cli dbsize
$ redis-cli dbsize
(integer) 34837
Copy to Clipboard Copied! Toggle word wrap Toggle overflow Verify if any PCP metrics are in the Redis database and
pmproxyis able to access them by executing the following commands:Copy to Clipboard Copied! Toggle word wrap Toggle overflow Copy to Clipboard Copied! Toggle word wrap Toggle overflow Verify if there are any errors in the Grafana logs by executing the following command:
Copy to Clipboard Copied! Toggle word wrap Toggle overflow