Questo contenuto non è disponibile nella lingua selezionata.
Chapter 1. Observability service introduction
Observability can help you identify and assess performance problems without additional tests and support. The Red Hat Advanced Cluster Management for Kubernetes observability component is a service you can use to understand the health and utilization of clusters, and workloads across your fleet. By using the observability service, you are able to automate and manage the components that are within observability.
Observability service uses existing and widely-adopted observability tools from the open source community. By default, multicluster observability operator is enabled during the installation of Red Hat Advanced Cluster Management. Thanos is deployed within the hub cluster for long-term metrics storage. The observability-endpoint-operator is automatically deployed to each imported or created managed cluster. This controller starts a metrics collector that collects the data from Red Hat OpenShift Container Platform Prometheus, then sends the data to the Red Hat Advanced Cluster Management hub cluster.
Read the following documentation for more details about the observability component:
1.1. Observability architecture
The multiclusterhub-operator enables the multicluster-observability-operator pod by default. You must configure the multicluster-observability-operator pod.
1.1.1. Observability open source components
Observability service uses open source observability tools from community. View the following descriptions of the tools that are apart of the product observability service:
- Thanos: A toolkit of components that you can use to perform global querying across multiple Prometheus instances. For long-term storage of Prometheus data, persist it in any S3 compatible storage. You can also compose a highly-available and scalable metrics system.
- Prometheus: A monitoring and alerting tool that you can use to collect metrics from your application and store these metrics as time-series data. Store all scraped samples locally, run rules to aggregate and record new time series from existing data, and generate alerts.
- Alertmanager: A tool to manage and receive alerts from Prometheus. Deduplicate, group, and route alerts to your integrations such as email, Slack, and PagerDuty. Configure Alertmanager to silence and inhibit specific alerts.
1.1.2. Observability architecture diagram
The following diagram shows the components of observability:
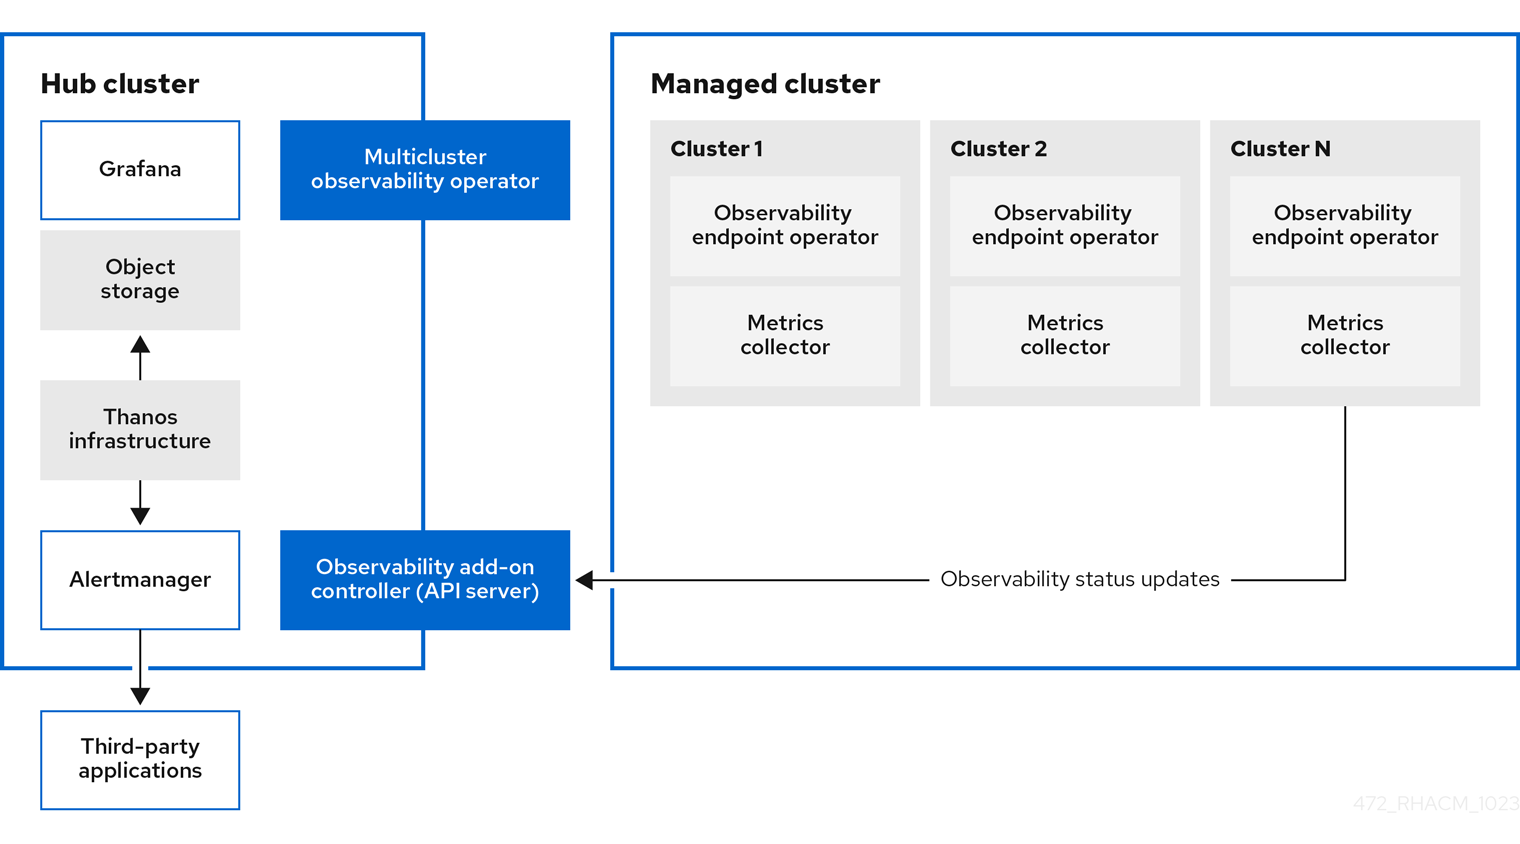
The components of the observability architecture include the following items:
-
The multicluster hub operator, also known as the
multiclusterhub-operatorpod, deploys themulticluster-observability-operatorpod. It sends hub cluster data to your managed clusters. - The observability add-on controller is the API server that automatically updates the log of the managed cluster.
The Thanos infrastructure includes the Thanos Compactor, which is deployed by the
multicluster-observability-operatorpod. The Thanos Compactor ensures that queries are performing well by using the retention configuration, and compaction of the data in storage.To help identify when the Thanos Compactor is experiencing issues, use the four default alerts that are monitoring its health. Read the following table of default alerts:
Expand Table 1.1. Table of default Thanos alerts Alert Severity Description ACMThanosCompactHaltedcritical
An alert is sent when the compactor stops.
ACMThanosCompactHighCompactionFailureswarning
An alert is sent when the compaction failure rate is greater than 5 percent.
ACMThanosCompactBucketHighOperationFailureswarning
An alert is sent when the bucket operation failure rate is greater than 5%.
ACMThanosCompactHasNotRunwarning
An alert is sent when the compactor has not uploaded anything in last 24 hours.
- The observability component deploys an instance of Grafana to enable data visualization with dashboards (static) or data exploration. Red Hat Advanced Cluster Management supports version 8.5.20 of Grafana. You can also design your Grafana dashboard. For more information, see Designing your Grafana dashboard.
- The Prometheus Alertmanager enables alerts to be forwarded with third-party applications. You can customize the observability service by creating custom recording rules or alerting rules. Red Hat Advanced Cluster Management supports version 0.25 of Prometheus Alertmanager.
1.1.3. Persistent stores used in the observability service
Important: Do not use the local storage operator or a storage class that uses local volumes for persistent storage. You can lose data if the pod relaunched on a different node after a restart. When this happens, the pod can no longer access the local storage on the node. Be sure that you can access the persistent volumes of the receive and rules pods to avoid data loss.
When you install Red Hat Advanced Cluster Management the following persistent volumes (PV) must be created so that Persistent Volume Claims (PVC) can attach to it automatically. As a reminder, you must define a storage class in the MultiClusterObservability custom resource when there is no default storage class specified or you want to use a non-default storage class to host the PVs. It is recommended to use Block Storage, similar to what Prometheus uses. Also each replica of alertmanager, thanos-compactor, thanos-ruler, thanos-receive-default and thanos-store-shard must have its own PV. View the following table:
| Persistent volume name | Purpose |
| alertmanager |
Alertmanager stores the |
| thanos-compact | The compactor needs local disk space to store intermediate data for its processing, as well as bucket state cache. The required space depends on the size of the underlying blocks. The compactor must have enough space to download all of the source blocks, then build the compacted blocks on the disk. On-disk data is safe to delete between restarts and should be the first attempt to get crash-looping compactors unstuck. However, it is recommended to give the compactor persistent disks in order to effectively use bucket state cache in between restarts. |
| thanos-rule |
The thanos ruler evaluates Prometheus recording and alerting rules against a chosen query API by issuing queries at a fixed interval. Rule results are written back to the disk in the Prometheus 2.0 storage format. The amount of hours or days of data retained in this stateful set was fixed in the API version |
| thanos-receive-default |
Thanos receiver accepts incoming data (Prometheus remote-write requests) and writes these into a local instance of the Prometheus TSDB. Periodically (every 2 hours), TSDB blocks are uploaded to the object storage for long term storage and compaction. The amount of hours or days of data retained in this stateful set, which acts a local cache was fixed in API Version |
| thanos-store-shard | It acts primarily as an API gateway and therefore does not need a significant amount of local disk space. It joins a Thanos cluster on startup and advertises the data it can access. It keeps a small amount of information about all remote blocks on local disk and keeps it in sync with the bucket. This data is generally safe to delete across restarts at the cost of increased startup times. |
Note: The time series historical data is stored in object stores. Thanos uses object storage as the primary storage for metrics and metadata related to them. For more details about the object storage and downsampling, see Enabling observability service.
1.1.4. Additional resources
To learn more about observability and the integrated components, see the following topics:
- See Observability service introduction
- See Observability configuration
- See Enabling the observability service
- See the Thanos documentation.
- See the Prometheus Overview.
- See the Alertmanager documentation.
1.2. Observability configuration
When the observability service is enabled, the hub cluster is always configured to collect and send metrics to the configured Thanos instance, regardless of whether hub self-management is enabled or not. When the hub cluster is self-managed, the disableHubSelfManagement parameter is set to false, which is the default setting. The multiclusterhub-operator enables the multicluster-observability-operator pod by default. You must configure the multicluster-observability-operator pod.
Metrics and alerts for the hub cluster appear in the local-cluster namespace. The local-cluster is only available if hub self-management is enabled. You can query the local-cluster metrics in the Grafana explorer. Continue reading to understand what metrics you can collect with the observability component, and for information about the observability pod capacity.
1.2.1. Metric types
By default, OpenShift Container Platform sends metrics to Red Hat using the Telemetry service. The acm_managed_cluster_info is available with Red Hat Advanced Cluster Management and is included with telemetry, but is not displayed on the Red Hat Advanced Cluster Management Observe environments overview dashboard.
View the following table of metric types that are supported by the framework:
| Metric name | Metric type | Labels/tags | Status |
|---|---|---|---|
|
| Gauge |
| Stable |
|
| Histogram | None | Stable. Read Governance metric for more details. |
|
| Histogram | None | Stable. Refer to Governance metric for more details. |
|
| Histogram | None | Stable. Read Governance metric for more details. |
|
| Gauge |
| Stable. Review Governance metric for more details. |
|
| Gauge |
| Stable. Read Managing insight _PolicyReports_ for more details. |
|
| Counter | None | Stable. See the Search components section in the Searching in the console introduction documentation. |
|
| Histogram | None | Stable. See the Search components section in the Searching in the console introduction documentation. |
|
| Histogram | None | Stable. See the Search components section in the Searching in the console introduction documentation. |
|
| Counter | None | Stable. See the Search components section in the Searching in the console introduction documentation. |
|
| Histogram | None | Stable. See the Search components section in the Searching in the console introduction documentation. |
|
| Gauge | None | Stable. See the Search components section in the Searching in the console introduction documentation. |
|
| Histogram | None | Stable. See the Search components section in the Searching in the console introduction documentation. |
1.2.2. Observability pod capacity requests
Observability components require 2701mCPU and 11972Mi memory to install the observability service. The following table is a list of the pod capacity requests for five managed clusters with observability-addons enabled:
| Deployment or StatefulSet | Container name | CPU (mCPU) | Memory (Mi) | Replicas | Pod total CPU | Pod total memory |
|---|---|---|---|---|---|---|
| observability-alertmanager | alertmanager | 4 | 200 | 3 | 12 | 600 |
| config-reloader | 4 | 25 | 3 | 12 | 75 | |
| alertmanager-proxy | 1 | 20 | 3 | 3 | 60 | |
| observability-grafana | grafana | 4 | 100 | 2 | 8 | 200 |
| grafana-dashboard-loader | 4 | 50 | 2 | 8 | 100 | |
| observability-observatorium-api | observatorium-api | 20 | 128 | 2 | 40 | 256 |
| observability-observatorium-operator | observatorium-operator | 100 | 100 | 1 | 10 | 50 |
| observability-rbac-query-proxy | rbac-query-proxy | 20 | 100 | 2 | 40 | 200 |
| oauth-proxy | 1 | 20 | 2 | 2 | 40 | |
| observability-thanos-compact | thanos-compact | 100 | 512 | 1 | 100 | 512 |
| observability-thanos-query | thanos-query | 300 | 1024 | 2 | 600 | 2048 |
| observability-thanos-query-frontend | thanos-query-frontend | 100 | 256 | 2 | 200 | 512 |
| observability-thanos-query-frontend-memcached | memcached | 45 | 128 | 3 | 135 | 384 |
| exporter | 5 | 50 | 3 | 15 | 150 | |
| observability-thanos-receive-controller | thanos-receive-controller | 4 | 32 | 1 | 4 | 32 |
| observability-thanos-receive-default | thanos-receive | 300 | 512 | 3 | 900 | 1536 |
| observability-thanos-rule | thanos-rule | 50 | 512 | 3 | 150 | 1536 |
| configmap-reloader | 4 | 25 | 3 | 12 | 75 | |
| observability-thanos-store-memcached | memcached | 45 | 128 | 3 | 135 | 384 |
| exporter | 5 | 50 | 3 | 15 | 150 | |
| observability-thanos-store-shard | thanos-store | 100 | 1024 | 3 | 300 | 3072 |
1.2.3. Additional resources
- For more information about enabling observability, read Enabling the observability service.
- Read Customizing observability to learn how to configure the observability service, view metrics and other data.
- Read Using Grafana dashboards.
- Learn from the OpenShift Container Platform documentation what types of metrics are collected and sent using telemetry. See Information collected by Telemetry for information.
- Refer to Governance metric for details.
- Read Managing insight PolicyReports.
- Refer to Prometheus recording rules.
- Also refer to Prometheus alerting rules.
1.3. Enabling the observability service
When you enable the observability service on your hub cluster, the multicluster-observability-operator watches for new managed clusters and automatically deploys metric and alert collection services to the managed clusters. You can use metrics and configure Grafana dashboards to make cluster resource information visible, help you save cost, and prevent service disruptions.
Monitor the status of your managed clusters with the observability component, also known as the multicluster-observability-operator pod.
Required access: Cluster administrator, the open-cluster-management:cluster-manager-admin role, or S3 administrator.
1.3.1. Prerequisites
- You must install Red Hat Advanced Cluster Management for Kubernetes. See Installing while connected online for more information.
-
You must define a storage class in the
MultiClusterObservabilitycustom resource, if there is no default storage class specified. - Direct network access to the hub cluster is required. Network access to load balancers and proxies are not supported. For more information, see Networking.
You must configure an object store to create a storage solution.
- Important: When you configure your object store, ensure that you meet the encryption requirements that are necessary when sensitive data is persisted. The observability service uses Thanos supported, stable object stores. You might not be able to share an object store bucket by multiple Red Hat Advanced Cluster Management observability installations. Therefore, for each installation, provide a separate object store bucket.
Red Hat Advanced Cluster Management supports the following cloud providers with stable object stores:
- Amazon Web Services S3 (AWS S3)
- Red Hat Ceph (S3 compatible API)
- Google Cloud Storage
- Azure storage
- Red Hat OpenShift Data Foundation, formerly known as Red Hat OpenShift Container Storage
- Red Hat OpenShift on IBM (ROKS)
1.3.2. Enabling observability from the command line interface
Enable the observability service by creating a MultiClusterObservability custom resource instance. Before you enable observability, see Observability pod capacity requests for more information.
Note:
-
When observability is enabled or disabled on OpenShift Container Platform managed clusters that are managed by Red Hat Advanced Cluster Management, the observability endpoint operator updates the
cluster-monitoring-configconfig map by adding additionalalertmanagerconfiguration that automatically restarts the local Prometheus. -
The observability endpoint operator updates the
cluster-monitoring-configconfig map by adding additionalalertmanagerconfigurations that automatically restart the local Prometheus. When you insert thealertmanagerconfiguration in the OpenShift Container Platform managed cluster, the configuration removes the settings that relate to the retention field of the Prometheus metrics.
Complete the following steps to enable the observability service:
- Log in to your Red Hat Advanced Cluster Management hub cluster.
Create a namespace for the observability service with the following command:
oc create namespace open-cluster-management-observability
oc create namespace open-cluster-management-observabilityCopy to Clipboard Copied! Toggle word wrap Toggle overflow Generate your pull-secret. If Red Hat Advanced Cluster Management is installed in the
open-cluster-managementnamespace, run the following command:DOCKER_CONFIG_JSON=`oc extract secret/multiclusterhub-operator-pull-secret -n open-cluster-management --to=-`
DOCKER_CONFIG_JSON=`oc extract secret/multiclusterhub-operator-pull-secret -n open-cluster-management --to=-`Copy to Clipboard Copied! Toggle word wrap Toggle overflow If the
multiclusterhub-operator-pull-secretis not defined in the namespace, copy thepull-secretfrom theopenshift-confignamespace into theopen-cluster-management-observabilitynamespace. Run the following command:DOCKER_CONFIG_JSON=`oc extract secret/pull-secret -n openshift-config --to=-`
DOCKER_CONFIG_JSON=`oc extract secret/pull-secret -n openshift-config --to=-`Copy to Clipboard Copied! Toggle word wrap Toggle overflow Then, create the pull-secret in the
open-cluster-management-observabilitynamespace, run the following command:oc create secret generic multiclusterhub-operator-pull-secret \ -n open-cluster-management-observability \ --from-literal=.dockerconfigjson="$DOCKER_CONFIG_JSON" \ --type=kubernetes.io/dockerconfigjsonoc create secret generic multiclusterhub-operator-pull-secret \ -n open-cluster-management-observability \ --from-literal=.dockerconfigjson="$DOCKER_CONFIG_JSON" \ --type=kubernetes.io/dockerconfigjsonCopy to Clipboard Copied! Toggle word wrap Toggle overflow Important: If you modify the global pull secret for your cluster by using the OpenShift Container Platform documentation, be sure to also update the global pull secret in the observability namespace. See Updating the global pull secret for more details.
Create a secret for your object storage for your cloud provider. Your secret must contain the credentials to your storage solution. For example, run the following command:
oc create -f thanos-object-storage.yaml -n open-cluster-management-observability
oc create -f thanos-object-storage.yaml -n open-cluster-management-observabilityCopy to Clipboard Copied! Toggle word wrap Toggle overflow View the following examples of secrets for the supported object stores:
For Amazon S3 or S3 compatible, your secret might resemble the following file:
Copy to Clipboard Copied! Toggle word wrap Toggle overflow - 1
- Enter the URL without the protocol. Enter the URL for your Amazon S3 endpoint that might resemble the following URL:
s3.us-east-1.amazonaws.com.
For more details, see the Amazon Simple Storage Service user guide.
For Google Cloud Platform, your secret might resemble the following file:
Copy to Clipboard Copied! Toggle word wrap Toggle overflow For more details, see Google Cloud Storage.
For Azure your secret might resemble the following file:
Copy to Clipboard Copied! Toggle word wrap Toggle overflow - 1
- If you use the
msi_resourcepath, the endpoint authentication is complete by using the system-assigned managed identity. Your value must resemble the following endpoint:https://<storage-account-name>.blob.core.windows.net.
If you use the
user_assigned_idpath, endpoint authentication is complete by using the user-assigned managed identity. When you use theuser_assigned_id, themsi_resourceendpoint default value ishttps:<storage_account>.<endpoint>. For more details, see Azure Storage documentation.Note: If you use Azure as an object storage for a Red Hat OpenShift Container Platform cluster, the storage account associated with the cluster is not supported. You must create a new storage account.
For Red Hat OpenShift Data Foundation, your secret might resemble the following file:
Copy to Clipboard Copied! Toggle word wrap Toggle overflow - 1
- Enter the URL without the protocol. Enter the URL for your Red Hat OpenShift Data Foundation endpoint that might resemble the following URL:
example.redhat.com:443.
For more details, see Red Hat OpenShift Data Foundation.
For Red Hat OpenShift on IBM (ROKS), your secret might resemble the following file:
Copy to Clipboard Copied! Toggle word wrap Toggle overflow - 1
- Enter the URL without the protocol. Enter the URL for your Red Hat OpenShift Data Foundation endpoint that might resemble the following URL:
example.redhat.com:443.
For more details, follow the IBM Cloud documentation, Cloud Object Storage. Be sure to use the service credentials to connect with the object storage. For more details, follow the IBM Cloud documentation, Cloud Object Store and Service Credentials.
1.3.2.1. Configuring storage for AWS Security Token Service
For Amazon S3 or S3 compatible storage, you can also use short term, limited-privilege credentials that are generated with AWS Security Token Service (AWS STS). Refer to AWS Security Token Service documentation for more details.
Generating access keys using AWS Security Service require the following additional steps:
- Create an IAM policy that limits access to an S3 bucket.
- Create an IAM role with a trust policy to generate JWT tokens for OpenShift Container Platform service accounts.
- Specify annotations for the observability service accounts that requires access to the S3 bucket. You can find an example of how observability on Red Hat OpenShift Service on AWS (ROSA) cluster can be configured to work with AWS STS tokens in the Set environment step. See Red Hat OpenShift Service on AWS (ROSA) for more details, along with ROSA with STS explained for an in-depth description of the requirements and setup to use STS tokens.
1.3.2.2. Generating access keys using the AWS Security Service
Complete the following steps to generate access keys using the AWS Security Service:
Set up the AWS environment. Run the following commands:
Copy to Clipboard Copied! Toggle word wrap Toggle overflow Create an S3 bucket with the following command:
aws s3 mb s3://$S3_BUCKET
aws s3 mb s3://$S3_BUCKETCopy to Clipboard Copied! Toggle word wrap Toggle overflow Create a
s3-policyJSON file for access to your S3 bucket. Run the following command:Copy to Clipboard Copied! Toggle word wrap Toggle overflow Apply the policy with the following command:
S3_POLICY=$(aws iam create-policy --policy-name $CLUSTER_NAME-acm-obs \
--policy-document file://$SCRATCH_DIR/s3-policy.json \
--query 'Policy.Arn' --output text)
echo $S3_POLICY
S3_POLICY=$(aws iam create-policy --policy-name $CLUSTER_NAME-acm-obs \
--policy-document file://$SCRATCH_DIR/s3-policy.json \
--query 'Policy.Arn' --output text)
echo $S3_POLICY
Copy to Clipboard Copied! Toggle word wrap Toggle overflow Create a
TrustPolicyJSON file. Run the following command:Copy to Clipboard Copied! Toggle word wrap Toggle overflow Create a role for AWS Prometheus and CloudWatch with the following command:
S3_ROLE=$(aws iam create-role \
  --role-name "$CLUSTER_NAME-acm-obs-s3" \
  --assume-role-policy-document file://$SCRATCH_DIR/TrustPolicy.json \
  --query "Role.Arn" --output text)
echo $S3_ROLE
S3_ROLE=$(aws iam create-role \
  --role-name "$CLUSTER_NAME-acm-obs-s3" \
  --assume-role-policy-document file://$SCRATCH_DIR/TrustPolicy.json \
  --query "Role.Arn" --output text)
echo $S3_ROLE
Copy to Clipboard Copied! Toggle word wrap Toggle overflow Attach the policies to the role. Run the following command:
aws iam attach-role-policy \
  --role-name "$CLUSTER_NAME-acm-obs-s3" \
  --policy-arn $S3_POLICY
aws iam attach-role-policy \
  --role-name "$CLUSTER_NAME-acm-obs-s3" \
  --policy-arn $S3_POLICY
Copy to Clipboard Copied! Toggle word wrap Toggle overflow Your secret might resemble the following file. The
configsection specifiessignature_version2: falseand does not specifyaccess_keyandsecret_key:Copy to Clipboard Copied! Toggle word wrap Toggle overflow -
Specify service account annotations when you the
MultiClusterObservabilitycustom resource as described in Creating the MultiClusterObservability custom resource section. You can retrieve the S3 access key and secret key for your cloud providers with the following commands. You must decode, edit, and encode your
base64string in the secret:Copy to Clipboard Copied! Toggle word wrap Toggle overflow Verify that observability is enabled by checking the pods for the following deployments and stateful sets. You might receive the following information:
observability-thanos-query (deployment)
observability-thanos-compact (statefulset)
observability-thanos-receive-default  (statefulset)
observability-thanos-rule   (statefulset)
observability-thanos-store-shard-x  (statefulsets)
observability-thanos-query (deployment)
observability-thanos-compact (statefulset)
observability-thanos-receive-default  (statefulset)
observability-thanos-rule   (statefulset)
observability-thanos-store-shard-x  (statefulsets)
Copy to Clipboard Copied! Toggle word wrap Toggle overflow
1.3.2.3. Creating the MultiClusterObservability custom resource
Use the MultiClusterObservability custom resource to specify the persistent volume storage size for various components. You must set the storage size during the initial creation of the MultiClusterObservability custom resource. When you update the storage size values post-deployment, changes take effect only if the storage class supports dynamic volume expansion. For more information, see Expanding persistent volumes from the Red Hat OpenShift Container Platform documentation.
Complete the following steps to create the MultiClusterObservability custom resource on your hub cluster:
Create the
MultiClusterObservabilitycustom resource YAML file namedmulticlusterobservability_cr.yaml.View the following default YAML file for observability:
Copy to Clipboard Copied! Toggle word wrap Toggle overflow You might want to modify the value for the
retentionConfigparameter in theadvancedsection. For more information, see Thanos Downsampling resolution and retention. Depending on the number of managed clusters, you might want to update the amount of storage for stateful sets. If your S3 bucket is configured to use STS tokens, annotate the service accounts to use STS with S3 role. View the following configuration:Copy to Clipboard Copied! Toggle word wrap Toggle overflow See Observability API for more information.
To deploy on infrastructure machine sets, you must set a label for your set by updating the
nodeSelectorin theMultiClusterObservabilityYAML. Your YAML might resemble the following content:nodeSelector: node-role.kubernetes.io/infra:nodeSelector: node-role.kubernetes.io/infra:Copy to Clipboard Copied! Toggle word wrap Toggle overflow For more information, see Creating infrastructure machine sets.
Apply the observability YAML to your cluster by running the following command:
oc apply -f multiclusterobservability_cr.yaml
oc apply -f multiclusterobservability_cr.yamlCopy to Clipboard Copied! Toggle word wrap Toggle overflow All the pods in
open-cluster-management-observabilitynamespace for Thanos, Grafana and Alertmanager are created. All the managed clusters connected to the Red Hat Advanced Cluster Management hub cluster are enabled to send metrics back to the Red Hat Advanced Cluster Management Observability service.- Validate that the observability service is enabled and the data is populated by launching the Grafana dashboards.
Click the Grafana link that is near the console header, from either the console Overview page or the Clusters page.
-
Alternatively, access the OpenShift Container Platform 3.11 Grafana dashboards with the following URL:
https://$ACM_URL/grafana/dashboards. - To view the OpenShift Container Platform 3.11 dashboards, select the folder named OCP 3.11 .
-
Alternatively, access the OpenShift Container Platform 3.11 Grafana dashboards with the following URL:
Access the
multicluster-observability-operatordeployment to verify that themulticluster-observability-operatorpod is being deployed by themulticlusterhub-operatordeployment. Run the following command:oc get deploy multicluster-observability-operator -n open-cluster-management --show-labels NAME READY UP-TO-DATE AVAILABLE AGE LABELS multicluster-observability-operator 1/1 1 1 35m installer.name=multiclusterhub,installer.namespace=open-cluster-management
oc get deploy multicluster-observability-operator -n open-cluster-management --show-labels NAME READY UP-TO-DATE AVAILABLE AGE LABELS multicluster-observability-operator 1/1 1 1 35m installer.name=multiclusterhub,installer.namespace=open-cluster-managementCopy to Clipboard Copied! Toggle word wrap Toggle overflow View the
labelssection of themulticluster-observability-operatordeployment for labels that are associated with the resource. Thelabelssection might contain the following details:labels: installer.name: multiclusterhub installer.namespace: open-cluster-managementlabels: installer.name: multiclusterhub installer.namespace: open-cluster-managementCopy to Clipboard Copied! Toggle word wrap Toggle overflow
. . Optional: If you want to exclude specific managed clusters from collecting the observability data, add the following cluster label to your clusters: observability: disabled.
The observability service is enabled. After you enable the observability service, the following functions are initiated:
- All the alert managers from the managed clusters are forwarded to the Red Hat Advanced Cluster Management hub cluster.
All the managed clusters that are connected to the Red Hat Advanced Cluster Management hub cluster are enabled to send alerts back to the Red Hat Advanced Cluster Management observability service. You can configure the Red Hat Advanced Cluster Management Alertmanager to take care of deduplicating, grouping, and routing the alerts to the correct receiver integration such as email, PagerDuty, or OpsGenie. You can also handle silencing and inhibition of the alerts.
Note: Alert forwarding to the Red Hat Advanced Cluster Management hub cluster feature is only supported by managed clusters with Red Hat OpenShift Container Platform version 4.13 or later. After you install Red Hat Advanced Cluster Management with observability enabled, alerts from OpenShift Container Platform 4.13 and later are automatically forwarded to the hub cluster. See Forwarding alerts to learn more.
1.3.3. Enabling observability from the Red Hat OpenShift Container Platform console
Optionally, you can enable observability from the Red Hat OpenShift Container Platform console, create a project named open-cluster-management-observability. Be sure to create an image pull-secret named, multiclusterhub-operator-pull-secret in the open-cluster-management-observability project.
Create your object storage secret named, thanos-object-storage in the open-cluster-management-observability project. Enter the object storage secret details, then click Create. See step four of the Enabling observability section to view an example of a secret.
Create the MultiClusterObservability custom resource instance. When you receive the following message, the observability service is enabled successfully from OpenShift Container Platform: Observability components are deployed and running.
1.3.3.1. Verifying the Thanos version
After Thanos is deployed on your cluster, verify the Thanos version from the command line interface (CLI).
After you log in to your hub cluster, run the following command in the observability pods to receive the Thanos version:
thanos --version
thanos --versionThe Thanos version is displayed.
1.3.4. Disabling observability
You can disable observability, which stops data collection on the Red Hat Advanced Cluster Management hub cluster.
1.3.4.1. Disabling observability on all clusters
Disable observability by removing observability components on all managed clusters. Update the multicluster-observability-operator resource by setting enableMetrics to false. Your updated resource might resemble the following change:
spec:
  imagePullPolicy: Always
  imagePullSecret: multiclusterhub-operator-pull-secret
  observabilityAddonSpec: # The ObservabilityAddonSpec defines the global settings for all managed clusters which have observability add-on enabled
    enableMetrics: false #indicates the observability addon push metrics to hub server
spec:
  imagePullPolicy: Always
  imagePullSecret: multiclusterhub-operator-pull-secret
  observabilityAddonSpec: # The ObservabilityAddonSpec defines the global settings for all managed clusters which have observability add-on enabled
enableMetrics: false #indicates the observability addon push metrics to hub server1.3.4.2. Disabling observability on a single cluster
Disable observability by removing observability components on specific managed clusters. Add the observability: disabled label to the managedclusters.cluster.open-cluster-management.io custom resource. From the Red Hat Advanced Cluster Management console Clusters page, add the observability=disabled label to the specified cluster.
Note: When a managed cluster with the observability component is detached, the metrics-collector deployments are removed.
1.3.5. Removing observability
When you remove the MultiClusterObservability custom resource, you are disabling and uninstalling the observability service. From the OpenShift Container Platform console navigation, select Operators > Installed Operators > Advanced Cluster Manager for Kubernetes. Remove the MultiClusterObservability custom resource.
1.3.6. Additional resources
Links to cloud provider documentation for object storage information:
- See Using observability.
- To learn more about customizing the observability service, see Customizing observability.
- For more related topics, return to the Observability service introduction.
1.4. Customizing observability configuration
After you enable observability, customize the observability configuration to the specific needs of your environment. Manage and view cluster fleet data that the observability service collects.
Required access: Cluster administrator
- Creating custom rules
- Adding custom metrics
- Adding advanced configuration for retention
- Updating the MultiClusterObservability custom resource replicas from the console
- Increasing and decreasing persistent volumes and persistent volume claims
- Customizing route certification
- Customizing certificates for accessing the object store
- Configuring proxy settings for observability add-ons
- Disabling proxy settings for observability add-ons
1.4.1. Creating custom rules
Create custom rules for the observability installation by adding Prometheus recording rules and alerting rules to the observability resource.
To precalculate expensive expressions, use the recording rules abilities. The results are saved as a new set of time series. With the alerting rules, you can specify the alert conditions based on how you want to send an alert to an external service.
Note: When you update your custom rules, observability-thanos-rule pods restart automatically.
Define custom rules with Prometheus to create alert conditions, and send notifications to an external messaging service. View the following examples of custom rules:
Create a custom alert rule. Create a config map named
thanos-ruler-custom-rulesin theopen-cluster-management-observabilitynamespace. You must name the key,custom_rules.yaml, as shown in the following example. You can create multiple rules in the configuration.Create a custom alert rule that notifies you when your CPU usage passes your defined value. Your YAML might resemble the following content:
Copy to Clipboard Copied! Toggle word wrap Toggle overflow -
The default alert rules are in the
thanos-ruler-default-rulesconfig map of theopen-cluster-management-observabilitynamespace.
Create a custom recording rule within the
thanos-ruler-custom-rulesconfig map. Create a recording rule that gives you the ability to get the sum of the container memory cache of a pod. Your YAML might resemble the following content:Copy to Clipboard Copied! Toggle word wrap Toggle overflow Note: After you make changes to the config map, the configuration automatically reloads. The configuration reloads because of the
config-reloadwithin theobservability-thanos-rulersidecar.-
To verify that the alert rules are functioning correctly, go to the Grafana dashboard, select the Explore page, and query
ALERTS. The alert is only available in Grafana if you created the alert.
1.4.2. Adding custom metrics
To monitor metrics from a remote cluster by using Red Hat Advanced Cluster Management for Kubernetes, check if the metric is exported as a Platform or a User workload metric. Use one of the following three methods to find the metric type:
- Find the metric type in the documentation of the solution you want to monitor.
- Find the metric type by contacting the support for your product.
Find the metric type by checking the annotation that the
ServiceMonitorfor the observed resource uses.-
Platform metrics use
operator.prometheus.io/controller-id: openshift-platform-monitoring/prometheus-operator. -
User workload metrics use
operator.prometheus.io/controller-id: openshift-user-workload-monitoring/prometheus-operator.
-
Platform metrics use
You can also find ServiceMonitors in the console by going to Observe > Targets and choosing Platform or User from the Source filter in the top right.
Note: The Source filter provides service monitor or target information, not a list of metrics.
If the metric is a Platform, continue at Adding Platform metrics. If the metric is a User workload, continue at Adding user workload metrics.
1.4.2.1. Adding Platform metrics
You can monitor Platform metrics by creating a ConfigMap on the hub cluster in the open-cluster-management-observability namespace. Use observability-metrics-custom-allowlist as the name. See the following ConfigMap example that you can use to monitor Platform metrics:
The name for the metrics you collect is the same name that you define in your managed cluster record parameter. After you run the query expression, you get the metric value results. You can use one section or both sections, which applies to every cluster with monitoring enabled.
If you only want to collect custom metrics from a single managed cluster, use the following example and apply the config map on your managed cluster in the open-cluster-management-addon-observability namespace:
The name for the metrics you collect is the same name that you define in your managed cluster record parameter. After you run the query expression, you get the metric value results. You can use one section or both sections.
1.4.2.2. Adding User workload metrics
You can monitor User workload metrics by setting the configuration on the managed cluster in namespace where you want to capture the metric. The name must be observability-metrics-custom-allowlist and the format must be the same as the following example:
- 1
- Add the namespace where you want to capture the metric.
- 2
- Add the value of the config map data in YAML format. Add list of metric names that you want to collect from the
testnamespace to thenamessection. After you create the config map, the observability collector collects and pushes the metrics from the target namespace to the hub cluster.
The previous example monitors the User workload metric sample_metrics from the namespace monitored_namespace. If you create the configuration in the open-cluster-management-addon-observability namespace instead, the metrics are collected from all the namespaces of the managed cluster.
1.4.2.3. Removing default metrics
If you do not want to collect data for a specific metric from your managed cluster, remove the metric from the observability-metrics-custom-allowlist.yaml file. When you remove a metric, the metric data is not collected from your managed clusters. Complete the following steps to remove a default metric:
Verify that
mco observabilityis enabled by using the following command:oc get mco observability -o yaml
oc get mco observability -o yamlCopy to Clipboard Copied! Toggle word wrap Toggle overflow Add the name of the default metric to the
metrics_list.yamlparameter with a hyphen-at the start of the metric name. View the following metric example:-cluster_infrastructure_provider
-cluster_infrastructure_providerCopy to Clipboard Copied! Toggle word wrap Toggle overflow Create the
observability-metrics-custom-allowlistconfig map in theopen-cluster-management-observabilitynamespace with the following command:oc apply -n open-cluster-management-observability -f observability-metrics-custom-allowlist.yaml
oc apply -n open-cluster-management-observability -f observability-metrics-custom-allowlist.yamlCopy to Clipboard Copied! Toggle word wrap Toggle overflow - Verify that the observability service is not collecting the specific metric from your managed clusters. When you query the metric from the Grafana dashboard, the metric is not displayed.
1.4.3. Adding advanced configuration for retention
To update the retention for each observability component according to your need, add the advanced configuration section. Complete the following steps:
Edit the
MultiClusterObservabilitycustom resource with the following command:oc edit mco observability -o yaml
oc edit mco observability -o yamlCopy to Clipboard Copied! Toggle word wrap Toggle overflow Add the
advancedsection to the file. Your YAML file might resemble the following contents:Copy to Clipboard Copied! Toggle word wrap Toggle overflow Notes:
-
For descriptions of all the parameters that can added into the
advancedconfiguration, see the Observability API documentation. -
The default retention for all resolution levels, such as
retentionResolutionRaw,retentionResolution5m, orretentionResolution1h, is 365 days (365d). You must set an explicit value for the resolution retention in yourMultiClusterObservabilityspec.advanced.retentionConfigparameter.
-
For descriptions of all the parameters that can added into the
If you upgraded from an earlier version and want to keep that version retention configuration, add the configuration previously mentioned. Complete the following steps:
Go to your
MultiClusterObservabilityresource by running the following command:oc edit mco observability
oc edit mco observabilityCopy to Clipboard Copied! Toggle word wrap Toggle overflow -
In the
spec.advanced.retentionConfigparameter, apply the following configuration:
Copy to Clipboard Copied! Toggle word wrap Toggle overflow
1.4.4. Dynamic metrics for single-node OpenShift clusters
Dynamic metrics collection supports automatic metric collection based on certain conditions. By default, a single-node OpenShift cluster does not collect pod and container resource metrics. Once a single-node OpenShift cluster reaches a specific level of resource consumption, the defined granular metrics are collected dynamically. When the cluster resource consumption is consistently less than the threshold for a period of time, granular metric collection stops.
The metrics are collected dynamically based on the conditions on the managed cluster specified by a collection rule. Because these metrics are collected dynamically, the following Red Hat Advanced Cluster Management Grafana dashboards do not display any data. When a collection rule is activated and the corresponding metrics are collected, the following panels display data for the duration of the time that the collection rule is initiated:
- Kubernetes/Compute Resources/Namespace (Pods)
- Kubernetes/Compute Resources/Namespace (Workloads)
- Kubernetes/Compute Resources/Nodes (Pods)
- Kubernetes/Compute Resources/Pod
- Kubernetes/Compute Resources/Workload A collection rule includes the following conditions:
- A set of metrics to collect dynamically.
- Conditions written as a PromQL expression.
-
A time interval for the collection, which must be set to
true. - A match expression to select clusters where the collect rule must be evaluated.
By default, collection rules are evaluated continuously on managed clusters every 30 seconds, or at a specific time interval. The lowest value between the collection interval and time interval takes precedence. Once the collection rule condition persists for the duration specified by the for attribute, the collection rule starts and the metrics specified by the rule are automatically collected on the managed cluster. Metrics collection stops automatically after the collection rule condition no longer exists on the managed cluster, at least 15 minutes after it starts.
The collection rules are grouped together as a parameter section named collect_rules, where it can be enabled or disabled as a group. Red Hat Advanced Cluster Management installation includes the collection rule group, SNOResourceUsage with two default collection rules: HighCPUUsage and HighMemoryUsage. The HighCPUUsage collection rule begins when the node CPU usage exceeds 70%. The HighMemoryUsage collection rule begins if the overall memory utilization of the single-node OpenShift cluster exceeds 70% of the available node memory. Currently, the previously mentioned thresholds are fixed and cannot be changed. When a collection rule begins for more than the interval specified by the for attribute, the system automatically starts collecting the metrics that are specified in the dynamic_metrics section.
View the list of dynamic metrics that from the collect_rules section, in the following YAML file:
A collect_rules.group can be disabled in the custom-allowlist as shown in the following example. When a collect_rules.group is disabled, metrics collection reverts to the previous behavior. These metrics are collected at regularly, specified intervals:
collect_rules:
  - group: -SNOResourceUsage
collect_rules:
- group: -SNOResourceUsageThe data is only displayed in Grafana when the rule is initiated.
1.4.5. Updating the MultiClusterObservability custom resource replicas from the console
If your workload increases, increase the number of replicas of your observability pods. Navigate to the Red Hat OpenShift Container Platform console from your hub cluster. Locate the MultiClusterObservability custom resource, and update the replicas parameter value for the component where you want to change the replicas. Your updated YAML might resemble the following content:
spec:
   advanced:
      receive:
         replicas: 6
spec:
   advanced:
      receive:
         replicas: 6
For more information about the parameters within the mco observability custom resource, see the Observability API documentation.
1.4.6. Increasing and decreasing persistent volumes and persistent volume claims
Increase and decrease the persistent volume and persistent volume claims to change the amount of storage in your storage class. Complete the following steps:
-
To increase the size of the persistent volume, update the
MultiClusterObservabilitycustom resource if the storage class support expanding volumes. To decrease the size of the persistent volumes remove the pods using the persistent volumes, delete the persistent volume and recreate them. You might experience data loss in the persistent volume. Complete the following steps:
-
Pause the
MultiClusterObservabilityoperator by adding the annotationmco-pause: "true"to theMultiClusterObservabilitycustom resource. Look for the stateful sets or deployments of the desired component. Change their replica count to
0. This initiates a shutdown, which involves uploading local data when applicable to avoid data loss. For example, the ThanosReceivestateful set is namedobservability-thanos-receive-defaultand has three replicas by default. Therefore, you are looking for the following persistent volume claims:-
data-observability-thanos-receive-default-0 -
data-observability-thanos-receive-default-1 -
data-observability-thanos-receive-default-2
-
- Delete the persistent volumes and persistent volume claims used by the desired component.
-
In the
MultiClusterObservabilitycustom resource, edit the storage size in the configuration of the component to the desired amount in the storage size field. Prefix with the name of the component. -
Unpause the
MultiClusterObservabilityoperator by removing the previously added annotation. -
To initiate a reconcilation after having the operator paused, delete the
multicluster-observability-operatorandobservatorium-operatorpods. The pods are recreated and reconciled immediately.
-
Pause the
-
Verify that persistent volume and volume claims are updated by checking the
MultiClusterObservabilitycustom resource.
1.4.7. Customizing route certificate
If you want to customize the OpenShift Container Platform route certification, you must add the routes in the alt_names section. To ensure your OpenShift Container Platform routes are accessible, add the following information: alertmanager.apps.<domainname>, observatorium-api.apps.<domainname>, rbac-query-proxy.apps.<domainname>.
For more details, see Replacing certificates for alertmanager route in the Governance documentation.
Note: Users are responsible for certificate rotations and updates.
1.4.8. Customizing certificates for accessing the object store
You can configure secure connections with the observability object store by creating a Secret resource that contains the certificate authority and configuring the MultiClusterObservability custom resource. Complete the following steps:
To validate the object store connection, create the
Secretobject in the file that contains the certificate authority by using the following command:oc create secret generic <tls_secret_name> --from-file=ca.crt=<path_to_file> -n open-cluster-management-observability
oc create secret generic <tls_secret_name> --from-file=ca.crt=<path_to_file> -n open-cluster-management-observabilityCopy to Clipboard Copied! Toggle word wrap Toggle overflow - Alternatively, you can apply the following YAML to create the secret:
Copy to Clipboard Copied! Toggle word wrap Toggle overflow Optional: If you want to enable mutual TLS, you need to add the
public.crtandprivate.keykeys in the previous secret.Add the TLS secret details to the
metricObjectStoragesection by using the following command:oc edit mco observability -o yaml
oc edit mco observability -o yamlCopy to Clipboard Copied! Toggle word wrap Toggle overflow Your file might resemble the following YAML:
metricObjectStorage:
  key: thanos.yaml
  name: thanos-object-storage
  tlsSecretName: tls-certs-secret
  tlsSecretMountPath: /etc/minio/certs
metricObjectStorage:
  key: thanos.yaml
  name: thanos-object-storage
  tlsSecretName: tls-certs-secret
1 tlsSecretMountPath: /etc/minio/certs2 Copy to Clipboard Copied! Toggle word wrap Toggle overflow Update the
thanos.yamldefinition in thethanos-object-storagesecret by adding thehttp_config.tls_configsection with the certificate details. View the following example:Copy to Clipboard Copied! Toggle word wrap Toggle overflow Optional: If you want to enable mutual TLS, you need to add the
cert_fileandkey_filekeys to thetls_configsection. See the following example:Copy to Clipboard Copied! Toggle word wrap Toggle overflow - 1
- The path for
ca_file,cert_file, andkey_filemust match thetlsSecretMountPathfrom theMultiClusterObservabilitycustom resource. Theca.crt,public.crt, andprivate.crtmust match the respective key in thetls_secret_name>Secretresource.
To verify that you can access the object store, check that the pods are deployed. Run the following command:
oc -n open-cluster-management-observability get pods -l app.kubernetes.io/name=thanos-store
oc -n open-cluster-management-observability get pods -l app.kubernetes.io/name=thanos-storeCopy to Clipboard Copied! Toggle word wrap Toggle overflow
1.4.9. Configuring proxy settings for observability add-ons
Configure the proxy settings to allow the communications from the managed cluster to access the hub cluster through a HTTP and HTTPS proxy server. Typically, add-ons do not need any special configuration to support HTTP and HTTPS proxy servers between a hub cluster and a managed cluster. But if you enabled the observability add-on, you must complete the proxy configuration.
1.4.10. Prerequisite
- You have a hub cluster.
- You have enabled the proxy settings between the hub cluster and managed cluster.
Complete the following steps to configure the proxy settings for the observability add-on:
- Go to the cluster namespace on your hub cluster.
Create an
AddOnDeploymentConfigresource with the proxy settings by adding aspec.proxyConfigparameter. View the following YAML example:Copy to Clipboard Copied! Toggle word wrap Toggle overflow To get the IP address, run following command on your managed cluster:
oc -n default describe svc kubernetes | grep IP:
oc -n default describe svc kubernetes | grep IP:Copy to Clipboard Copied! Toggle word wrap Toggle overflow Go to the
ManagedClusterAddOnresource and update it by referencing theAddOnDeploymentConfigresource that you made. View the following YAML example:Copy to Clipboard Copied! Toggle word wrap Toggle overflow Verify the proxy settings. If you successfully configured the proxy settings, the metric collector deployed by the observability add-on agent on the managed cluster sends the data to the hub cluster. Complete the following steps:
- Go to the hub cluster then the managed cluster on the Grafana dashboard.
- View the metrics for the proxy settings.
1.4.11. Disabling proxy settings for observability add-ons
If your development needs change, you might need to disable the proxy setting for the observability add-ons you configured for the hub cluster and managed cluster. You can disable the proxy settings for the observability add-on at any time. Complete the following steps:
-
Go to the
ManagedClusterAddOnresource. -
Remove the referenced
AddOnDeploymentConfigresource.
1.4.12. Additional resources
- Refer to Prometheus configuration for more information. For more information about recording rules and alerting rules, refer to the recording rules and alerting rules from the Prometheus documentation.
- For more information about viewing the dashboard, see Using Grafana dashboards.
- See Exporting metrics to external endpoints.
- See Enabling monitoring for user-defined projects.
- See the Observability API.
- For information about updating the certificate for the alertmanager route, see Replacing certificates for alertmanager.
- For more details about observability alerts, see Observability alerts
- To learn more about alert forwarding, see the Prometheus Alertmanager documentation.
- See Observability alerts for more information.
- For more topics about the observability service, see Observability service introduction.
- See Management Workload Partitioning for more information.
1.5. Using Observability
Use the Observability service to view the utilization of clusters across your fleet.
Required access: Cluster administrator
1.5.1. Querying metrics using the Observability API
To access your endpoint by using the mutual TLS, which verifies the identities of both parties in a network connection, query metrics through the Red Hat OpenShift Container Platform rbac-query-proxy route with the Observability external API. Complete the following steps to get your queries for the rbac-query-proxy route:
Get the details of the route with the following command:
oc get route rbac-query-proxy -n open-cluster-management-observability
oc get route rbac-query-proxy -n open-cluster-management-observabilityCopy to Clipboard Copied! Toggle word wrap Toggle overflow To access the
rbac-query-proxyroute with your OpenShift Container Platform OAuth access token, run the following command to get the token. The token must be associated with a user or service account, which has permission to get namespaces:MY_TOKEN=$(oc whoami --show-token)
MY_TOKEN=$(oc whoami --show-token)Copy to Clipboard Copied! Toggle word wrap Toggle overflow To access the
openshift-ingressroute, get the default CA certificate and store the content of thetls.crtkey in a local file. Run the following command:oc -n openshift-ingress get secret router-certs-default -o jsonpath="{.data.tls\.crt}" | base64 -d > ca.crtoc -n openshift-ingress get secret router-certs-default -o jsonpath="{.data.tls\.crt}" | base64 -d > ca.crtCopy to Clipboard Copied! Toggle word wrap Toggle overflow Note: The
router-certs-defaultsecret does not exist if your hub cluster is running on OpenShift Service on AWS. Instead, use the CA certificate thatspec.defaultCertificate.namepoints to in the default ingress controller object. Store the content of thetls.crtkey in a local file. Complete the following steps:Get the name of the
spec.defaultCertificate.nameby running the following command:SECRET_NAME=$(oc get ingresscontroller default -n openshift-ingress-operator -o jsonpath=" {.spec.defaultCertificate.name}")SECRET_NAME=$(oc get ingresscontroller default -n openshift-ingress-operator -o jsonpath=" {.spec.defaultCertificate.name}")Copy to Clipboard Copied! Toggle word wrap Toggle overflow Extract the certificate from the secret by running the following command:
oc get secret $SECRET_NAME -n openshift-ingress -o jsonpath=" {.data.tls\.crt}" | base64 -d > ca.crtoc get secret $SECRET_NAME -n openshift-ingress -o jsonpath=" {.data.tls\.crt}" | base64 -d > ca.crtCopy to Clipboard Copied! Toggle word wrap Toggle overflow
To query metrics from the API, run the following command:
curl --cacert ./ca.crt -H "Authorization: Bearer {TOKEN}" https://{PROXY_ROUTE_URL}/api/v1/query?query={QUERY_EXPRESSION}curl --cacert ./ca.crt -H "Authorization: Bearer {TOKEN}" https://{PROXY_ROUTE_URL}/api/v1/query?query={QUERY_EXPRESSION}Copy to Clipboard Copied! Toggle word wrap Toggle overflow Note: The
QUERY_EXPRESSIONis the standard Prometheus query expression. For example, query the metricscluster_infrastructure_providerby replacing the URL in the previous command with the following URL:https://{PROXY_ROUTE_URL}/api/v1/query?query=cluster_infrastructure_provider. For more details, see Querying Prometheus.-
If you want to configure custom certificates for the
rbac-query-proxyroute, see Replacing certificates for rbac-query-proxy route.
1.5.1.1. Exporting metrics to external endpoints
To support the Prometheus Remote-Write specification in real time, export metrics to external endpoints. Complete the following steps to export metrics to external endpoints:
Create the Kubernetes secret for an external endpoint with the access information of the external endpoint in the
open-cluster-management-observabilitynamespace. View the following example secret:Copy to Clipboard Copied! Toggle word wrap Toggle overflow - 1
- The
ep.yamlparameter is the key of the content and is used in theMultiClusterObservabilitycustom resource in next step. Currently, Observability supports exporting metrics to endpoints without any security checks, with basic authentication or withtlsenablement. View the following tables for a full list of supported parameters: - 2
- The
urlparameter is required and the URL for the external endpoint. Enter the value as a string. - 3
- The
http_client_configparameter is optional and is the advanced configuration for the HTTP client. - 4
- The
basic_authparameter is optional and is the HTTP client configuration for basic authentication. - 5
- The
usernameparameter is optional and is the user name for basic authorization. Enter the value as a string. - 6
- The
passwordis optional and is the password for basic authorization. Enter the value as a string. - 7
- The
tls_configparameter is optional and is the HTTP client configuration for TLS. - 8
- The
secret_nameparameter is required and is the name of the secret that contains certificates. Enter the value as a string. - 9
- The
ca_file_keyparameter is required and the key of the CA certificate in the secret. This parameter is only optional if theinsecure_skip_verifyparameter is set totrue. Enter the value as a string. - 10
- The
cert_file_keyparameter is required and is the key of the client certificate in the secret. Enter the value as a string. - 11
- The
key_file_keyparameter is required and is the key of the client key in the secret. Enter the value as a string. - 12
- The
insecure_skip_verifyparameter is optional and used to skip the verification for target certificate. Enter the value as a boolean value.
To add a list of external endpoints that you want to export, add the
writeStorageparameter to theMultiClusterObservabilitycustom resource. View the following example:spec: storageConfig: writeStorage: - key: ep.yaml name: victoriametricsspec: storageConfig: writeStorage:1 - key: ep.yaml name: victoriametricsCopy to Clipboard Copied! Toggle word wrap Toggle overflow - 1
- Each item contains two attributes: name and key. Name is the name of the Kubernetes secret that contains endpoint access information, and key is the key of the content in the secret. If you add more than one item to the list, then the metrics are exported to multiple external endpoints.
View the status of metric export after the metrics export is enabled by checking the
acm_remote_write_requests_totalmetric.- From the OpenShift Container Platform console of your hub cluster, navigate to the Metrics page by clicking Metrics in the Observe section.
-
Then query the
acm_remote_write_requests_totalmetric. The value of that metric is the total number of requests with a specific response for one external endpoint, on one observatorium API instance. Thenamelabel is the name for the external endpoint. Thecodelabel is the return code of the HTTP request for the metrics export.
1.5.2. Viewing and exploring data by using dashboards
View the data from your managed clusters by accessing Grafana from the hub cluster. You can query specific alerts and add filters for the query.
For example, to explore the cluster_infrastructure_provider alert from a single-node OpenShift cluster, use the following query expression: cluster_infrastructure_provider{clusterType="SNO"}
Note: Do not set the ObservabilitySpec.resources.CPU.limits parameter if Observability is enabled on single node managed clusters. When you set the CPU limits, it causes the Observability pod to be counted against the capacity for your managed cluster. See the reference for Management Workload Partitioning in the Additional resources section.
1.5.2.1. Viewing historical data
When you query historical data, manually set your query parameter options to control how much data is displayed from the dashboard. Complete the following steps:
- From your hub cluster, select the Grafana link that is in the console header.
- Edit your cluster dashboard by selecting Edit Panel.
- From the Query front-end data source in Grafana, click the Query tab.
-
Select
$datasource. - If you want to see more data, increase the value of the Step parameter section. If the Step parameter section is empty, it is automatically calculated.
-
Find the Custom query parameters field and select
max_source_resolution=auto. - To verify that the data is displayed, refresh your Grafana page.
Your query data appears from the Grafana dashboard.
1.5.2.2. Viewing Red Hat Advanced Cluster Management dashboards
When you enable the Red Hat Advanced Cluster Management Observability service, three dashboards become available. View the following dashboard descriptions:
- Alert Analysis: Overview dashboard of the alerts being generated within the managed cluster fleet.
- Clusters by Alert: Alert dashboard where you can filter by the alert name.
- Alerts by Cluster: Alert dashboard where you can filter by cluster, and view real-time data for alerts that are initiated or pending within the cluster environment.
1.5.2.3. Viewing the etcd table
You can also view the etcd table from the hub cluster dashboard in Grafana to learn the stability of the etcd as a data store. Select the Grafana link from your hub cluster to view the etcd table data, which is collected from your hub cluster. The Leader election changes across managed clusters are displayed.
1.5.2.4. Viewing the Kubernetes API server dashboard
To see the total number of clusters that are exceeding or meeting the targeted service-level objective (SLO) value for the past seven or 30-day period, offending and non-offending clusters, and API Server Request Duration, use the following options to view the Kubernetes API server dashboards:
View the cluster fleet Kubernetes API service-level overview from the hub cluster dashboard in Grafana.
- Navigate to the Grafana dashboard.
- Access the managed dashboard menu by selecting Kubernetes > Service-Level Overview > API Server. The Fleet Overview and Top Cluster details are displayed.
View the Kubernetes API service-level overview table from the hub cluster dashboard in Grafana to see the error budget for the past seven or 30-day period, the remaining downtime, and trend.
- Navigate to the Grafana dashboard from your hub cluster.
- Access the managed dashboard menu by selecting Kubernetes > Service-Level Overview > API Server. The Fleet Overview and Top Cluster details are displayed.
1.5.3. Additional resources
- For more information, see Prometheus Remote-Write specification.
- See Managing user-owned OAuth access tokens.
- Read Enabling the Observability service.
- For more topics, see Observability service.
1.5.4. Using Grafana dashboards
Use Grafana dashboards to view hub cluster and managed cluster metrics. The data displayed in the Grafana alerts dashboard relies on alerts metrics, originating from managed clusters. The alerts metric does not affect managed clusters forwarding alerts to Red Hat Advanced Cluster Management alert manager on the hub cluster. Therefore, the metrics and alerts have distinct propagation mechanisms and follow separate code paths.
Even if you see data in the Grafana alerts dashboard, that does not guarantee that the managed cluster alerts are successfully forwarding to the Red Hat Advanced Cluster Management hub cluster alert manager. If the metrics are propagated from the managed clusters, you can view the data displayed in the Grafana alerts dashboard.
To use the Grafana dashboards for your development needs, complete the following:
1.5.4.1. Setting up the Grafana developer instance
You can design your Grafana dashboard by creating a grafana-dev instance. Be sure to use the most current grafana-dev instance.
Complete the following steps to set up the Grafana developer instance:
-
Clone the
open-cluster-management/multicluster-observability-operator/repository, so that you are able to run the scripts that are in thetoolsfolder. Run the
setup-grafana-dev.shto setup your Grafana instance. When you run the script the following resources are created:secret/grafana-dev-config,deployment.apps/grafana-dev,service/grafana-dev,ingress.extensions/grafana-dev,persistentvolumeclaim/grafana-dev:Copy to Clipboard Copied! Toggle word wrap Toggle overflow Switch the user role to Grafana administrator with the
switch-to-grafana-admin.shscript.-
Select the Grafana URL,
https:grafana-dev-open-cluster-management-observability.{OPENSHIFT_INGRESS_DOMAIN}, and log in. Then run the following command to add the switched user as Grafana administrator. For example, after you log in using
kubeadmin, run following command:./switch-to-grafana-admin.sh kube:admin User <kube:admin> switched to be grafana admin
./switch-to-grafana-admin.sh kube:admin User <kube:admin> switched to be grafana adminCopy to Clipboard Copied! Toggle word wrap Toggle overflow
-
Select the Grafana URL,
The Grafana developer instance is set up.
1.5.4.1.1. Verifying Grafana version
Verify the Grafana version from the command line interface (CLI) or from the Grafana user interface.
After you log in to your hub cluster, access the observabilty-grafana pod terminal. Run the following command:
grafana-cli
grafana-cliThe Grafana version that is currently deployed within the cluster environment is displayed.
Alternatively, you can navigate to the Manage tab in the Grafana dashboard. Scroll to the end of the page, where the version is listed.
1.5.4.2. Designing your Grafana dashboard
After you set up the Grafana instance, you can design the dashboard. Complete the following steps to refresh the Grafana console and design your dashboard:
- From the Grafana console, create a dashboard by selecting the Create icon from the navigation panel. Select Dashboard, and then click Add new panel.
- From the New Dashboard/Edit Panel view, navigate to the Query tab.
-
Configure your query by selecting
Observatoriumfrom the data source selector and enter a PromQL query. - From the Grafana dashboard header, click the Save icon that is in the dashboard header.
- Add a descriptive name and click Save.
1.5.4.2.1. Designing your Grafana dashboard with a ConfigMap
Design your Grafana dashboard with a ConfigMap. You can use the generate-dashboard-configmap-yaml.sh script to generate the dashboard ConfigMap, and to save the ConfigMap locally:
./generate-dashboard-configmap-yaml.sh "Your Dashboard Name"
Save dashboard <your-dashboard-name> to ./your-dashboard-name.yaml
./generate-dashboard-configmap-yaml.sh "Your Dashboard Name"
Save dashboard <your-dashboard-name> to ./your-dashboard-name.yamlIf you do not have permissions to run the previously mentioned script, complete the following steps:
- Select a dashboard and click the Dashboard settings icon.
- Click the JSON Model icon from the navigation panel.
-
Copy the dashboard JSON data and paste it in the
datasection. Modify the
nameand replace$your-dashboard-name. Enter a universally unique identifier (UUID) in theuidfield indata.$your-dashboard-name.json.$$your_dashboard_json. You can use a program such as uuidegen to create a UUID. Your ConfigMap might resemble the following file:Copy to Clipboard Copied! Toggle word wrap Toggle overflow Notes:
If your dashboard is created within the
grafana-devinstance, you can take the name of the dashboard and pass it as an argument in the script. For example, a dashboard named Demo Dashboard is created in thegrafana-devinstance. From the CLI, you can run the following script:./generate-dashboard-configmap-yaml.sh "Demo Dashboard"
./generate-dashboard-configmap-yaml.sh "Demo Dashboard"Copy to Clipboard Copied! Toggle word wrap Toggle overflow After running the script, you might receive the following message:
Save dashboard <demo-dashboard> to ./demo-dashboard.yaml
Save dashboard <demo-dashboard> to ./demo-dashboard.yamlCopy to Clipboard Copied! Toggle word wrap Toggle overflow If your dashboard is not in the General folder, you can specify the folder name in the
annotationssection of this ConfigMap:annotations: observability.open-cluster-management.io/dashboard-folder: Custom
annotations: observability.open-cluster-management.io/dashboard-folder: CustomCopy to Clipboard Copied! Toggle word wrap Toggle overflow After you complete your updates for the ConfigMap, you can install it to import the dashboard to the Grafana instance.
Verify that the YAML file is created by applying the YAML from the CLI or OpenShift Container Platform console. A ConfigMap within the open-cluster-management-observability namespace is created. Run the following command from the CLI:
oc apply -f demo-dashboard.yaml
oc apply -f demo-dashboard.yaml
From the OpenShift Container Platform console, create the ConfigMap using the demo-dashboard.yaml file. The dashboard is located in the Custom folder.
1.5.4.3. Uninstalling the Grafana developer instance
When you uninstall the instance, the related resources are also deleted. Run the following command:
1.5.4.4. Additional resources
- See Exporting metrics to external endpoints.
- See uuidegen for instructions to create a UUID.
- See Using managed cluster labels in Grafana for more details.
- Return to the beginning of the page Using Grafana dashboard.
- For topics, see the Observing environments introduction.
1.5.5. Using managed cluster labels in Grafana
Enable managed cluster labels to use them with Grafana dashboards. When observability is enabled in the hub cluster, the observability-managed-cluster-label-allowlist ConfigMap is created in the open-cluster-management-observability namespace. The ConfigMap contains a list of managed cluster labels maintained by the observabilty-rbac-query-proxy pod, to populate a list of label names to filter from within the ACM - Cluster Overview Grafana dashboard. By default, observability ignores a subset of labels in the observability-managed-cluster-label-allowlist ConfigMap.
When a cluster is imported into the managed cluster fleet or modified, the observability-rbac-query-proxy pod watches for any changes in reference to the managed cluster labels and automatically updates the observability-managed-cluster-label-allowlist ConfigMap to reflect the changes. The ConfigMap contains only unique label names, which are either included in the ignore_labels or labels list. Your observability-managed-cluster-label-allowlist ConfigMap might resemble the following YAML file:
+ <1> Any label that is listed in the ignore_labels keylist of the ConfigMap is removed from the drop-down filter on the ACM - Clusters Overview Grafana dashboard. <2> The labels that are enabled are displayed in the drop-down filter on the ACM - Clusters Overview Grafana dashboard. The values are from the acm_managed_cluster_labels metric, depending on the label key value that is selected.
Continue reading how to use managed cluster labels in Grafana:
1.5.5.1. Adding managed cluster labels
When you add a managed cluster label to the observability-managed-cluster-label-allowlist ConfigMap, the label becomes available as a filter option in Grafana. Add a unique label to the hub cluster, or managed cluster object that is associated with the managed cluster fleet. For example, if you add the label, department=finance to a managed cluster, the ConfigMap is updated and might resemble the following changes:
1.5.5.2. Enabling managed cluster labels
Enable a managed cluster label that is already disabled by removing the label from the ignore_labels list in the observability-managed-cluster-label-allowlist ConfigMap.
For example, enable the local-cluster and name labels. Your observability-managed-cluster-label-allowlist ConfigMap might resemble the following content:
The ConfigMap resyncs after 30 seconds to ensure that the cluster labels are updated. After you update the ConfigMap, check the observability-rbac-query-proxy pod logs in the open-cluster-management-observability namespace to verify where the label is listed. The following information might be displayed in the pod log:
enabled managedcluster labels: <label>
enabled managedcluster labels: <label>From the Grafana dashboard, verify that the label is listed as a value in the Label drop-down menu.
1.5.5.3. Disabling managed cluster labels
Exclude a managed cluster label from being listed in the Label drop-down filter. Add the label name to the ignore_labels list. For example, your YAML might resemble the following file if you add local-cluster and name back into the ignore_labels list:
Check the observability-rbac-query-proxy pod logs in the open-cluster-management-observability namespace to verify where the label is listed. The following information might be displayed in the pod log:
disabled managedcluster label: <label>
disabled managedcluster label: <label>1.5.5.4. Additional resources
- See Using Grafana dashboards.
- Return to the beginning of the page, Using managed cluster labels in Grafana.