Questo contenuto non è disponibile nella lingua selezionata.
2.3. Monitoring Performance in Virtual Machine Manager
2.3.1. Viewing a Performance Overview in Virtual Machine Manager
- In the Virtual Machine Manager main window, highlight the virtual machine that you want to view.
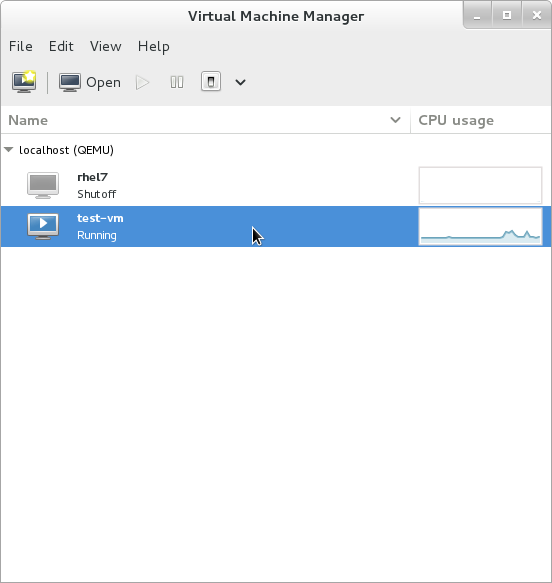
Figure 2.1. Selecting a virtual machine to display
- From the Virtual Machine Manager Edit menu, select Virtual Machine Details.When the Virtual Machine details window opens, there may be a console displayed. Should this happen, click View and then select Details. The Overview window opens first by default.
- Select Performance from the navigation pane on the left hand side.The Performance view shows a summary of guest performance, including CPU and Memory usage and Disk and Network input and output.
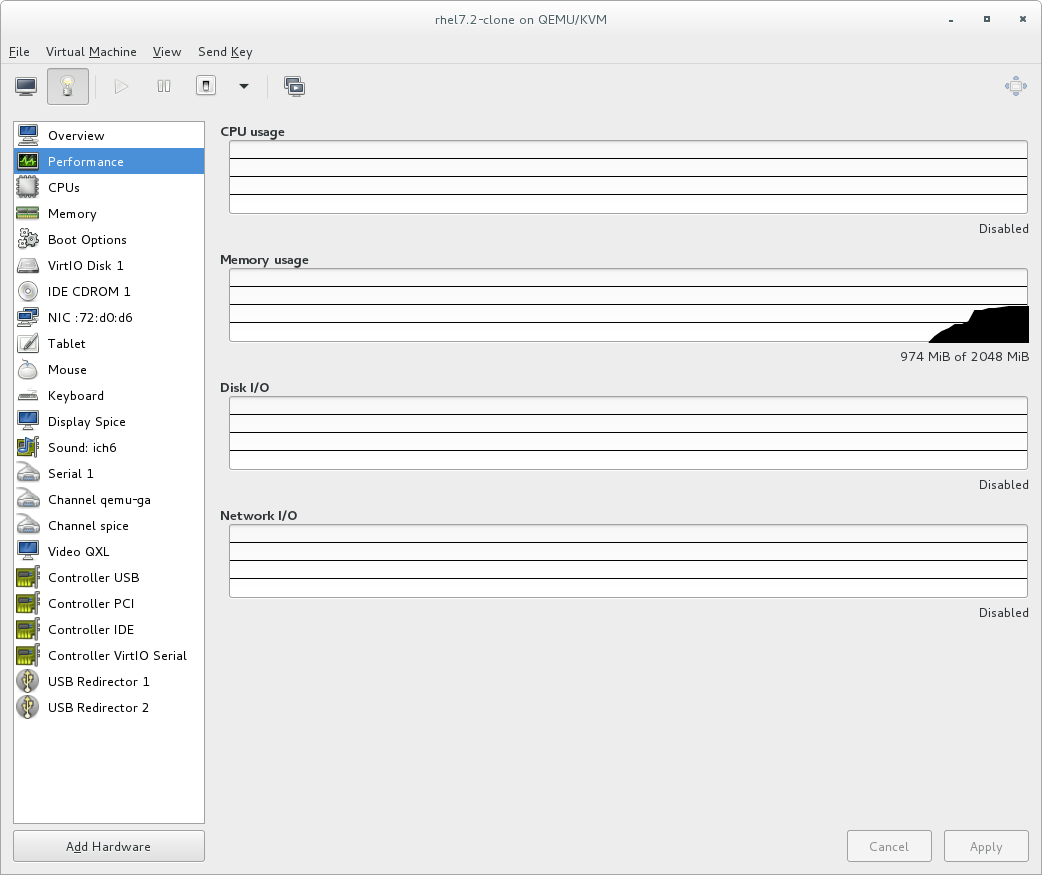
Figure 2.2. Displaying guest performance details
2.3.2. Performance Monitoring
virt-manager's preferences window.
- From the Edit menu, select Preferences.The Preferences window appears.
- From the Polling tab specify the time in seconds or stats polling options.

Figure 2.3. Configuring performance monitoring
2.3.3. Displaying CPU Usage for Guests
- From the View menu, select Graph, then the Guest CPU Usage check box.
- The Virtual Machine Manager shows a graph of CPU usage for all virtual machines on your system.

Figure 2.4. Guest CPU usage graph
2.3.4. Displaying CPU Usage for Hosts
- From the View menu, select Graph, then the Host CPU Usage check box.
- The Virtual Machine Manager shows a graph of host CPU usage on your system.
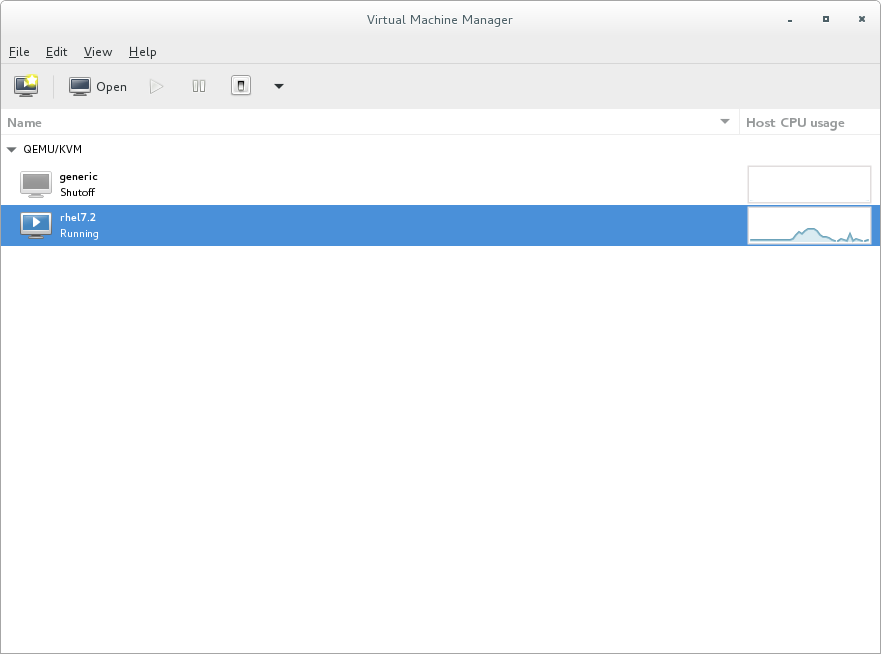
Figure 2.5. Host CPU usage graph
2.3.5. Displaying Disk I/O
- Make sure that the Disk I/O statistics collection is enabled. To do this, from the Edit menu, select Preferences and click the Polling tab.
- Select the Disk I/O check box.

Figure 2.6. Enabling Disk I/O
- To enable the Disk I/O display, from the View menu, select Graph, then the Disk I/O check box.
- The Virtual Machine Manager shows a graph of Disk I/O for all virtual machines on your system.
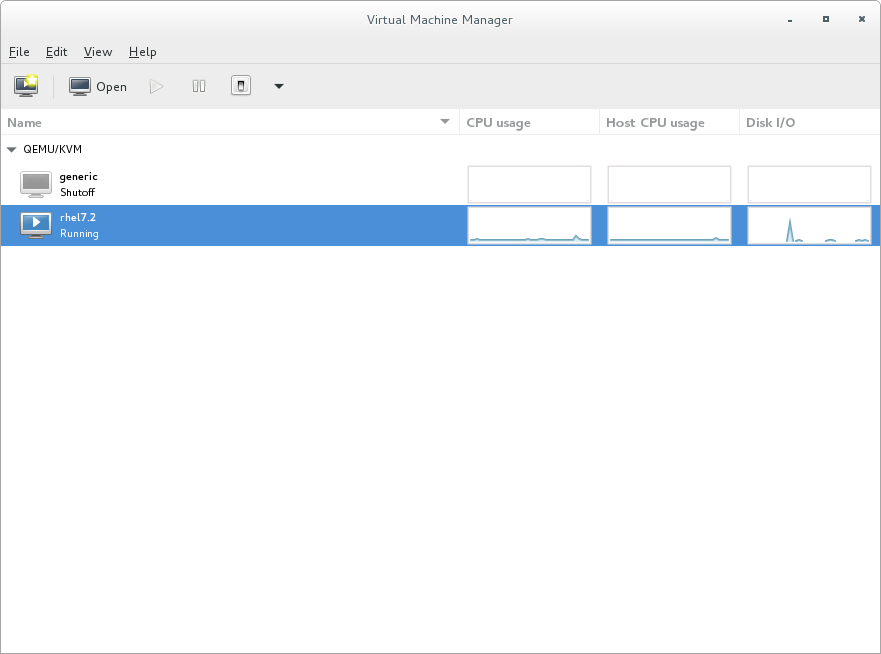
Figure 2.7. Displaying Disk I/O
2.3.6. Displaying Network I/O
- Make sure that the Network I/O statistics collection is enabled. To do this, from the Edit menu, select Preferences and click the Pollingtab.
- Select the Network I/O check box.
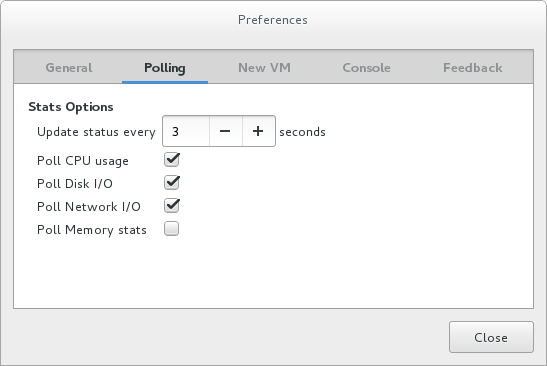
Figure 2.8. Enabling Network I/O
- To display the Network I/O statistics, from the View menu, select Graph, then the Network I/O check box.
- The Virtual Machine Manager shows a graph of Network I/O for all virtual machines on your system.

Figure 2.9. Displaying Network I/O
2.3.7. Displaying Memory Usage
- Make sure that the memory usage statistics collection is enabled. To do this, from the Edit menu, select Preferences and click the Pollingtab.
- Select the Poll Memory stats check box.
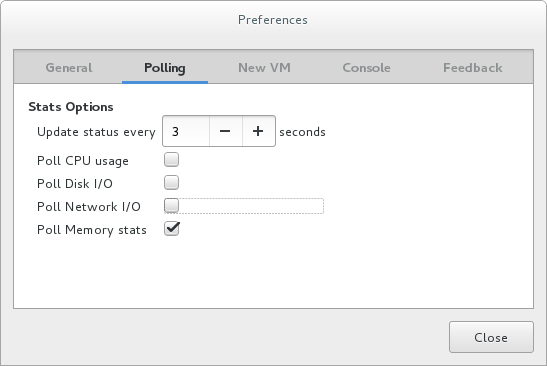
Figure 2.10. Enabling memory usage
- To display the memory usage, from the View menu, select Graph, then the Memory Usage check box.
- The Virtual Machine Manager lists the percentage of memory in use (in megabytes) for all virtual machines on your system.

Figure 2.11. Displaying memory usage