Questo contenuto non è disponibile nella lingua selezionata.
Chapter 15. Running the Camel Debugger
You can run the Camel debugger on locally running routing contexts and on remotely running routing contexts. The same basic features and functionality are available in both debugging modes.
-
Local debugging — Runs the debugger on the routing context running in the same JVM with Fuse Tooling. This mode is activated by selecting the project’s routing context in the Project Explorer view and selecting Debug As
Local Camel Context from the context menu. - Remote debugging — Runs the debugger on a routing context running in a separate JVM either on the local machine or on a remote machine. This mode requires a supported runtime server installed on the local machine or on an accessible remote machine. It is activated by creating and running a debug launch configuration that specifies the remote runtime’s connection details.
If your project contains Java code, you can use the standard Eclipse Java debugging tools to debug it. For local debugging, it is automatically available. For remote debugging, you need to use the Remote Camel Context and Java launch option (see Section 15.2, “Debugging a remotely running routing context”).
You must set breakpoints in your routing context file before you can start the Camel debugger.
15.1. Debugging a locally running routing context
Procedure
- In the Project Explorer view, select the routing context file you want to debug.
Right-click the selected file to open the context menu, and then select Debug As
Local Camel Context. Fuse Tooling builds the Camel route, starts Apache Camel, starts the routing context, enables JMX, starts the route(s) in the routing context, adds the breakpoints to the nodes, and enables the Camel debugger.
The Camel debugger suspends execution of the routing context at the first breakpoint hit (received a message), and prompts you to indicate whether you want it to open the Debug perspective.
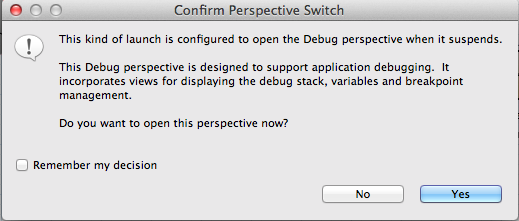
Click Yes to open the Debug perspective.
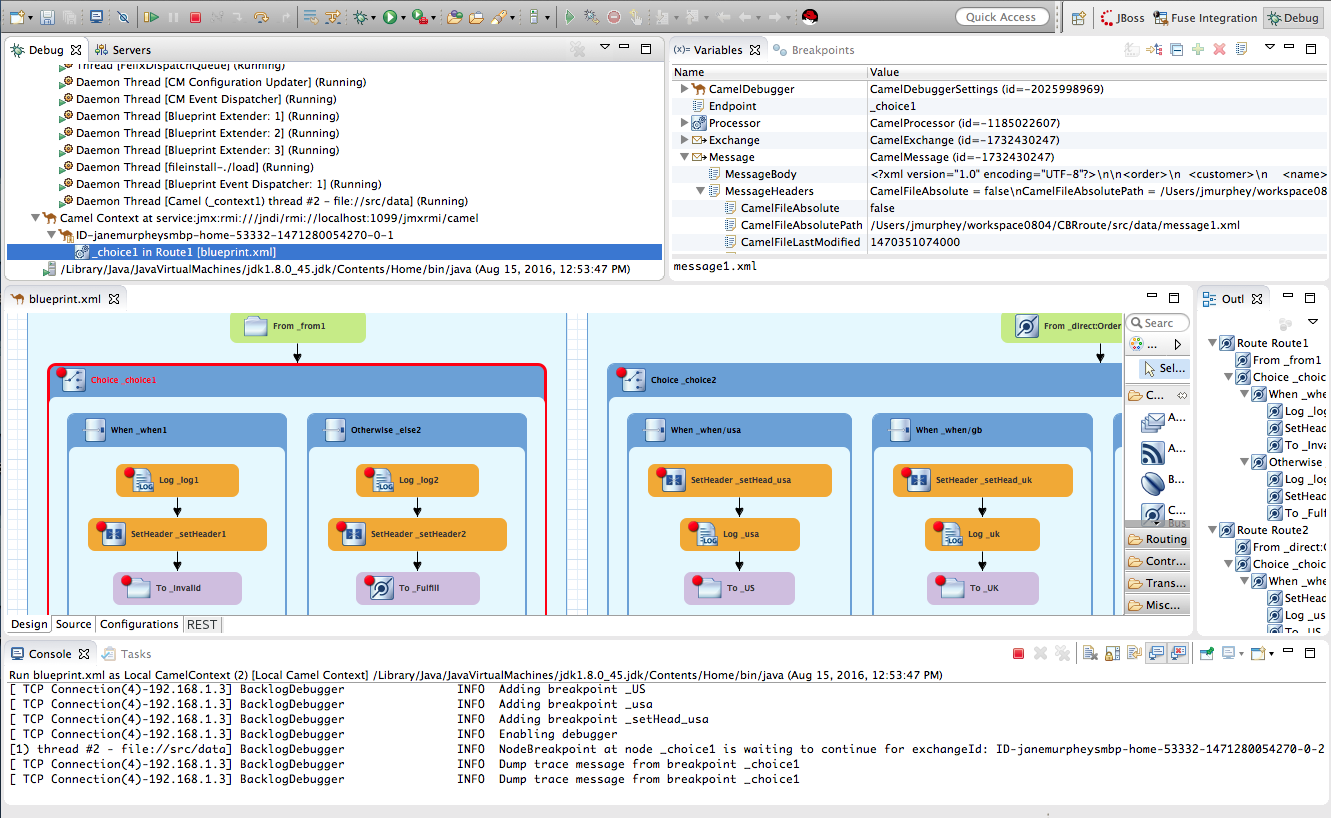
The Debug perspective opens with the routing context suspended at the first breakpoint encountered in the running routing context.
ImportantBreakpoints are held for a maximum of five minutes, after which debugging automatically resumes, moving on to the next breakpoint or to the end of the routing context.
 Note
NoteTo see the console output, open the Console view if it was not open when you switched perspectives.
NoteBy default, the Debug perspective displays the Outline view, which provides the means to switch between separate routes in a running routing context. If your routing context contains a single route, closing the Outline view frees space to expand the other views, making it easier to access and examine debugger output.
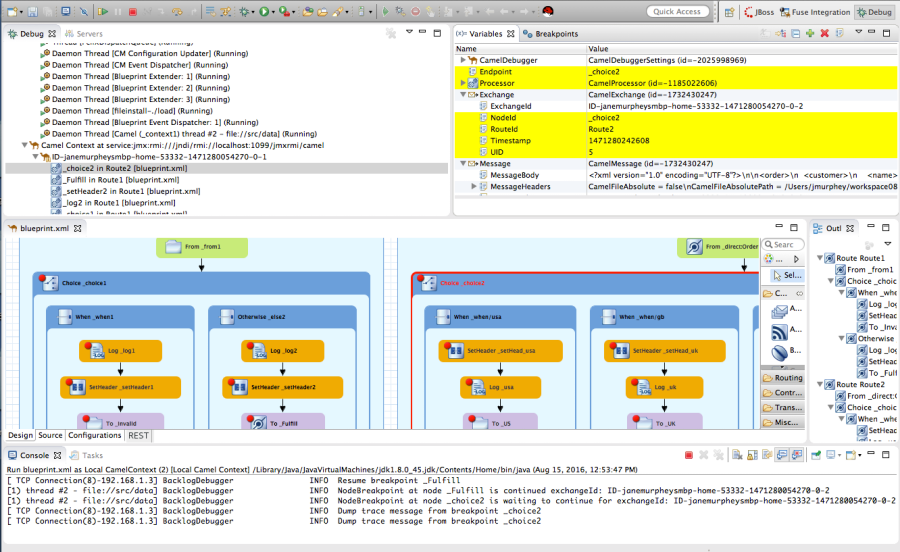
Watching message exchanges progress through the routing context
Click
 (Step Over) to jump to the next node of execution in the routing context. Click
 (Resume) to continue execution at the next active breakpoint in the routing context.
15.2. Debugging a remotely running routing context
Fuse servers deployed on a remote host cannot be registered in the Servers view of CodeReady Studio. Consequently, you cannot start, automatically redeploy, or stop remote Fuse servers from within CodeReady Studio. Instead, you must start Fuse in debug mode outside of CodeReady Studio.
Prerequisites
Access to a Fuse runtime in one of the following ways:
-
Install a Fuse server on your local machine and edit its
Fuse_HOME/etc/users.propertiesfile to activate theadminuser. For details, see Section 28.1, “Adding a Server”. -
Be able to access a Fuse server that is installed on a remote machine. You must know its connection details, including the credentials of the
adminuser.
-
Install a Fuse server on your local machine and edit its
Create a new Fuse Integration project, see the section called “Specifying the project name and workspace”. In the Fuse Integration project:
- Select the Camel version that matches the version of the Fuse server runtime.
Create an empty Blueprint DSL project or use one of the Fuse pre-defined templates with Blueprint DSL.
NoteThough not a requirement, it is a good idea to verify that you can run the project’s routing context successfully as a
Local Camel Context. For details, see Section 6.1, “Running routes as a local Camel context”.NoteThe examples in the section called “Setting up and starting remote debugging” are based on the Fuse
Content Based Router pre-defined template and a Red Hat Fuse 6.3.0 runtime.
In Red Hat CodeReady Studio:
- Add the Fuse server to the Servers view. For details, see Section 28.1, “Adding a Server”.
- Start the Fuse server. For details, see Section 28.2, “Starting a Server”.
- Publish your project to the Fuse Runtime server. For details, see the section called “Publishing Fuse projects automatically when resources change”.
- Verify that the project’s bundle is deployed and active. For details, see the section called “Verifying the project was published to the server”.
- Stop the Fuse Runtime server. For details, see Section 28.5, “Stopping a Server”.
Setting up and starting remote debugging
With the project deployed on Fuse and the server stopped, you need to set up and start remote debugging as follows:
Start Fuse in debug mode outside of Red Hat CodeReady Studio.
Fuse servers deployed on a remote host cannot be registered in the Servers view of CodeReady Studio, therefore you must start Fuse in debug mode outside of CodeReady Studio.
- In CodeReady Studio, set breakpoints on nodes in the project’s routing context, which is open in the route editor.
- Create a remote Camel context debug configuration and run it.
- Connect to Fuse runtime in the JMX Navigator view.
- Drop test messages in the JMX Navigator view on the input node of the Camel route running inside the Fuse runtime.
- Use any of the Camel debugger’s tools for debugging routes.
Procedure
To set up and start remote debugging:
Open a terminal outside of Red Hat CodeReady Studio, and enter
$ [FUSE_HOME]/bin/fuse debug- Wait for the Fuse splash screen to appear, and then return to the Fuse Integration perspective in CodeReady Studio.
- In the tooling’s route editor, with the project’s routing context open in the Design tab, set breakpoints on the nodes of interest. For details, see Chapter 14, Setting Breakpoints.
In the Project Explorer view, right-click the project’s root and select Debug As
Debug Configurations to open the Debug Configurations wizard: 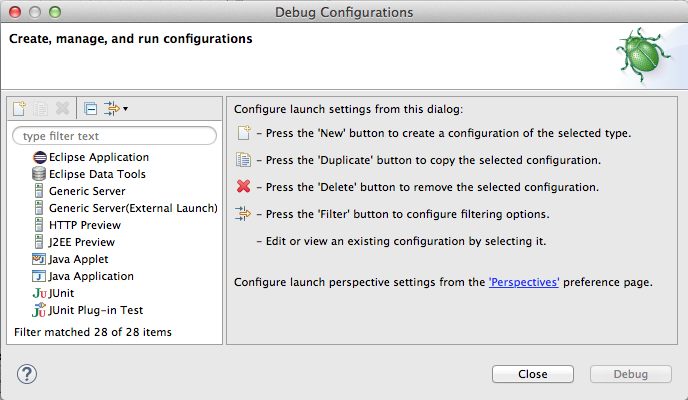
In the configuration type pane, select either Remote Camel Context or Remote Camel Context and Java , and then click
 :
:
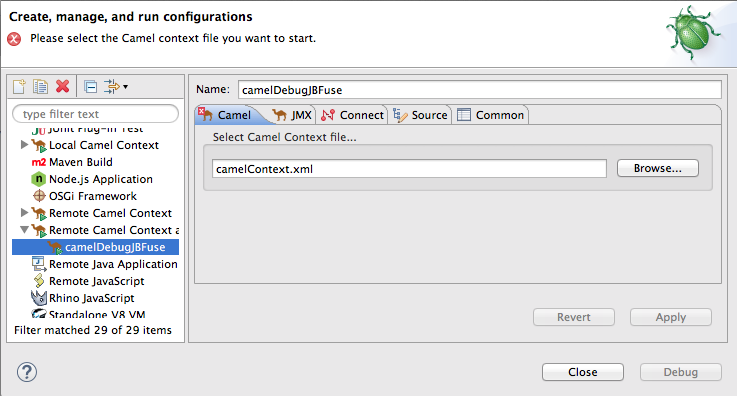
For both the Remote Camel Context and Remote Camel Context and Java options, you need to specify configuration details on the Camel and JMX tabs.
For the Remote Camel Context and Java option only, you also need to specify configuration details on the Connect tab.
NoteUnless your project contains Java code that you want to debug using the standard Eclipse Java debugging tools, select the Remote Camel Context option.
- In the Name field, enter a name for the new launch configuration.
On the Camel tab, click the Browse button to locate the project’s routing context
.xmlfile in the Open Resources dialog: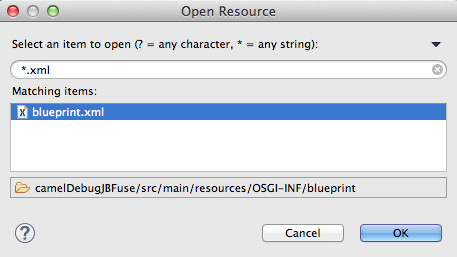 Note
NoteWhen you select a file in the Matching items pane, the tooling displays the file’s location, relative to the project root, at the bottom of the pane.
In the Matching items pane, select your project’s routing context file from the list, and then click OK.
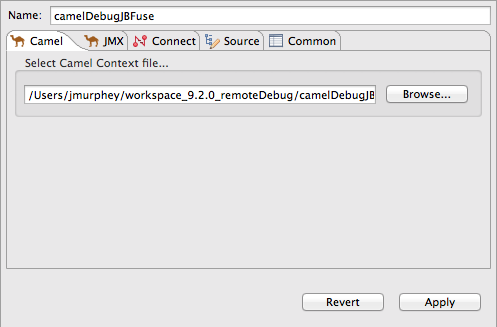
The tooling inserts the file’s path into the Select Camel Context file field:
Click the JMX tab:
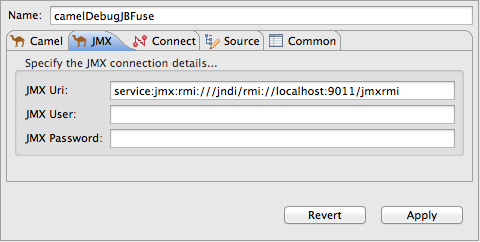
Edit the JMX connection details as follows:
JMX Uri — change
:9011/jmxrmito:1099/karaf-rootIf the Fuse server is running on a remote host, replace
localhostwith the DNS name or IP address of the remote host.-
JMX User — enter
admin. JMX Password — enter
admin.ImportantThe values shown for JMX User and JMX Password are the Fuse admin user defaults, stored in the
Fuse_HOME/etc/users.propertiesfile. If your setup is different, enter the values specific to it.If you are creating a Remote Camel Context debug launch configuration, you are done. Skip to [debugCfgGo].
Click the Connect tab:
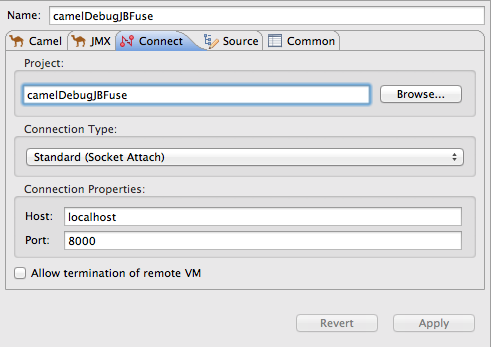
Change the Port value from
8000to5005. Leave each of the other properties as is.- Click Apply and then click Debug.
- In the JMX Navigator view, double-click Fuse [xxx] [Disconnected] to connect to it, and then expand its tree.
In the Project Explorer view, drag a test message from
src/test/resources/dataand drop it on thecbr-example-context/Endpoints/file/work/cbr/inputfolder in the JMX Navigator view.When the message hits the first breakpoint that is set in the routing context, the tooling asks you to switch to the Debug perspective:

Click Yes.
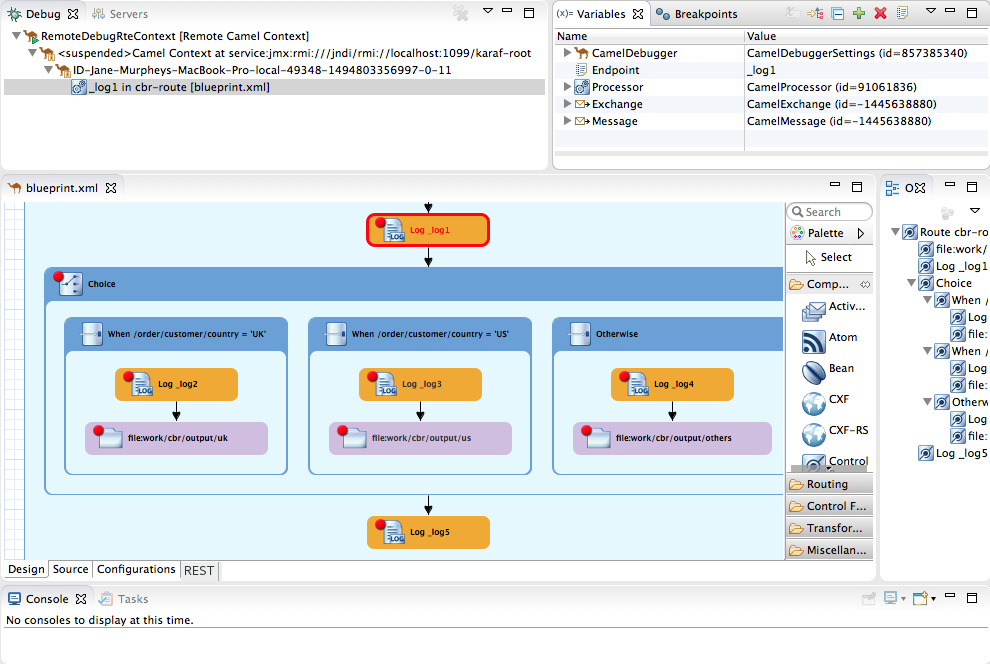
At this point, you can use any of the Camel debugger’s tools to debug your routing context.
NoteIn remote debugging sessions, the Console view does not display log output.
NoteWhen one message reaches the end of the routing context, the debugger is suspended. To continue debugging, switch back to the Fuse Integration perspective and drop another message on the input node in the JMX Navigator view. Each time you do so, the tooling asks you to confirm the switch to the Debug perspective.