Questo contenuto non è disponibile nella lingua selezionata.
Chapter 2. Viewing pipeline logs using the OpenShift Logging Operator
The logs generated by pipeline runs, task runs, and event listeners are stored in their respective pods. It is useful to review and analyze logs for troubleshooting and audits.
However, retaining the pods indefinitely leads to unnecessary resource consumption and cluttered namespaces.
To eliminate any dependency on the pods for viewing pipeline logs, you can use the OpenShift Elasticsearch Operator and the OpenShift Logging Operator. These Operators help you to view pipeline logs by using the Elasticsearch Kibana stack, even after you have deleted the pods that contained the logs.
2.1. Prerequisites
Before trying to view pipeline logs in a Kibana dashboard, ensure the following:
- The steps are performed by a cluster administrator.
- Logs for pipeline runs and task runs are available.
- The OpenShift Elasticsearch Operator and the OpenShift Logging Operator are installed.
2.2. Viewing pipeline logs in Kibana
To view pipeline logs in the Kibana web console:
Procedure
- Log in to OpenShift Container Platform web console as a cluster administrator.
-
In the top right of the menu bar, click the grid icon
Observability Logging. The Kibana web console is displayed. Create an index pattern:
- On the left navigation panel of the Kibana web console, click Management.
- Click Create index pattern.
-
Under Step 1 of 2: Define index pattern
Index pattern, enter a *pattern and click Next Step. -
Under Step 2 of 2: Configure settings
Time filter field name, select @timestamp from the drop-down menu, and click Create index pattern.
Add a filter:
- On the left navigation panel of the Kibana web console, click Discover.
Click Add a filter +
Edit Query DSL. Note- For each of the example filters that follows, edit the query and click Save.
- The filters are applied one after another.
Filter the containers related to pipelines:
Example query to filter pipelines containers
{
  "query": {
	"match": {
  	"kubernetes.flat_labels": {
    	"query": "app_kubernetes_io/managed-by=tekton-pipelines",
    	"type": "phrase"
  	}
	}
  }
}
Filter all containers that are not
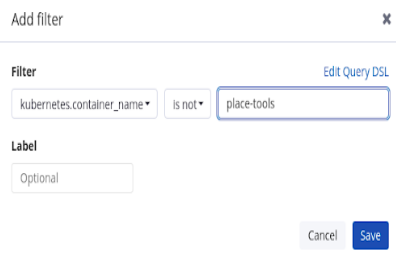
place-toolscontainer. As an illustration of using the graphical drop-down menus instead of editing the query DSL, consider the following approach:Figure 2.1. Example of filtering using the drop-down fields

Filter
pipelinerunin labels for highlighting:Example query to filter
pipelinerunin labels for highlighting{ "query": { "match": { "kubernetes.flat_labels": { "query": "tekton_dev/pipelineRun=", "type": "phrase" } } } }Filter
pipelinein labels for highlighting:Example query to filter
pipelinein labels for highlighting{ "query": { "match": { "kubernetes.flat_labels": { "query": "tekton_dev/pipeline=", "type": "phrase" } } } }
From the Available fields list, select the following fields:
-
kubernetes.flat_labels messageEnsure that the selected fields are displayed under the Selected fields list.
-
The logs are displayed under the message field.
Figure 2.2. Filtered messages
