Questo contenuto non è disponibile nella lingua selezionata.
Chapter 2. Setting up OpenShift Pipelines in the web console to view Software Supply Chain Security elements
Use the Developer or Administrator perspective to create or modify a pipeline and view key Software Supply Chain Security elements within a project.
Set up OpenShift Pipelines to view:
- Project vulnerabilities: Visual representation of identified vulnerabilities within a project.
- Software Bill of Materials (SBOMs): Download or view detailed listing of PipelineRun components.
Additionally, PipelineRuns that meet Tekton Chains requirement displays signed badges next to their names. This badge indicates that the pipeline run execution results are cryptographically signed and stored securely, for example within an OCI image.
Figure 2.1. The signed badge

The PipelineRun displays the signed badge next to its name only if you have configured Tekton Chains. For information on configuring Tekton Chains, see Using Tekton Chains for OpenShift Pipelines supply chain security.
2.1. Setting up OpenShift Pipelines to view project vulnerabilities
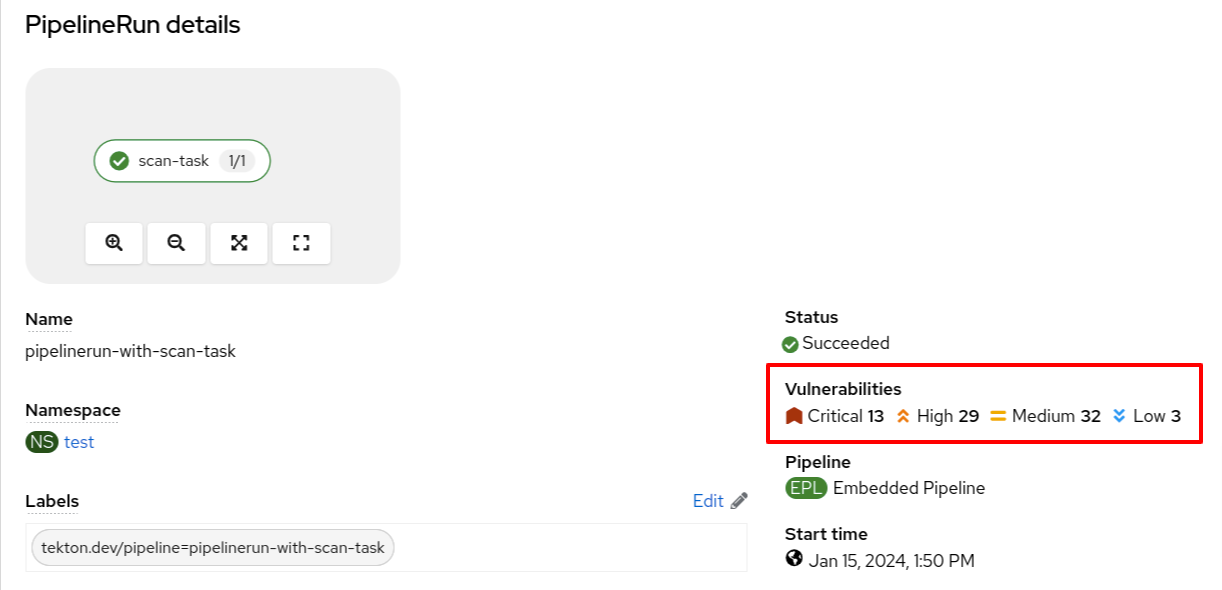
The PipelineRun details page provides a visual representation of identified vulnerabilities, categorized by the severity (critical, high, medium, and low). This streamlined view facilitates prioritization and remediation efforts.
Figure 2.2. Viewing vulnerabilities on the PipelineRun details page

You can also review the vulnerabilities in the Vulnerabilities column in the pipeline run list view page.
Figure 2.3. Viewing vulnerabilities on the PipelineRun list view

Visual representation of identified vulnerabilities is available starting from the OpenShift Container Platform version 4.15 release.
Prerequisites
- You have logged in to the web console.
- You have the appropriate roles and permissions in a project to create applications and other workloads in OpenShift Container Platform.
- You have an existing vulnerability scan task.
Procedures
- In the Developer or Administrator perspective, switch to the relevant project where you want a visual representation of vulnerabilities.
Update your existing vulnerability scan task to ensure that it stores the output in the .json file and then extracts the vulnerability summary in the following format:
# The format to extract vulnerability summary (adjust the jq command for different JSON structures). jq -rce \ '{vulnerabilities:{ critical: (.result.summary.CRITICAL), high: (.result.summary.IMPORTANT), medium: (.result.summary.MODERATE), low: (.result.summary.LOW) }}' scan_output.json | tee $(results.SCAN_OUTPUT.path)NoteYou might need to adjust the jq command for different JSON structures.
(Optional) If you do not have a vulnerability scan task, create one in the following format:
Example vulnerability scan task using Roxctl
apiVersion: tekton.dev/v1
kind: Task
metadata:
  name: vulnerability-scan
1 annotations: task.output.location: results2 task.results.format: application/json task.results.key: SCAN_OUTPUT3 spec: params: - description: Image to be scanned name: image type: string results: - description: CVE result format4 name: SCAN_OUTPUT steps: - name: roxctl image: 'quay.io/lrangine/crda-maven:11.0'5 env: - name: ROX_CENTRAL_ENDPOINT valueFrom: secretKeyRef: key: rox_central_endpoint6 name: roxsecrets - name: ROX_API_TOKEN valueFrom: secretKeyRef: key: rox_api_token7 name: roxsecrets name: roxctl-scan script: |8 #!/bin/sh curl -k -L -H "Authorization: Bearer $ROX_API_TOKEN" https://$ROX_CENTRAL_ENDPOINT/api/cli/download/roxctl-linux --output ./roxctl chmod +x ./roxctl ./roxctl image scan --insecure-skip-tls-verify -e $ROX_CENTRAL_ENDPOINT --image $(params.image) --output json > roxctl_output.json jq -rce \ "{vulnerabilities:{ critical: (.result.summary.CRITICAL), high: (.result.summary.IMPORTANT), medium: (.result.summary.MODERATE), low: (.result.summary.LOW) }}" roxctl_output.json | tee $(results.SCAN_OUTPUT.path)- 1
- The name of your task.
- 2
- The location for storing the task outputs.
- 3
- The naming convention of the scan task result. A valid naming convention must end with the
SCAN_OUTPUTstring. For example, SCAN_OUTPUT, MY_CUSTOM_SCAN_OUTPUT, or ACS_SCAN_OUTPUT. - 4
- The description of the result.
- 5
- The location of the container image to run the scan tool.
- 6
- The
rox_central_endpointkey obtained from Advanced Cluster Security for Kubernetes (ACS). - 7
- The
rox_api_tokenobtained from ACS. - 8
- The shell script performs the vulnerability scanning and sets the scan output in the Task run results.
NoteThis is an example configuration. Modify the values according to your specific scanning tool to set results in the expected format.
Update an appropriate Pipeline to add vulnerabilities specifications in the following format:
...
spec:
  results:
    - description: The common vulnerabilities and exposures (CVE) result
      name: SCAN_OUTPUT
      value: $(tasks.vulnerability-scan.results.SCAN_OUTPUT)
Verification
-
Navigate to the
PipelineRundetails page and review the Vulnerabilities row for a visual representation of identified vulnerabilities. -
Alternatively, you can navigate to the
PipelineRunlist view page, and review the Vulnerabilities column.
2.2. Setting up OpenShift Pipelines to download or view SBOMs
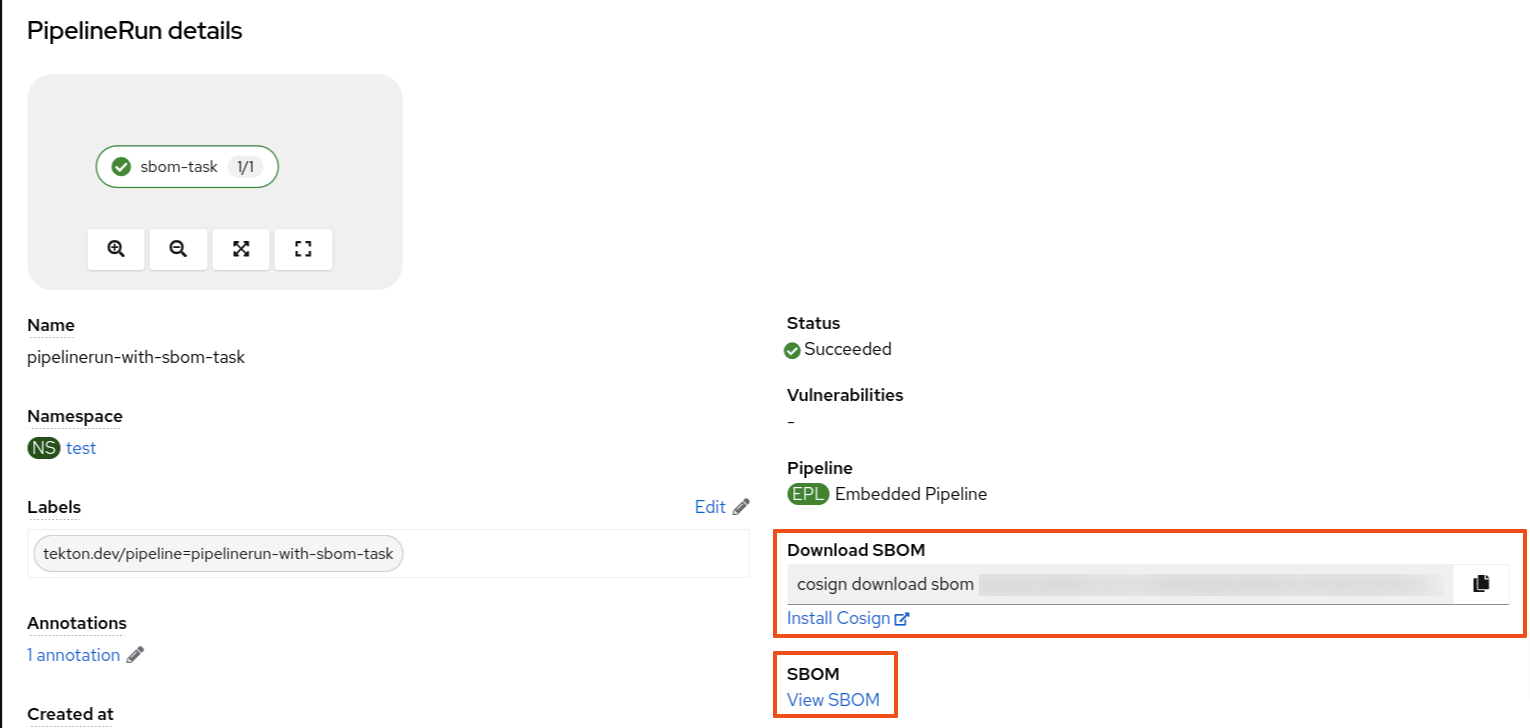
The PipelineRun details page provides an option to download or view Software Bill of Materials (SBOMs), enhancing transparency and control within your supply chain. SBOMs lists all the software libraries that a component uses. Those libraries can enable specific functionality or facilitate development.
You can use an SBOM to better understand the composition of your software, identify vulnerabilities, and assess the potential impact of any security issues that might arise.
Figure 2.4. Options to download or view SBOMs

Prerequisites
- You have logged in to the web console.
- You have the appropriate roles and permissions in a project to create applications and other workloads in OpenShift Container Platform.
Procedure
- In the Developer or Administrator perspective, switch to the relevant project where you want a visual representation of SBOMs.
Add a task in the following format to view or download the SBOM information:
Example SBOM task
apiVersion: tekton.dev/v1
kind: Task
metadata:
  name: sbom-task
1 annotations: task.output.location: results2 task.results.format: application/text task.results.key: LINK_TO_SBOM3 task.results.type: external-link4 spec: results: - description: Contains the SBOM link5 name: LINK_TO_SBOM steps: - name: print-sbom-results image: quay.io/image6 script: |7 #!/bin/sh syft version syft quay.io/<username>/quarkus-demo:v2 --output cyclonedx-json=sbom-image.json echo 'BEGIN SBOM' cat sbom-image.json echo 'END SBOM' echo 'quay.io/user/workloads/<namespace>/node-express/node-express:build-8e536-1692702836' | tee $(results.LINK_TO_SBOM.path)8 - 1
- The name of your task.
- 2
- The location for storing the task outputs.
- 3
- The SBOM task result name. Do not change the name of the SBOM result task.
- 4
- (Optional) Set to open the SBOM in a new tab.
- 5
- The description of the result.
- 6
- The image that generates the SBOM.
- 7
- The script that generates the SBOM image.
- 8
- The SBOM image along with the path name.
Update the Pipeline to reference the newly created SBOM task.
...
spec:
  tasks:
    - name: sbom-task
      taskRef:
        name: sbom-task
1 results: - name: IMAGE_URL2 description: url value: <oci_image_registry_url>3 - Rerun the affected OpenShift Pipeline.
2.2.1. Viewing an SBOM in the web UI
Prerequisites
- You have set up OpenShift Pipelines to download or view SBOMs.
Procedure
-
Navigate to the Activity
PipelineRuns tab. - For the project whose SBOM you want to view, select its most recent pipeline run.
On the
PipelineRundetails page, select View SBOM.-
You can use your web browser to immediately search the SBOM for terms that indicate vulnerabilities in your software supply chain. For example, try searching for
log4j. - You can select Download to download the SBOM, or Expand to view it full-screen.
-
You can use your web browser to immediately search the SBOM for terms that indicate vulnerabilities in your software supply chain. For example, try searching for
2.2.2. Downloading an SBOM in the CLI
Prerequisites
- You have installed the Cosign CLI tool. For information about installing the Cosign tool, see the Sigstore documentation for Cosign.
- You have set up OpenShift Pipelines to download or view SBOMs.
Procedure
- Open terminal, log in to Developer or Administrator perspective, and then switch to the relevant project.
From the OpenShift web console, copy the
download sbomcommand and run it on your terminal.Example cosign command
$ cosign download sbom quay.io/<workspace>/user-workload@sha256(Optional) To view the full SBOM in a searchable format, run the following command to redirect the output:
Example cosign command
$ cosign download sbom quay.io/<workspace>/user-workload@sha256 > sbom.txt
2.2.3. Reading the SBOM
In the SBOM, as the following sample excerpt shows, you can see four characteristics of each library that a project uses:
- Its author or publisher
- Its name
- Its version
- Its licenses
This information helps you verify that individual libraries are safely-sourced, updated, and compliant.
Example SBOM
{
    "bomFormat": "CycloneDX",
    "specVersion": "1.4",
    "serialNumber": "urn:uuid:89146fc4-342f-496b-9cc9-07a6a1554220",
    "version": 1,
    "metadata": {
        ...
    },
    "components": [
        {
            "bom-ref": "pkg:pypi/flask@2.1.0?package-id=d6ad7ed5aac04a8",
            "type": "library",
            "author": "Armin Ronacher <armin.ronacher@active-4.com>",
            "name": "Flask",
            "version": "2.1.0",
            "licenses": [
                {
                    "license": {
                        "id": "BSD-3-Clause"
                    }
                }
            ],
            "cpe": "cpe:2.3:a:armin-ronacher:python-Flask:2.1.0:*:*:*:*:*:*:*",
            "purl": "pkg:pypi/Flask@2.1.0",
            "properties": [
                {
                    "name": "syft:package:foundBy",
                    "value": "python-package-cataloger"
                    ...