このコンテンツは選択した言語では利用できません。
Chapter 5. Rules
5.1. DSL
リンクのコピーリンクがクリップボードにコピーされました!
A domain-specific language (DSL) is a set of custom rules, that is created specifically to solve problems in a particular domain and is not intended to be able to solve problems outside it. A DSL's configuration is stored in plain text.
5.2. DSL Editor
リンクのコピーリンクがクリップボードにコピーされました!
- In JBoss Rules, the DSL configuration is stored in
.dslfiles. These can be created selectingfrom the projects context menu. 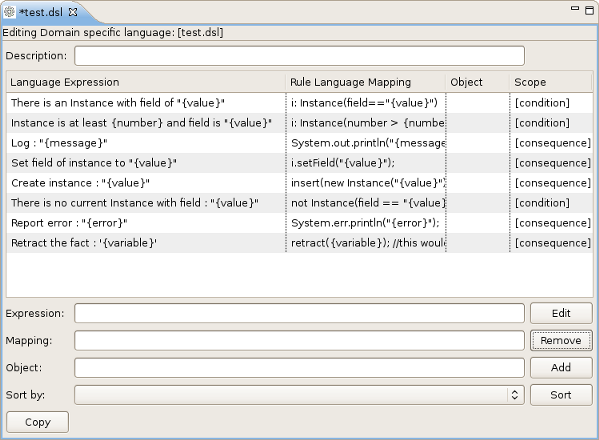
Figure 5.1. The DSL editor
5.3. DSL Editor Components
リンクのコピーリンクがクリップボードにコピーされました!
| Components | Description |
|---|---|
| Description | User's comments on a certain language message mapping. |
| Table of language message mappings | The table is divided into 4 rows:
|
| Expression | Shows the language expression of the selected table line (language message mapping). |
| Mapping | Shows the rule of language mapping for the selected table line (language message mapping). |
| Object | Shows the object for the selected table line (language message mapping). |
| Sort By | This option allows you to change the sorting order of the language message mappings. To do this select from the drop down list the method of sorting you want and click the button. |
| Buttons |
|
5.4. Add a Language Mapping Wizard
リンクのコピーリンクがクリップボードにコピーされました!
By adding this wizard, you can create language message maps. These allow you to control message flows. They can then be configured in JBoss Developer Studio.
Procedure 5.1. Task
- Click the button and a dialog box appears.
- Enter the details of your language mapping wizard into the relevant fields.
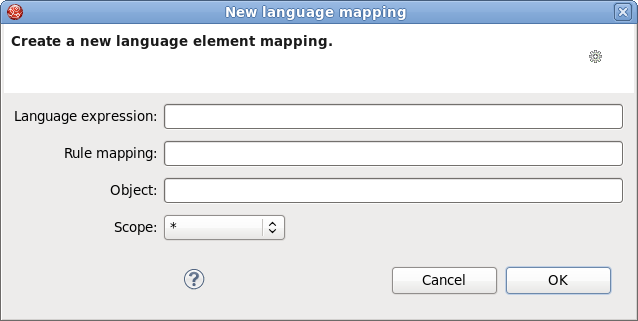
Figure 5.2. Dialog box
5.5. Edit the Language Mapping Wizard
リンクのコピーリンクがクリップボードにコピーされました!
You can configure different fields in the Language Mapping Wizard to suit your needs. Any language message mapping can be modified through this process. You can edit the language expressions, rule mapping, objects and scopes of the instance.
- This wizard can be opened by double-clicking a line in the table of language message mappings or by clicking the button.
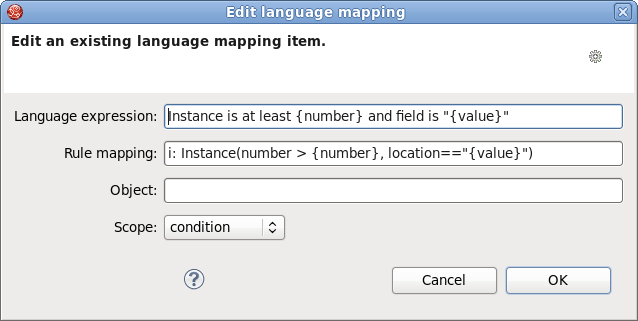
Figure 5.3. Editing options
- To change the mapping, edit the appropriate options and click the button.
5.6. JBoss Rules Flow Editor
リンクのコピーリンクがクリップボードにコピーされました!
- Ruleflows can only be set by using the graphical flow editor which is part of the JBoss Rules plug-in for JBoss Developer Studio. Once you have set up a JBoss Rules project, you can start adding ruleflows. Add a ruleflow file (.rf) by clicking on the project and selecting
. By default these ruleflow files (.rf) are opened in the graphical Flow editor. - The Flow editor consists of a palette, a canvas and an outline view. Select the element you would like to create in the palette and then add it to the canvas by clicking on the preferred location.
- Clicking on the Select option in the palette and then on the element in your ruleflow allows you to view and set the properties of that element in the Properties view.
- The Outline view is useful for complex schemata where not all nodes are seen at one time. Using the Outline view allows you to easily navigate between parts of a schema.
5.7. Different Types of Control Elements in Flow Palette
リンクのコピーリンクがクリップボードにコピーされました!
| Icon | Name | Description |
|---|---|---|

| Select | Select a node on the canvas. |

| Marquee | Selects a group of elements. |

| Sequence flow | Joins two elements on the canvas |
5.8. Different Types of Nodes in Flow Palette
リンクのコピーリンクがクリップボードにコピーされました!
| Icon | Name | Description |
|---|---|---|

| Start Event | The start of the ruleflow. There can only have one start node. The Start Event cannot have incoming connections and should have one outgoing connection. Whenever the ruleflow process is started, the execution is started here and is automatically forwarded to the first node linked to this Start Event. |

| End Event | A ruleflow file can have multiple End Events. This node should have one incoming connection and no outgoing connections. When an end node is reached in the ruleflow, the ruleflow is terminated (including other remaining active nodes when parallelism is used). |

| Rule Task | Represents a set of rules. A Rule Task node should have one incoming connection and one outgoing connection. The RuleFlowGroup property is used to specify the name of the ruleflow-group representing the set of rules. When a Rule Task node is reached in the ruleflow, the engine starts executing rules that are part of the corresponding ruleflow-group. Execution automatically continues to the next node when there are no more active rules in this ruleflow-group. |

| Gateway[diverge] | Allows you to create branches in your ruleflow. A Gateway[diverge] node should have one incoming connection and two or more outgoing connections. |
|
| Gateway[converge] | Allows you to synchronize multiple branches. A Gateway[converge] node should have two or more incoming connections and one outgoing connection. |

| Reusable Sub-Process | Represents the invocation of another ruleflow from this ruleflow. A subflow node should have one incoming connection and one outgoing connection. It contains the property processId which specifies the ID of the process that should be executed. When a Reusable Sub-Process node is reached in the ruleflow, the engine starts the process with the given ID. The subflow node continues only if the other subflow process has terminated its execution. The subflow process is started as an independent process, which means that the subflow process is not terminated if this process reaches an end node. |

| Script Task | Represents an action that should be executed in this ruleflow. A Script Task node should have one incoming connection and one outgoing connection. It contains the property "action" which specifies the action that should be executed. When a Script Task node is reached in the ruleflow, it executes the action and continue with the next node. An action should be specified as a piece of (valid) MVEL code. |
5.9. Rule Editor
リンクのコピーリンクがクリップボードにコピーされました!
The Rule editor works on files that have a
.drl (or .rule in the case of spreading rules across multiple rule files) extension. The editor follows the pattern of a normal text editor in JBoss Developer Studio, with all the normal features of a text editor.
5.10. Content Assist
リンクのコピーリンクがクリップボードにコピーされました!
While working in the Rule editor you can get a content assistance the usual way by pressing
Ctrl+Space. Content Assist shows all possible keywords for the current cursor position. It also suggests all available fields in a message.
5.11. Code Folding
リンクのコピーリンクがクリップボードにコピーされました!
Code Folding is used in the rule editor. It allows you to hide and show sections of a file use the icons with minus and plus on the left vertical line of the editor.
5.12. Synchronization with Outline View
リンクのコピーリンクがクリップボードにコピーされました!
The Rule editor works in synchronization with the Outline view which shows the structure of rules, imports objects into the file and also performs file functions. The view is updated on save. It provides a quick way of navigating around rules by names in a file which may have hundreds of rules. The items are sorted alphabetically by default.
5.13. Rete Tree View
リンクのコピーリンクがクリップボードにコピーされました!
The Rete Tree view shows you the current Rete Network for your
.drl file. Just click on the Rete Tree tab at the bottom of the Rule editor. Afterwards you can generate the current Rete Network visualization. You can push and pull the nodes to arrange your optimal network overview.
If you have a large number of nodes, you can select some of them with a frame and pull them together. You can zoom in and out the Rete tree in case not all nodes are shown in the current view. For this use the combobox or + and - icons on the toolbar.
Note
The Rete Tree view works only in JBoss Rules Rule Projects, where the JBoss Rules Builder is set in the project properties.
5.14. Breakpoints
リンクのコピーリンクがクリップボードにコピーされました!
Whenever the execution of rules runs into a breakpoint, the execution is halted. Once the execution stops, you can inspect the variables known at that point and use any of the default debugging actions to decide what should happen next (step over, continue, etc). The Debug view can be used to inspect the content of the working memory and agenda.
5.15. Creating Breakpoints
リンクのコピーリンクがクリップボードにコピーされました!
Create breakpoints to help monitor rules that have been executed. Instead of waiting for the result to appear at the end of the process, you can inspect the details of the execution at each breakpoint you set. This is useful for debugging and ensuring rules are executed as expected.
- To create breakpoints in the Package Explorer view or Navigator view of the JBoss Rules perspective, double-click the selected
.drlfile to open it in the editor. - You can add and remove rule breakpoints in the
.drlfiles in two ways:- Double-click the rule in the Rule editor at the line where you want to add a breakpoint. A breakpoint can be removed by double-clicking the rule once more.
Note
Rule breakpoints can only be created in the consequence of a rule. Double-clicking on a line where no breakpoint is allowed does nothing. - Right-click the ruler. Select the action in the context menu. Choosing this action adds a breakpoint at the selected line or remove it if there is one already.
- The Debug perspective contains a Breakpoints view which can be used to see all defined breakpoints, get their properties, enable/disable and remove them. You can switch to it by clicking
.
5.16. Debugging
リンクのコピーリンクがクリップボードにコピーされました!
Once you have created breakpoints, you can use them to start debugging your rules processes when required. This allows you to monitor errors and fixes them automatically where possible. By using the debugging configuration with breakpoints, you can make sure your rules process runs as expected.
- JBoss Rules breakpoints are only enabled if you debug your application as a JBoss Rules Application. To do this you should perform one of two actions:
- Select the main class of your application. Right-click on it and select
. - Alternatively, select
to open a new dialog window for creating, managing and running debug configurations. Select the JBoss Rules Application item in the left tree and click the button (leftmost icon in the toolbar above the tree). This creates a new configuration with a number of the properties already filled in based on main class you selected in the beginning. All properties shown here are the same as any standard Java program.
Note
Remember to change the name of your debug configuration to something meaningful. - Click the button on the bottom to start debugging your application.
- After enabling the debugging, the application starts executing and halts if any breakpoint is encountered. This can be a JBoss Rules rule breakpoint, or any other standard Java breakpoint. Whenever a JBoss Rules rule breakpoint is encountered, the corresponding
.drlfile is opened and the active line is highlighted. The Variables view also contains all rule parameters and their value. You can then use the default Java debug actions to decide what to do next (resume, terminate, step over, etc). The debug views can also be used to determine the contents of the working memory and agenda at that time as well (the current executing working memory is automatically shown).