このコンテンツは選択した言語では利用できません。
Chapter 13. Threads Page
Abstract
You view and monitor the state of threads in the Threads page. You can filter the page to show threads by status, and drill down to each thread to view stack trace information about the thread.
Overview
リンクのコピーリンクがクリップボードにコピーされました!
You access the Threads page from the Container perspective.
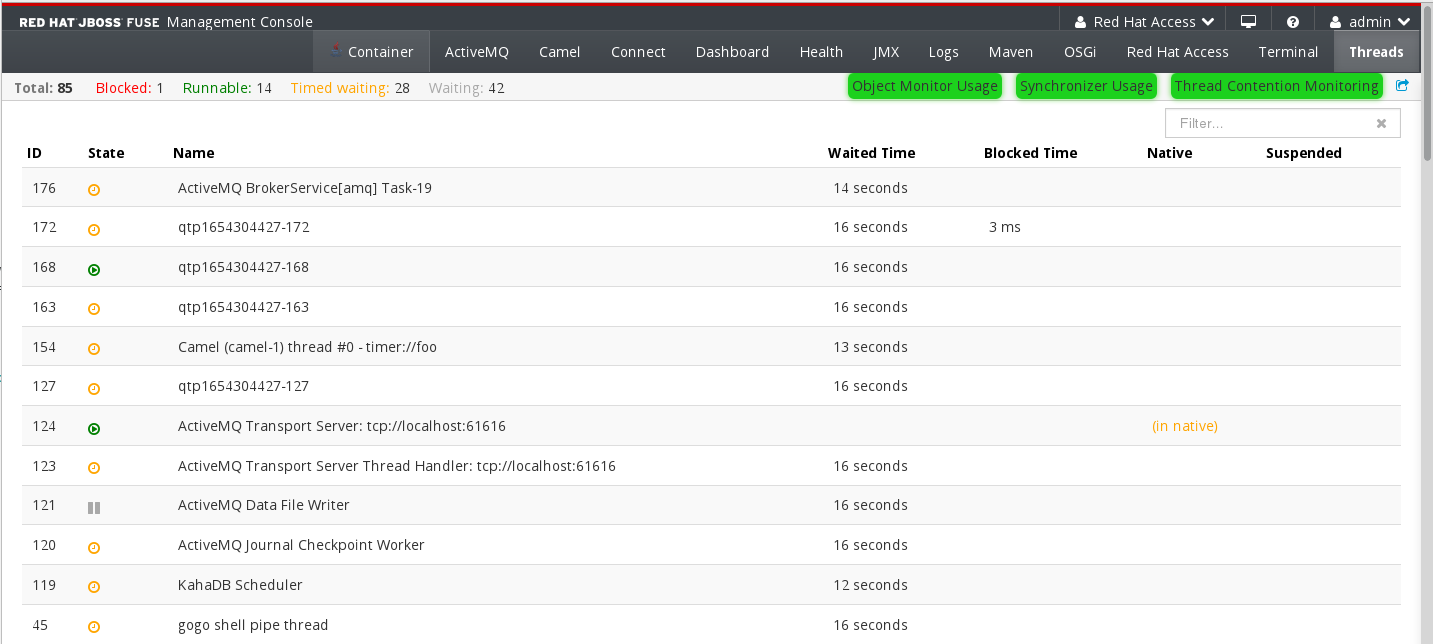
The following image shows an example of the Threads page:

The Threads page contains the following sections:
- Filter
- Options to filter the thread list according to the thread state. You can click each state to filter the page, or click Total to show all threads. Each state shows the number of threads with that state. You can also enter a text string in the Filter box to show only thread names that match the text string.
- Thread List
- List view of active threads. By default, the thread list shows all threads in descending ID order. You can click each column header to sort the list by that column. You can also click each thread to drill down to detailed information, such as the lock class name and full stack trace for that thread.