このコンテンツは選択した言語では利用できません。
Chapter 7. Monitoring the router network
After the router network is created, you can use the following tools to monitor its status and performance:
- Prometheus and Grafana
- AMQ Interconnect web console
7.1. Using Prometheus and Grafana to monitor the router network
Prometheus is container-native software built for storing historical data and for monitoring large, scalable systems such as AMQ Interconnect. It gathers data over an extended time, rather than just for the currently running session.
You use Prometheus and Alertmanager to monitor and store AMQ Interconnect data so that you can use a graphical tool, such as Grafana, to visualize and run queries on the data.
7.1.1. Setting up Prometheus and Grafana
Before you can view AMQ Interconnect dashboards, you must deploy and configure Prometheus, Alertmanager, and Grafana in the OpenShift project in which AMQ Interconnect is deployed. All of the required configuration files are provided in a GitHub repository.
Procedure
Clone the
qdr-monitoringGitHub repository.This repository contains the configuration files needed to set up Prometheus and Grafana to monitor AMQ Interconnect.
git clone https://github.com/interconnectedcloud/qdr-monitoring
$ git clone https://github.com/interconnectedcloud/qdr-monitoringCopy to Clipboard Copied! Toggle word wrap Toggle overflow Open the
deploy-monitoring.shscript and set theNAMESPACEvariable.Set
NAMESPACEto be the name of the project into which you have deployed AMQ Interconnect.Change the namespace to that of your project
#!/bin/bash

# Change the namespace to that of your project
NAMESPACE=myproject
...
Copy to Clipboard Copied! Toggle word wrap Toggle overflow Run the
deploy-monitoring.shscript.This script creates and configures the OpenShift resources needed to deploy Prometheus, Alertmanager, and Grafana in your OpenShift project. It also configures two dashboards that provide metrics for the router network.
./deploy-monitoring.sh
$ ./deploy-monitoring.shCopy to Clipboard Copied! Toggle word wrap Toggle overflow Create a Route for the prometheus, alertmanager, and grafana Services.
oc expose service prometheus
oc expose service alertmanager
oc expose service grafana
$ oc expose service prometheus

$ oc expose service alertmanager

$ oc expose service grafana
Copy to Clipboard Copied! Toggle word wrap Toggle overflow
Additional resources
- For more information about Prometheus, see the Prometheus documentation.
- For more information about Grafana, see the Grafana documentation.
7.1.2. Viewing AMQ Interconnect dashboards in Grafana
After setting up Prometheus and Grafana, you can visualize the AMQ Interconnect data on the following Grafana dashboards:
- Qpid Dispatch Router
Shows metrics for:
-
Deliveries ingress -
Deliveries egress -
Deliveries ingress route container -
Deliveries egress route container -
Deliveries redirected to fallback destination -
Dropped presettled deliveries -
Presettled deliveries -
Auto links -
Link routes -
Address count -
Connection count -
Link count
-
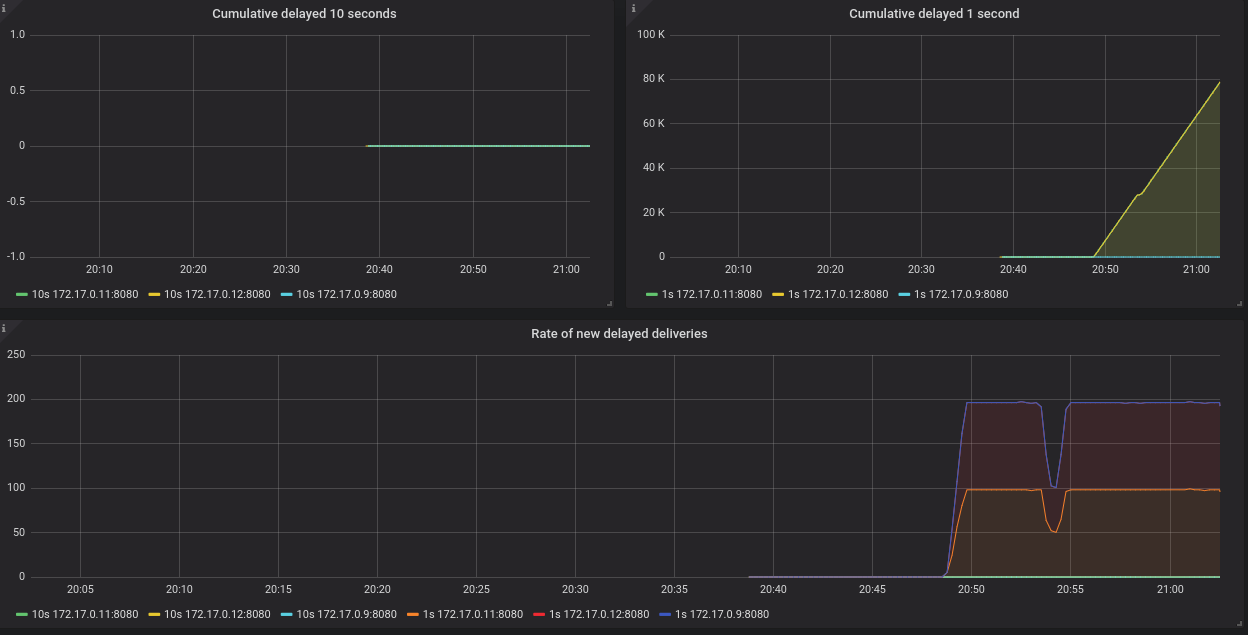
- Qpid Dispatch Router - Delayed Deliveries
Shows metrics for:
-
Cumulative delayed 10 seconds -
Cumulative delayed 1 second -
Rate of new delayed deliveries
-
Procedure
In the OpenShift web console, switch to
, and click the URL for the grafanaRoute.The Grafana Log In page appears.
Enter your user name and password, and then click .
The default Grafana user name and password are both
admin. After logging in for the first time, you can change the password.On the top header, click the dashboard drop-down menu, and then select the
Qpid Dispatch RouterorQpid Dispatch Router - Delayed Deliveriesdashboard.Figure 7.1. Delayed Deliveries dashboard
7.2. Using the AMQ Interconnect web console to monitor the router network
You can use the AMQ Interconnect web console to monitor the status and performance of your router network. By default, when you create a router deployment, the AMQ Interconnect Operator generates the credentials to access the console and stores them in a Secret.
Procedure
In OpenShift, switch to
, and click the console Route. The web console opens in a new tab.
Log in to the web console.
To find the user name and password for accessing the web console, navigate to
. The Secret containing the web console credentials is called <application-name>-users(for example,router-mesh-users).The syntax for the user name is <user>@<domain> (the domain is the OpenShift application name, which is the name of the Custom Resource that describes the router deployment). For example,
guest@router-mesh.Use the web console tabs to monitor the router network.
Expand This tab… Provides… OverviewAggregated information about routers, addresses, links, connections, and logs.
EntitiesDetailed information about each AMQP management entity for each router in the router network. Some of the attributes have charts that you can add to the
Chartstab.TopologyA graphical view of the router network, including routers, clients, and brokers. The topology shows how the routers are connected, and how messages are flowing through the network.
ChartsGraphs of the information selected on the
Entitiestab.Message FlowA chord diagram showing the real-time message flow by address.
SchemaThe management schema that controls each of the routers in the router network.
Revised on 2019-07-31 15:52:00 UTC