Fuse 6 is no longer supported
As of February 2025, Red Hat Fuse 6 is no longer supported. If you are using Fuse 6, please upgrade to Red Hat build of Apache Camel.このコンテンツは選択した言語では利用できません。
Chapter 2. Debug Perspective
Overview
リンクのコピーリンクがクリップボードにコピーされました!
The Debug perspective, shown in Figure 2.1, provides access to all of the Camel debugger's functions. It contains all of the views used to monitor and debug a running routing context.
Figure 2.1. Debug perspective
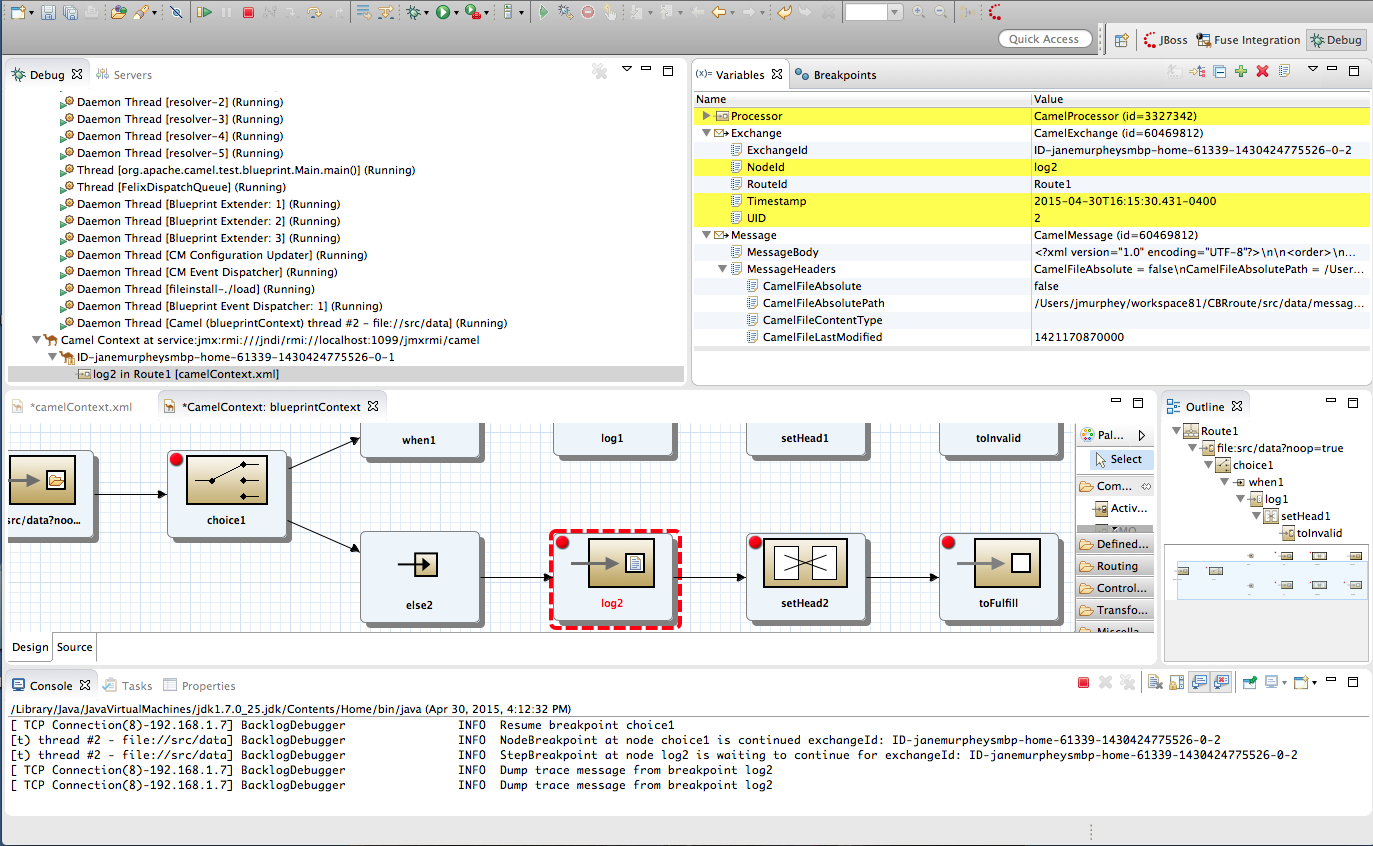
- Debug viewFor the running routing context, Debug view displays the debug stack.You can switch between breakpoints within the same message flow, listed under the
Camel Context at service:jmx:rmi://jndi/rmi://localhost:1099/jmxrmi/camelentry, to review and compare variable values in Variables view.Messages flows are identified by their unique breadcrumb ID, and the breadcrumb ID of each subsequent message flow is incremented by 2. For example, in Figure 2.1, “Debug perspective”, the breadcrumb ID for the first message flow isID-janemurpheysmbp-home-61339-11430424775526-0-1, so the breadcrumbID for the second message flow would beID-janemurpheysmbp-home-61339-11430424775526-0-3. - Variables viewFor each node in the routing context that has a breakpoint set, Variables view displays the value of the available variables when the breakpoint is hit. Each variable who's value changed since the preceding breakpoint is highlighted in yellow.You can change the value of editable variables to check whether such changes produce the expected results and to test the robustness of your routing context.You can also add variables to the watch list, so you can quickly and easily see whether their values change as expected at the expected point in the message flow.
- Breakpoints viewDisplays a list of the breakpoints set in the routing context, and shows whether they are enabled or disabled. You can enable and disable individual breakpoints by checking (enabling) or unchecking (disabling) them. This enables you to temporarily focus on nodes in your routing context that are behaving problematically.The
 button skips over disabled breakpoints to jump to the next active breakpoint in the routing context. In contrast, the
 button jumps to the next node of execution in the routing context, regardless of breakpoints.
- Camel Context: viewDisplays the running CamelContext:
<CamelId>.xmlin graphical mode. For nodes set with breakpoints, it shows the type of breakpoint set and whether the breakpoint is enabled or disabled. When a breakpoint is hit, its corresponding node on the canvas is outlined in red.To check a node's configuration, open Properties view and then select the node on the canvas in Camel Context: view. - Console viewDisplays the log output generated by the Camel debugger as it executes the routing context.
- Properties viewDisplays the properties set for the node selected on the canvas in CamelContext: view.
Related topics
リンクのコピーリンクがクリップボードにコピーされました!
| Part III, “Debugging Routing Contexts” |
| chapter "To Debug a Routing Context" in "Tooling Tutorials" |