이 콘텐츠는 선택한 언어로 제공되지 않습니다.
9. Deploying and Managing Storage Nodes
Raw metric data and aggregated metric data are stored in a dedicated, scalable distributed database. Much like the JBoss ON server, there can be multiple storage nodes in a cluster (installed independently of the server). Nodes can be added and dropped from the cloud easily, allowing the metrics storage to be dynamically expanded according to the needs of the environment.
9.1. About High-Speed Metrics Storage
링크 복사링크가 클립보드에 복사되었습니다!
Collecting metrics and generating alerts can be resource-intensive. It results in near-constant write operations on the backend database. That creates a natural threshold for the number of metrics that can be collected (30,000 per minute) before encountering performance degradation.
Note
The natural threshold of 30,000 metrics per minute is based on internal performance testing. This threshold varies depending on system resources and overall load.
JBoss ON uses two databases to store its information. One is a central relational database (PostgreSQL or Oracle) which stores all configuration about the JBoss ON servers and agents, all resource inventory data, resource configuration, and other data. The other database is a distributed database (a cluster of storage nodes) which stores all numeric monitoring data — in other words, all collected metrics.
The distributed database can be expanded, with multiple nodes in a cluster. This ability to add additional nodes according to load is a crucial management tool for administrators. Rather than encountering that hardware-driven limit of 30,000 metrics collected per minute, additional nodes can be added to improve performance.
At least one storage node must be created and managed by JBoss ON (which minimizes the metrics storage node management overhead since no external tools are required).
There are several paths of communication to handle metrics data, all working in parallel.
- The agent sends the storage node configuration to the JBoss ON server. The JBoss ON server then sends that updated storage cluster information to every agent associated with a storage node.Each companion agent then updates its storage cluster configuration, in the
rhq-storage-auth.conf, with the hostname or IP address of the new node. (Likewise, when a node is removed, the server sends the information to each of the companion agents, and the agent removes the hostname or IP address from the list in the local storage node'srhq-storage-auth.conffile.) - The server receives monitoring data from all agents (not just those associated with a storage node), and sends that information to an available storage node to be stored.
- The storage nodes replicate their monitoring data among each other for high availability and integrity.
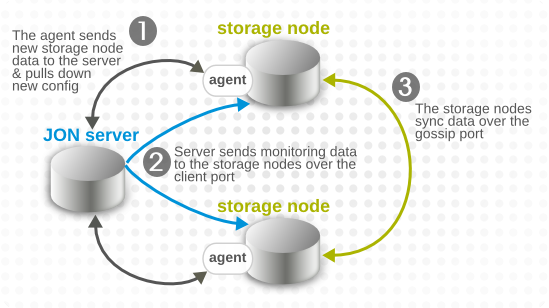
Figure 10. Server, Agent, and Metrics Storage Node Communication
Node cluster communication requires three elements:
- The hostname or IP address of every storage node, stored in the
rhq-storage-auth.conf - A common port number for the JBoss ON server to use to communicate with the storage node (the client port)
- A common port number for the other storage nodes in the cluster to use to sync data between each other (the gossip port)
The metrics storage provides data availability and integrity by backing up the data in two ways:
- Replicating data between the storage nodes (over the gossip port)
- Taking local snapshots and backing up the data locally