고급 네트워킹
OpenShift Container Platform 클러스터 설치 및 구성
초록
1장. 끝점에 대한 연결 확인
CNO(Cluster Network Operator)는 클러스터 내 리소스 간에 연결 상태 검사를 수행하는 연결 확인 컨트롤러인 컨트롤러를 실행합니다. 상태 점검 결과를 검토하여 연결 문제를 진단하거나 현재 조사하고 있는 문제의 원인으로 네트워크 연결을 제거할 수 있습니다.
1.1. 수행되는 연결 상태 점검
클러스터 리소스에 도달할 수 있는지 확인하기 위해 다음 클러스터 API 서비스 각각에 TCP 연결이 수행됩니다.
- Kubernetes API 서버 서비스
- Kubernetes API 서버 끝점
- OpenShift API 서버 서비스
- OpenShift API 서버 끝점
- 로드 밸런서
클러스터의 모든 노드에서 서비스 및 서비스 끝점에 도달할 수 있는지 확인하기 위해 다음 대상 각각에 TCP 연결이 수행됩니다.
- 상태 점검 대상 서비스
- 상태 점검 대상 끝점
1.2. 연결 상태 점검 구현
연결 검증 컨트롤러는 클러스터의 연결 확인 검사를 오케스트레이션합니다. 연결 테스트의 결과는 openshift-network-diagnostics의 PodNetworkConnectivity 오브젝트에 저장됩니다. 연결 테스트는 병렬로 1분마다 수행됩니다.
CNO(Cluster Network Operator)는 클러스터에 여러 리소스를 배포하여 연결 상태 점검을 전달하고 수신합니다.
- 상태 점검 소스
-
이 프로그램은
Deployment오브젝트에서 관리하는 단일 포드 복제본 세트에 배포됩니다. 프로그램은PodNetworkConnectivity오브젝트를 사용하고 각 오브젝트에 지정된spec.targetEndpoint에 연결됩니다. - 상태 점검 대상
- 클러스터의 모든 노드에서 데몬 세트의 일부로 배포된 포드입니다. 포드는 인바운드 상태 점검을 수신 대기합니다. 모든 노드에 이 포드가 있으면 각 노드로의 연결을 테스트할 수 있습니다.
노드 선택기를 사용하여 네트워크 연결 소스 및 대상이 실행되는 노드를 구성할 수 있습니다. 또한 소스 및 대상 Pod에 대해 허용 가능한 허용 오차 를 지정할 수 있습니다. 구성은 config.openshift.io/v1 API 그룹에 있는 네트워크 API의 싱글톤 클러스터 사용자 정의 리소스에 정의됩니다.
구성을 업데이트한 후 Pod 예약이 수행됩니다. 따라서 구성을 업데이트하기 전에 선택기에서 사용하려는 노드 레이블을 적용해야 합니다. 네트워크 연결을 업데이트한 후 적용되는 레이블은 Pod 배치가 무시됩니다.
다음 YAML의 기본 구성을 참조하십시오.
연결 소스 및 대상 Pod의 기본 구성
apiVersion: config.openshift.io/v1
kind: Network
metadata:
  name: cluster
spec:
  # ...
    networkDiagnostics:
mode: "All"
sourcePlacement:
        nodeSelector:
          checkNodes: groupA
        tolerations:
        - key: myTaint
          effect: NoSchedule
          operator: Exists
      targetPlacement:
        nodeSelector:
          checkNodes: groupB
        tolerations:
        - key: myOtherTaint
          effect: NoExecute
operator: Exists- 1
- 네트워크 진단 구성을 지정합니다. 값을 지정하지 않거나 빈 오브젝트가 지정되고
spec.disableNetworkDiagnostics=true가network.operator.openshift.io사용자 정의 리소스에 설정된 경우 네트워크 진단이 비활성화됩니다.설정된 경우 이 값은spec.disableNetworkDiagnostics=true를 덮어씁니다. - 2
- 진단 모드를 지정합니다. 값은 빈 문자열,
All또는Disabled일 수 있습니다. 빈 문자열은All을 지정하는 것과 동일합니다. - 3
- 선택 사항: 연결 확인 소스 Pod에 대한 선택기를 지정합니다.
nodeSelector및tolerations필드를 사용하여sourceNodePod를 추가로 지정할 수 있습니다. 이는 소스 및 대상 Pod 모두에 대해 선택 사항입니다. 생략하거나 둘 다 사용하거나 둘 중 하나만 사용할 수 있습니다. - 4
- 선택 사항: 연결 확인 대상 Pod에 대한 선택기를 지정합니다.
nodeSelector및tolerations필드를 사용하여targetNodePod를 추가로 지정할 수 있습니다. 이는 소스 및 대상 Pod 모두에 대해 선택 사항입니다. 생략하거나 둘 다 사용하거나 둘 중 하나만 사용할 수 있습니다.
1.3. Pod 연결 점검 배치 구성
클러스터 관리자는 cluster 라는 network.config.openshift.io 오브젝트를 수정하여 연결 점검 Pod가 실행되는 노드를 구성할 수 있습니다.
사전 요구 사항
-
OpenShift CLI(
oc)를 설치합니다.
프로세스
다음 명령을 입력하여 연결 점검 구성을 편집합니다.
$ oc edit network.config.openshift.io cluster-
텍스트 편집기에서
networkDiagnostics스탠자를 업데이트하여 소스 및 대상 Pod에 원하는 노드 선택기를 지정합니다. - 변경 사항을 저장하고 텍스트 편집기를 종료합니다.
검증
- 다음 명령을 입력하여 소스 및 대상 Pod가 의도한 노드에서 실행 중인지 확인합니다.
$ oc get pods -n openshift-network-diagnostics -o wide출력 예
NAME                                    READY   STATUS    RESTARTS   AGE     IP           NODE                                        NOMINATED NODE   READINESS GATES
network-check-source-84c69dbd6b-p8f7n   1/1     Running   0          9h      10.131.0.8   ip-10-0-40-197.us-east-2.compute.internal   <none>           <none>
network-check-target-46pct              1/1     Running   0          9h      10.131.0.6   ip-10-0-40-197.us-east-2.compute.internal   <none>           <none>
network-check-target-8kwgf              1/1     Running   0          9h      10.128.2.4   ip-10-0-95-74.us-east-2.compute.internal    <none>           <none>
network-check-target-jc6n7              1/1     Running   0          9h      10.129.2.4   ip-10-0-21-151.us-east-2.compute.internal   <none>           <none>
network-check-target-lvwnn              1/1     Running   0          9h      10.128.0.7   ip-10-0-17-129.us-east-2.compute.internal   <none>           <none>
network-check-target-nslvj              1/1     Running   0          9h      10.130.0.7   ip-10-0-89-148.us-east-2.compute.internal   <none>           <none>
network-check-target-z2sfx              1/1     Running   0          9h      10.129.0.4   ip-10-0-60-253.us-east-2.compute.internal   <none>           <none>
1.4. PodNetworkConnectivityCheck 오브젝트 필드
PodNetworkConnectivityCheck 오브젝트 필드는 다음 표에 설명되어 있습니다.
| 필드 | 유형 | 설명 |
|---|---|---|
|
|
|
다음과 같은 형식의 오브젝트 이름:
|
|
|
|
오브젝트와 연결된 네임스페이스입니다. 이 값은 항상 |
|
|
|
연결 확인이 시작된 포드의 이름입니다(예: |
|
|
|
연결 검사의 대상입니다(예: |
|
|
| 사용할 TLS 인증서 설정입니다. |
|
|
| 해당하는 경우 사용되는 TLS 인증서의 이름입니다. 기본값은 빈 문자열입니다. |
|
|
| 연결 테스트의 조건 및 최근 연결 성공 및 실패의 로그를 나타내는 오브젝트입니다. |
|
|
| 연결 확인의 최신 상태 및 모든 이전 상태입니다. |
|
|
| 실패한 시도에서의 연결 테스트 로그입니다. |
|
|
| 중단 기간을 포함하는 테스트 로그를 연결합니다. |
|
|
| 성공적인 시도에서의 연결 테스트 로그입니다. |
다음 표에서는 status.conditions 배열에서 오브젝트 필드를 설명합니다.
| 필드 | 유형 | 설명 |
|---|---|---|
|
|
| 연결 조건이 하나의 상태에서 다른 상태로 전환된 시간입니다. |
|
|
| 사람이 읽기 쉬운 형식으로 마지막 전환에 대한 세부 정보입니다. |
|
|
| 머신에서 읽을 수 있는 형식으로 전환의 마지막 상태입니다. |
|
|
| 조건의 상태: |
|
|
| 조건의 유형입니다. |
다음 표에서는 status.conditions 배열에서 오브젝트 필드를 설명합니다.
| 필드 | 유형 | 설명 |
|---|---|---|
|
|
| 연결 오류가 해결될 때부터의 타임 스탬프입니다. |
|
|
| 서비스 중단의 성공적인 종료와 관련된 로그 항목을 포함한 연결 로그 항목입니다. |
|
|
| 사람이 읽을 수 있는 형식의 중단 세부 정보에 대한 요약입니다. |
|
|
| 연결 오류가 먼저 감지될 때부터의 타임 스탬프입니다. |
|
|
| 원래 오류를 포함한 연결 로그 항목입니다. |
1.4.1. 연결 로그 필드
연결 로그 항목의 필드는 다음 표에 설명되어 있습니다. 오브젝트는 다음 필드에서 사용됩니다.
-
status.failures[] -
status.successes[] -
status.outages[].startLogs[] -
status.outages[].endLogs[]
| 필드 | 유형 | 설명 |
|---|---|---|
|
|
| 작업 기간을 기록합니다. |
|
|
| 사람이 읽을 수 있는 형식으로 상태를 제공합니다. |
|
|
|
머신에서 읽을 수 있는 형식으로 상태의 이유를 제공합니다. 값은 |
|
|
| 로그 항목이 성공 또는 실패인지를 나타냅니다. |
|
|
| 연결 확인 시작 시간입니다. |
1.5. 끝점에 대한 네트워크 연결 확인
클러스터 관리자는 API 서버, 로드 밸런서, 서비스 또는 Pod와 같은 끝점의 연결을 확인하고 네트워크 진단이 활성화되어 있는지 확인할 수 있습니다.
사전 요구 사항
-
OpenShift CLI(
oc)를 설치합니다. -
cluster-admin역할의 사용자로 클러스터에 액세스할 수 있어야 합니다.
프로세스
다음 명령을 입력하여 네트워크 진단이 활성화되었는지 확인합니다.
$ oc get network.config.openshift.io cluster -o yaml출력 예
  # ...
  status:
  # ...
    conditions:
    - lastTransitionTime: "2024-05-27T08:28:39Z"
      message: ""
      reason: AsExpected
      status: "True"
      type: NetworkDiagnosticsAvailable
다음 명령을 입력하여 현재
PodNetworkConnectivityCheck오브젝트를 나열합니다.$ oc get podnetworkconnectivitycheck -n openshift-network-diagnostics출력 예
NAME                                                                                                                                AGE
network-check-source-ci-ln-x5sv9rb-f76d1-4rzrp-worker-b-6xdmh-to-kubernetes-apiserver-endpoint-ci-ln-x5sv9rb-f76d1-4rzrp-master-0   75m
network-check-source-ci-ln-x5sv9rb-f76d1-4rzrp-worker-b-6xdmh-to-kubernetes-apiserver-endpoint-ci-ln-x5sv9rb-f76d1-4rzrp-master-1   73m
network-check-source-ci-ln-x5sv9rb-f76d1-4rzrp-worker-b-6xdmh-to-kubernetes-apiserver-endpoint-ci-ln-x5sv9rb-f76d1-4rzrp-master-2   75m
network-check-source-ci-ln-x5sv9rb-f76d1-4rzrp-worker-b-6xdmh-to-kubernetes-apiserver-service-cluster                               75m
network-check-source-ci-ln-x5sv9rb-f76d1-4rzrp-worker-b-6xdmh-to-kubernetes-default-service-cluster                                 75m
network-check-source-ci-ln-x5sv9rb-f76d1-4rzrp-worker-b-6xdmh-to-load-balancer-api-external                                         75m
network-check-source-ci-ln-x5sv9rb-f76d1-4rzrp-worker-b-6xdmh-to-load-balancer-api-internal                                         75m
network-check-source-ci-ln-x5sv9rb-f76d1-4rzrp-worker-b-6xdmh-to-network-check-target-ci-ln-x5sv9rb-f76d1-4rzrp-master-0            75m
network-check-source-ci-ln-x5sv9rb-f76d1-4rzrp-worker-b-6xdmh-to-network-check-target-ci-ln-x5sv9rb-f76d1-4rzrp-master-1            75m
network-check-source-ci-ln-x5sv9rb-f76d1-4rzrp-worker-b-6xdmh-to-network-check-target-ci-ln-x5sv9rb-f76d1-4rzrp-master-2            75m
network-check-source-ci-ln-x5sv9rb-f76d1-4rzrp-worker-b-6xdmh-to-network-check-target-ci-ln-x5sv9rb-f76d1-4rzrp-worker-b-6xdmh      74m
network-check-source-ci-ln-x5sv9rb-f76d1-4rzrp-worker-b-6xdmh-to-network-check-target-ci-ln-x5sv9rb-f76d1-4rzrp-worker-c-n8mbf      74m
network-check-source-ci-ln-x5sv9rb-f76d1-4rzrp-worker-b-6xdmh-to-network-check-target-ci-ln-x5sv9rb-f76d1-4rzrp-worker-d-4hnrz      74m
network-check-source-ci-ln-x5sv9rb-f76d1-4rzrp-worker-b-6xdmh-to-network-check-target-service-cluster                               75m
network-check-source-ci-ln-x5sv9rb-f76d1-4rzrp-worker-b-6xdmh-to-openshift-apiserver-endpoint-ci-ln-x5sv9rb-f76d1-4rzrp-master-0    75m
network-check-source-ci-ln-x5sv9rb-f76d1-4rzrp-worker-b-6xdmh-to-openshift-apiserver-endpoint-ci-ln-x5sv9rb-f76d1-4rzrp-master-1    75m
network-check-source-ci-ln-x5sv9rb-f76d1-4rzrp-worker-b-6xdmh-to-openshift-apiserver-endpoint-ci-ln-x5sv9rb-f76d1-4rzrp-master-2    74m
network-check-source-ci-ln-x5sv9rb-f76d1-4rzrp-worker-b-6xdmh-to-openshift-apiserver-service-cluster                                75m
연결 테스트 로그를 확인합니다.
- 이전 명령의 출력에서 연결 로그를 검토할 끝점을 식별합니다.
다음 명령을 입력하여 오브젝트를 확인합니다.
$ oc get podnetworkconnectivitycheck <name> \
  -n openshift-network-diagnostics -o yaml
여기서
<name>은PodNetworkConnectivityCheck오브젝트의 이름을 지정합니다.출력 예
apiVersion: controlplane.operator.openshift.io/v1alpha1
kind: PodNetworkConnectivityCheck
metadata:
  name: network-check-source-ci-ln-x5sv9rb-f76d1-4rzrp-worker-b-6xdmh-to-kubernetes-apiserver-endpoint-ci-ln-x5sv9rb-f76d1-4rzrp-master-0
  namespace: openshift-network-diagnostics
  ...
spec:
  sourcePod: network-check-source-7c88f6d9f-hmg2f
  targetEndpoint: 10.0.0.4:6443
  tlsClientCert:
    name: ""
status:
  conditions:
  - lastTransitionTime: "2021-01-13T20:11:34Z"
    message: 'kubernetes-apiserver-endpoint-ci-ln-x5sv9rb-f76d1-4rzrp-master-0: tcp
      connection to 10.0.0.4:6443 succeeded'
    reason: TCPConnectSuccess
    status: "True"
    type: Reachable
  failures:
  - latency: 2.241775ms
    message: 'kubernetes-apiserver-endpoint-ci-ln-x5sv9rb-f76d1-4rzrp-master-0: failed
      to establish a TCP connection to 10.0.0.4:6443: dial tcp 10.0.0.4:6443: connect:
      connection refused'
    reason: TCPConnectError
    success: false
    time: "2021-01-13T20:10:34Z"
  - latency: 2.582129ms
    message: 'kubernetes-apiserver-endpoint-ci-ln-x5sv9rb-f76d1-4rzrp-master-0: failed
      to establish a TCP connection to 10.0.0.4:6443: dial tcp 10.0.0.4:6443: connect:
      connection refused'
    reason: TCPConnectError
    success: false
    time: "2021-01-13T20:09:34Z"
  - latency: 3.483578ms
    message: 'kubernetes-apiserver-endpoint-ci-ln-x5sv9rb-f76d1-4rzrp-master-0: failed
      to establish a TCP connection to 10.0.0.4:6443: dial tcp 10.0.0.4:6443: connect:
      connection refused'
    reason: TCPConnectError
    success: false
    time: "2021-01-13T20:08:34Z"
  outages:
  - end: "2021-01-13T20:11:34Z"
    endLogs:
    - latency: 2.032018ms
      message: 'kubernetes-apiserver-endpoint-ci-ln-x5sv9rb-f76d1-4rzrp-master-0:
        tcp connection to 10.0.0.4:6443 succeeded'
      reason: TCPConnect
      success: true
      time: "2021-01-13T20:11:34Z"
    - latency: 2.241775ms
      message: 'kubernetes-apiserver-endpoint-ci-ln-x5sv9rb-f76d1-4rzrp-master-0:
        failed to establish a TCP connection to 10.0.0.4:6443: dial tcp 10.0.0.4:6443:
        connect: connection refused'
      reason: TCPConnectError
      success: false
      time: "2021-01-13T20:10:34Z"
    - latency: 2.582129ms
      message: 'kubernetes-apiserver-endpoint-ci-ln-x5sv9rb-f76d1-4rzrp-master-0:
        failed to establish a TCP connection to 10.0.0.4:6443: dial tcp 10.0.0.4:6443:
        connect: connection refused'
      reason: TCPConnectError
      success: false
      time: "2021-01-13T20:09:34Z"
    - latency: 3.483578ms
      message: 'kubernetes-apiserver-endpoint-ci-ln-x5sv9rb-f76d1-4rzrp-master-0:
        failed to establish a TCP connection to 10.0.0.4:6443: dial tcp 10.0.0.4:6443:
        connect: connection refused'
      reason: TCPConnectError
      success: false
      time: "2021-01-13T20:08:34Z"
    message: Connectivity restored after 2m59.999789186s
    start: "2021-01-13T20:08:34Z"
    startLogs:
    - latency: 3.483578ms
      message: 'kubernetes-apiserver-endpoint-ci-ln-x5sv9rb-f76d1-4rzrp-master-0:
        failed to establish a TCP connection to 10.0.0.4:6443: dial tcp 10.0.0.4:6443:
        connect: connection refused'
      reason: TCPConnectError
      success: false
      time: "2021-01-13T20:08:34Z"
  successes:
  - latency: 2.845865ms
    message: 'kubernetes-apiserver-endpoint-ci-ln-x5sv9rb-f76d1-4rzrp-master-0: tcp
      connection to 10.0.0.4:6443 succeeded'
    reason: TCPConnect
    success: true
    time: "2021-01-13T21:14:34Z"
  - latency: 2.926345ms
    message: 'kubernetes-apiserver-endpoint-ci-ln-x5sv9rb-f76d1-4rzrp-master-0: tcp
      connection to 10.0.0.4:6443 succeeded'
    reason: TCPConnect
    success: true
    time: "2021-01-13T21:13:34Z"
  - latency: 2.895796ms
    message: 'kubernetes-apiserver-endpoint-ci-ln-x5sv9rb-f76d1-4rzrp-master-0: tcp
      connection to 10.0.0.4:6443 succeeded'
    reason: TCPConnect
    success: true
    time: "2021-01-13T21:12:34Z"
  - latency: 2.696844ms
    message: 'kubernetes-apiserver-endpoint-ci-ln-x5sv9rb-f76d1-4rzrp-master-0: tcp
      connection to 10.0.0.4:6443 succeeded'
    reason: TCPConnect
    success: true
    time: "2021-01-13T21:11:34Z"
  - latency: 1.502064ms
    message: 'kubernetes-apiserver-endpoint-ci-ln-x5sv9rb-f76d1-4rzrp-master-0: tcp
      connection to 10.0.0.4:6443 succeeded'
    reason: TCPConnect
    success: true
    time: "2021-01-13T21:10:34Z"
  - latency: 1.388857ms
    message: 'kubernetes-apiserver-endpoint-ci-ln-x5sv9rb-f76d1-4rzrp-master-0: tcp
      connection to 10.0.0.4:6443 succeeded'
    reason: TCPConnect
    success: true
    time: "2021-01-13T21:09:34Z"
  - latency: 1.906383ms
    message: 'kubernetes-apiserver-endpoint-ci-ln-x5sv9rb-f76d1-4rzrp-master-0: tcp
      connection to 10.0.0.4:6443 succeeded'
    reason: TCPConnect
    success: true
    time: "2021-01-13T21:08:34Z"
  - latency: 2.089073ms
    message: 'kubernetes-apiserver-endpoint-ci-ln-x5sv9rb-f76d1-4rzrp-master-0: tcp
      connection to 10.0.0.4:6443 succeeded'
    reason: TCPConnect
    success: true
    time: "2021-01-13T21:07:34Z"
  - latency: 2.156994ms
    message: 'kubernetes-apiserver-endpoint-ci-ln-x5sv9rb-f76d1-4rzrp-master-0: tcp
      connection to 10.0.0.4:6443 succeeded'
    reason: TCPConnect
    success: true
    time: "2021-01-13T21:06:34Z"
  - latency: 1.777043ms
    message: 'kubernetes-apiserver-endpoint-ci-ln-x5sv9rb-f76d1-4rzrp-master-0: tcp
      connection to 10.0.0.4:6443 succeeded'
    reason: TCPConnect
    success: true
    time: "2021-01-13T21:05:34Z"
2장. 클러스터 네트워크의 MTU 변경
클러스터 관리자는 클러스터 설치 후 클러스터 네트워크의 최대 전송 단위(MTU)를 변경할 수 있습니다. MTU 변경을 종료하려면 클러스터 노드를 재부팅해야 하므로 이러한 변경이 중단됩니다.
2.1. 클러스터 MTU 정보
설치 중에 클러스터 네트워크 MTU는 클러스터 노드의 기본 네트워크 인터페이스 MTU에 따라 자동으로 설정됩니다. 일반적으로 감지된 MTU를 재정의할 필요가 없습니다.
다음 이유 중 하나로 클러스터 네트워크의 MTU를 변경할 수 있습니다.
- 클러스터 설치 중에 감지된 MTU는 인프라에 적합하지 않습니다.
- 이제 최적의 성능을 위해 다른 MTU가 필요한 노드 추가와 같이 클러스터 인프라에 다른 MTU가 필요합니다.
OVN-Kubernetes 네트워크 플러그인만 MTU 값 변경을 지원합니다.
2.1.1. 서비스 중단 고려 사항
클러스터에서 최대 전송 단위(MTU) 변경을 시작하면 다음과 같은 영향이 서비스 가용성에 영향을 미칠 수 있습니다.
- 새 MTU로의 마이그레이션을 완료하려면 두 개 이상의 롤링 재부팅이 필요합니다. 이 기간 동안 일부 노드를 다시 시작할 수 없으므로 사용할 수 없습니다.
- 절대 TCP 시간 간격보다 짧은 시간 초과 간격으로 클러스터에 배포된 특정 애플리케이션은 MTU 변경 중에 중단될 수 있습니다.
2.1.2. MTU 값 선택
MTU(최대 전송 단위) 마이그레이션을 계획할 때 고려해야 할 두 개의 관련 MTU 값이 있습니다.
- 하드웨어 MTU: 이 MTU 값은 네트워크 인프라의 세부 사항에 따라 설정됩니다.
-
클러스터 네트워크 MTU: 이 MTU 값은 클러스터 네트워크 오버레이 오버헤드를 고려하여 하드웨어 MTU보다 항상 적습니다. 특정 오버헤드는 네트워크 플러그인에 따라 결정됩니다. OVN-Kubernetes의 경우 오버헤드는
100바이트입니다.
클러스터에 다른 노드에 대한 다른 MTU 값이 필요한 경우 클러스터의 모든 노드에서 사용하는 가장 낮은 MTU 값에서 네트워크 플러그인의 오버헤드 값을 제거해야 합니다. 예를 들어, 클러스터의 일부 노드에 9001의 MTU가 있고 일부에는 1500의 MTU가 있는 경우 이 값을 1400으로 설정해야 합니다.
노드에서 허용되지 않는 MTU 값을 선택하지 않으려면 ip -d link 명령을 사용하여 네트워크 인터페이스에서 허용하는 최대 MTU 값(maxmtu)을 확인합니다.
2.1.3. 마이그레이션 프로세스의 작동 방식
다음 표는 프로세스의 사용자 시작 단계와 마이그레이션이 수행하는 작업 간에 분할하여 마이그레이션 프로세스를 요약합니다.
| 사용자 시작 단계 | OpenShift Container Platform 활동 |
|---|---|
| Cluster Network Operator 구성에서 다음 값을 설정합니다.
| CNO(Cluster Network Operator): 각 필드가 유효한 값으로 설정되어 있는지 확인합니다.
제공된 값이 유효한 경우 CNO는 MCO(Machine Config Operator): 클러스터의 각 노드에 대해 롤링 재부팅을 수행합니다. |
| 클러스터의 노드에 대한 기본 네트워크 인터페이스의 MTU를 재구성합니다. 다음 방법 중 하나를 사용하여 이 작업을 수행할 수 있습니다.
| 해당 없음 |
|
네트워크 플러그인의 CNO 구성에서 | MCO(Machine Config Operator): 새 MTU 구성으로 클러스터의 각 노드를 롤링 재부팅합니다. |
2.2. 클러스터 네트워크 MTU 변경
클러스터 관리자는 클러스터의 최대 전송 단위(MTU)를 늘리거나 줄일 수 있습니다.
MTU 마이그레이션 프로세스 중에 노드의 MTU 값을 롤백할 수는 없지만 MTU 마이그레이션 프로세스가 완료된 후 값을 롤백할 수 있습니다.
MTU 업데이트가 적용되므로 마이그레이션이 중단되고 클러스터의 노드를 일시적으로 사용할 수 없게 될 수 있습니다.
다음 절차에서는 시스템 구성, DHCP(Dynamic Host Configuration Protocol) 또는 ISO 이미지를 사용하여 클러스터 네트워크 MTU를 변경하는 방법을 설명합니다. DHCP 또는 ISO 접근 방식을 사용하는 경우 절차를 완료하기 위해 클러스터를 설치한 후 유지한 구성 아티팩트를 참조해야 합니다.
사전 요구 사항
-
OpenShift CLI(
oc)가 설치되어 있습니다. -
cluster-admin권한이 있는 계정을 사용하여 클러스터에 액세스할 수 있습니다. -
클러스터의 대상 MTU를 식별했습니다. OVN-Kubernetes 네트워크 플러그인의 MTU는 클러스터에서 가장 낮은 하드웨어 MTU 값보다
100으로 설정해야 합니다. - 노드가 물리적 시스템인 경우 클러스터 네트워크와 연결된 네트워크 스위치가 점보 프레임을 지원하는지 확인합니다.
- 노드가 VM(가상 머신)인 경우 하이퍼바이저 및 연결된 네트워크 스위치가 점보 프레임을 지원하는지 확인합니다.
2.2.1. 현재 클러스터 MTU 값 확인
다음 절차를 사용하여 클러스터 네트워크의 현재 최대 전송 단위(MTU)를 가져옵니다.
프로세스
클러스터 네트워크의 현재 MTU를 가져오려면 다음 명령을 입력합니다.
$ oc describe network.config cluster출력 예
...
Status:
  Cluster Network:
    Cidr:               10.217.0.0/22
    Host Prefix:        23
  Cluster Network MTU:  1400
  Network Type:         OVNKubernetes
  Service Network:
    10.217.4.0/23
...
2.2.2. 하드웨어 MTU 구성 준비
클러스터 노드에 대한 하드웨어 최대 전송 단위(MTU)를 구성하는 방법은 여러 가지가 있습니다. 다음 예제에서는 가장 일반적인 방법만 보여줍니다. 인프라 MTU의 정확성을 확인합니다. 클러스터 노드에서 하드웨어 MTU를 구성하는 기본 방법을 선택합니다.
프로세스
하드웨어 MTU에 대한 구성을 준비합니다.
하드웨어 MTU가 DHCP로 지정된 경우 다음 dnsmasq 구성과 같은 DHCP 구성을 업데이트합니다.
dhcp-option-force=26,<mtu>다음과 같습니다.
<mtu>- 알릴 DHCP 서버의 하드웨어 MTU를 지정합니다.
- 하드웨어 MTU가 PXE를 사용하여 커널 명령줄로 지정된 경우 그에 따라 해당 구성을 업데이트합니다.
하드웨어 MTU가 NetworkManager 연결 구성에 지정된 경우 다음 단계를 완료합니다. 이 방법은 DHCP, 커널 명령줄 또는 기타 방법으로 네트워크 구성을 명시적으로 지정하지 않는 경우 OpenShift Container Platform의 기본값입니다. 클러스터 노드는 다음 절차에 따라 수정되지 않은 상태로 작동하도록 동일한 기본 네트워크 구성을 사용해야 합니다.
다음 명령을 입력하여 기본 네트워크 인터페이스를 찾습니다.
$ oc debug node/<node_name> -- chroot /host nmcli -g connection.interface-name c show ovs-if-phys0다음과 같습니다.
<node_name>- 클러스터에 있는 노드의 이름을 지정합니다.
<
interface>-mtu.conf 파일에 다음NetworkManager구성을 생성합니다.[connection-<interface>-mtu] match-device=interface-name:<interface> ethernet.mtu=<mtu>다음과 같습니다.
<interface>- 기본 네트워크 인터페이스 이름을 지정합니다.
<mtu>- 새 하드웨어 MTU 값을 지정합니다.
2.2.3. MachineConfig 오브젝트 생성
다음 절차에 따라 MachineConfig 오브젝트를 생성합니다.
프로세스
두 개의
MachineConfig오브젝트를 생성합니다. 하나는 컨트롤 플레인 노드용이고 다른 하나는 클러스터의 작업자 노드에 사용됩니다.control-plane-interface.bu파일에 다음 Butane 구성을 생성합니다.참고구성 파일에 지정하는 Butane 버전이 OpenShift Container Platform 버전과 일치해야 하며 항상
0으로 끝나야 합니다. 예:4.18.0. Butane에 대한 자세한 내용은 “Butane 을 사용하여 머신 구성 생성”을 참조하십시오.variant: openshift version: 4.18.0 metadata: name: 01-control-plane-interface labels: machineconfiguration.openshift.io/role: master storage: files: - path: /etc/NetworkManager/conf.d/99-<interface>-mtu.conf1 contents: local: <interface>-mtu.conf2 mode: 0600worker-interface.bu파일에 다음 Butane 구성을 생성합니다.참고구성 파일에 지정하는 Butane 버전이 OpenShift Container Platform 버전과 일치해야 하며 항상
0으로 끝나야 합니다. 예:4.18.0. Butane에 대한 자세한 내용은 “Butane 을 사용하여 머신 구성 생성”을 참조하십시오.variant: openshift version: 4.18.0 metadata: name: 01-worker-interface labels: machineconfiguration.openshift.io/role: worker storage: files: - path: /etc/NetworkManager/conf.d/99-<interface>-mtu.conf1 contents: local: <interface>-mtu.conf2 mode: 0600
다음 명령을 실행하여 Butane 구성에서
MachineConfig오브젝트를 생성합니다.$ for manifest in control-plane-interface worker-interface; do butane --files-dir . $manifest.bu > $manifest.yaml done주의이 절차의 뒷부분에서 명시적으로 지시할 때까지 이러한 머신 구성을 적용하지 마십시오. 이러한 머신 구성을 적용하면 클러스터에 대한 안정성이 손실됩니다.
2.2.4. MTU 마이그레이션 시작
다음 절차에 따라 MTU 마이그레이션을 시작합니다.
프로세스
MTU 마이그레이션을 시작하려면 다음 명령을 입력하여 마이그레이션 구성을 지정합니다. Machine Config Operator는 MTU 변경을 준비하기 위해 클러스터에서 노드를 롤링 재부팅합니다.
$ oc patch Network.operator.openshift.io cluster --type=merge --patch \
  '{"spec": { "migration": { "mtu": { "network": { "from": <overlay_from>, "to": <overlay_to> } , "machine": { "to" : <machine_to> } } } } }'
다음과 같습니다.
<overlay_from>- 현재 클러스터 네트워크 MTU 값을 지정합니다.
<overlay_to>-
클러스터 네트워크의 대상 MTU를 지정합니다. 이 값은
<machine_to>값을 기준으로 설정됩니다. OVN-Kubernetes의 경우 이 값은<machine_to>값보다100미만이어야 합니다. <machine_to>- 기본 호스트 네트워크의 기본 네트워크 인터페이스에 대한 MTU를 지정합니다.
$ oc patch Network.operator.openshift.io cluster --type=merge --patch \
  '{"spec": { "migration": { "mtu": { "network": { "from": 1400, "to": 9000 } , "machine": { "to" : 9100} } } } }'
Machine Config Operator가 각 머신 구성 풀에서 머신을 업데이트할 때 Operator는 각 노드를 하나씩 재부팅합니다. 모든 노드가 업데이트될 때까지 기다려야 합니다. 다음 명령을 입력하여 머신 구성 풀 상태를 확인합니다.
$ oc get machineconfigpools업데이트된 노드의 상태가
UPDATED=true,UPDATING=false,DEGRADED=false입니다.참고기본적으로 Machine Config Operator는 풀당 한 번에 하나의 머신을 업데이트하여 클러스터 크기에 따라 마이그레이션에 걸리는 총 시간을 늘립니다.
2.2.5. 머신 구성 확인
다음 절차에 따라 머신 구성을 확인합니다.
프로세스
호스트의 새 머신 구성 상태를 확인합니다.
머신 구성 상태 및 적용된 머신 구성 이름을 나열하려면 다음 명령을 입력합니다.
$ oc describe node | egrep "hostname|machineconfig"출력 예
kubernetes.io/hostname=master-0
machineconfiguration.openshift.io/currentConfig: rendered-master-c53e221d9d24e1c8bb6ee89dd3d8ad7b
machineconfiguration.openshift.io/desiredConfig: rendered-master-c53e221d9d24e1c8bb6ee89dd3d8ad7b
machineconfiguration.openshift.io/reason:
machineconfiguration.openshift.io/state: Done
다음 구문이 올바른지 확인합니다.
-
machineconfiguration.openshift.io/state필드의 값은Done입니다. -
machineconfiguration.openshift.io/currentConfig필드의 값은machineconfiguration.openshift.io/desiredConfig필드의 값과 동일합니다.
-
머신 구성이 올바른지 확인하려면 다음 명령을 입력합니다.
$ oc get machineconfig <config_name> -o yaml | grep ExecStart다음과 같습니다.
<config_name>-
machineconfiguration.openshift.io/currentConfig필드에서 머신 구성의 이름을 지정합니다.
머신 구성은 다음 업데이트를 systemd 구성에 포함해야 합니다.
ExecStart=/usr/local/bin/mtu-migration.sh
2.2.6. 새 하드웨어 MTU 값 적용
새 하드웨어 최대 전송 단위(MTU) 값을 적용하려면 다음 절차를 사용하십시오.
프로세스
기본 네트워크 인터페이스 MTU 값을 업데이트합니다.
NetworkManager 연결 구성을 사용하여 새 MTU를 지정하는 경우 다음 명령을 입력합니다. MachineConfig Operator는 클러스터에서 노드의 롤링 재부팅을 자동으로 수행합니다.
$ for manifest in control-plane-interface worker-interface; do oc create -f $manifest.yaml done- DHCP 서버 옵션 또는 커널 명령줄 및 PXE로 새 MTU를 지정하는 경우 인프라에 필요한 변경을 수행합니다.
Machine Config Operator가 각 머신 구성 풀에서 머신을 업데이트할 때 Operator는 각 노드를 하나씩 재부팅합니다. 모든 노드가 업데이트될 때까지 기다려야 합니다. 다음 명령을 입력하여 머신 구성 풀 상태를 확인합니다.
$ oc get machineconfigpools업데이트된 노드의 상태가
UPDATED=true,UPDATING=false,DEGRADED=false입니다.참고기본적으로 Machine Config Operator는 풀당 한 번에 하나의 머신을 업데이트하여 클러스터 크기에 따라 마이그레이션에 걸리는 총 시간을 늘립니다.
호스트의 새 머신 구성 상태를 확인합니다.
머신 구성 상태 및 적용된 머신 구성 이름을 나열하려면 다음 명령을 입력합니다.
$ oc describe node | egrep "hostname|machineconfig"출력 예
kubernetes.io/hostname=master-0
machineconfiguration.openshift.io/currentConfig: rendered-master-c53e221d9d24e1c8bb6ee89dd3d8ad7b
machineconfiguration.openshift.io/desiredConfig: rendered-master-c53e221d9d24e1c8bb6ee89dd3d8ad7b
machineconfiguration.openshift.io/reason:
machineconfiguration.openshift.io/state: Done
다음 구문이 올바른지 확인합니다.
-
machineconfiguration.openshift.io/state필드의 값은Done입니다. -
machineconfiguration.openshift.io/currentConfig필드의 값은machineconfiguration.openshift.io/desiredConfig필드의 값과 동일합니다.
-
머신 구성이 올바른지 확인하려면 다음 명령을 입력합니다.
$ oc get machineconfig <config_name> -o yaml | grep path:다음과 같습니다.
<config_name>-
machineconfiguration.openshift.io/currentConfig필드에서 머신 구성의 이름을 지정합니다.
머신 구성이 성공적으로 배포된 경우 이전 출력에는
/etc/NetworkManager/conf.d/99-<interface>-mtu.conf파일 경로와ExecStart=/usr/local/bin/mtu-migration.sh행이 포함됩니다.
2.2.7. MTU 마이그레이션 완료
다음 절차를 사용하여 MTU 마이그레이션을 완료합니다.
프로세스
MTU 마이그레이션을 완료하려면 OVN-Kubernetes 네트워크 플러그인에 대해 다음 명령을 입력합니다.
$ oc patch Network.operator.openshift.io cluster --type=merge --patch \
  '{"spec": { "migration": null, "defaultNetwork":{ "ovnKubernetesConfig": { "mtu": <mtu> }}}}'
다음과 같습니다.
<mtu>-
<
overlay_to>로 지정한 새 클러스터 네트워크 MTU를 지정합니다.
MTU 마이그레이션을 완료한 후 각 머신 구성 풀 노드는 하나씩 재부팅됩니다. 모든 노드가 업데이트될 때까지 기다려야 합니다. 다음 명령을 입력하여 머신 구성 풀 상태를 확인합니다.
$ oc get machineconfigpools업데이트된 노드의 상태가
UPDATED=true,UPDATING=false,DEGRADED=false입니다.
검증
클러스터 네트워크의 현재 MTU를 가져오려면 다음 명령을 입력합니다.
$ oc describe network.config cluster노드의 기본 네트워크 인터페이스에 대한 현재 MTU를 가져옵니다.
클러스터의 노드를 나열하려면 다음 명령을 입력합니다.
$ oc get nodes노드에서 기본 네트워크 인터페이스에 대한 현재 MTU 설정을 가져오려면 다음 명령을 입력합니다.
$ oc adm node-logs <node> -u ovs-configuration | grep configure-ovs.sh | grep mtu | grep <interface> | head -1다음과 같습니다.
<node>- 이전 단계의 출력에서 노드를 지정합니다.
<interface>- 노드의 기본 네트워크 인터페이스 이름을 지정합니다.
출력 예
ens3: <BROADCAST,MULTICAST,UP,LOWER_UP> mtu 8051
3장. SCTP(Stream Control Transmission Protocol) 사용
클러스터 관리자는 베어 메탈 클러스터에서 SCTP(Stream Control Transmission Protocol)를 사용할 수 있습니다.
3.1. OpenShift Container Platform에서 SCTP 지원
클러스터 관리자는 클러스터의 호스트에서 SCTP를 활성화 할 수 있습니다. RHCOS(Red Hat Enterprise Linux CoreOS)에서 SCTP 모듈은 기본적으로 비활성화되어 있습니다.
SCTP는 IP 네트워크에서 실행되는 안정적인 메시지 기반 프로토콜입니다.
활성화하면 Pod, 서비스, 네트워크 정책에서 SCTP를 프로토콜로 사용할 수 있습니다. type 매개변수를 ClusterIP 또는 NodePort 값으로 설정하여 Service를 정의해야 합니다.
3.1.1. SCTP 프로토콜을 사용하는 구성의 예
protocol 매개변수를 포드 또는 서비스 오브젝트의 SCTP 값으로 설정하여 SCTP를 사용하도록 포드 또는 서비스를 구성할 수 있습니다.
다음 예에서는 pod가 SCTP를 사용하도록 구성되어 있습니다.
apiVersion: v1
kind: Pod
metadata:
  namespace: project1
  name: example-pod
spec:
  containers:
    - name: example-pod
...
      ports:
        - containerPort: 30100
          name: sctpserver
          protocol: SCTP
다음 예에서는 서비스가 SCTP를 사용하도록 구성되어 있습니다.
apiVersion: v1
kind: Service
metadata:
  namespace: project1
  name: sctpserver
spec:
...
  ports:
    - name: sctpserver
      protocol: SCTP
      port: 30100
      targetPort: 30100
  type: ClusterIP
다음 예에서 NetworkPolicy 오브젝트는 특정 레이블이 있는 모든 Pod의 포트 80에서 SCTP 네트워크 트래픽에 적용되도록 구성되어 있습니다.
kind: NetworkPolicy
apiVersion: networking.k8s.io/v1
metadata:
  name: allow-sctp-on-http
spec:
  podSelector:
    matchLabels:
      role: web
  ingress:
  - ports:
    - protocol: SCTP
      port: 80
3.2. SCTP(스트림 제어 전송 프로토콜) 활성화
클러스터 관리자는 클러스터의 작업자 노드에 블랙리스트 SCTP 커널 모듈을 로드하고 활성화할 수 있습니다.
사전 요구 사항
-
OpenShift CLI(
oc)를 설치합니다. -
cluster-admin역할의 사용자로 클러스터에 액세스할 수 있어야 합니다.
프로세스
다음 YAML 정의가 포함된
load-sctp-module.yaml파일을 생성합니다.apiVersion: machineconfiguration.openshift.io/v1 kind: MachineConfig metadata: name: load-sctp-module labels: machineconfiguration.openshift.io/role: worker spec: config: ignition: version: 3.2.0 storage: files: - path: /etc/modprobe.d/sctp-blacklist.conf mode: 0644 overwrite: true contents: source: data:, - path: /etc/modules-load.d/sctp-load.conf mode: 0644 overwrite: true contents: source: data:,sctpMachineConfig오브젝트를 생성하려면 다음 명령을 입력합니다.$ oc create -f load-sctp-module.yaml선택 사항: MachineConfig Operator가 구성 변경 사항을 적용하는 동안 노드의 상태를 보려면 다음 명령을 입력합니다. 노드 상태가
Ready로 전환되면 구성 업데이트가 적용됩니다.$ oc get nodes
3.3. SCTP(Stream Control Transmission Protocol)의 활성화 여부 확인
SCTP 트래픽을 수신하는 애플리케이션으로 pod를 만들고 서비스와 연결한 다음, 노출된 서비스에 연결하여 SCTP가 클러스터에서 작동하는지 확인할 수 있습니다.
사전 요구 사항
-
클러스터에서 인터넷에 액세스하여
nc패키지를 설치합니다. -
OpenShift CLI(
oc)를 설치합니다. -
cluster-admin역할의 사용자로 클러스터에 액세스할 수 있어야 합니다.
프로세스
SCTP 리스너를 시작하는 포드를 생성합니다.
다음 YAML로 pod를 정의하는
sctp-server.yaml파일을 생성합니다.apiVersion: v1 kind: Pod metadata: name: sctpserver labels: app: sctpserver spec: containers: - name: sctpserver image: registry.access.redhat.com/ubi9/ubi command: ["/bin/sh", "-c"] args: ["dnf install -y nc && sleep inf"] ports: - containerPort: 30102 name: sctpserver protocol: SCTP다음 명령을 입력하여 pod를 생성합니다.
$ oc create -f sctp-server.yaml
SCTP 리스너 pod에 대한 서비스를 생성합니다.
다음 YAML을 사용하여 서비스를 정의하는
sctp-service.yaml파일을 생성합니다.apiVersion: v1 kind: Service metadata: name: sctpservice labels: app: sctpserver spec: type: NodePort selector: app: sctpserver ports: - name: sctpserver protocol: SCTP port: 30102 targetPort: 30102서비스를 생성하려면 다음 명령을 입력합니다.
$ oc create -f sctp-service.yaml
SCTP 클라이언트에 대한 pod를 생성합니다.
다음 YAML을 사용하여
sctp-client.yaml파일을 만듭니다.apiVersion: v1 kind: Pod metadata: name: sctpclient labels: app: sctpclient spec: containers: - name: sctpclient image: registry.access.redhat.com/ubi9/ubi command: ["/bin/sh", "-c"] args: ["dnf install -y nc && sleep inf"]Pod오브젝트를 생성하려면 다음 명령을 입력합니다.$ oc apply -f sctp-client.yaml
서버에서 SCTP 리스너를 실행합니다.
서버 Pod에 연결하려면 다음 명령을 입력합니다.
$ oc rsh sctpserverSCTP 리스너를 시작하려면 다음 명령을 입력합니다.
$ nc -l 30102 --sctp
서버의 SCTP 리스너에 연결합니다.
- 터미널 프로그램에서 새 터미널 창 또는 탭을 엽니다.
sctpservice서비스의 IP 주소를 얻습니다. 다음 명령을 실행합니다.$ oc get services sctpservice -o go-template='{{.spec.clusterIP}}{{"\n"}}'클라이언트 Pod에 연결하려면 다음 명령을 입력합니다.
$ oc rsh sctpclientSCTP 클라이언트를 시작하려면 다음 명령을 입력합니다.
<cluster_IP>를sctpservice서비스의 클러스터 IP 주소로 변경합니다.# nc <cluster_IP> 30102 --sctp
4장. 보조 인터페이스 지표와 네트워크 연결 연관 짓기
관리자는 pod_network_info 지표를 사용하여 보조 네트워크 인터페이스를 분류하고 모니터링할 수 있습니다. 지표는 일반적으로 연결된 NetworkAttachmentDefinition 리소스를 기반으로 인터페이스 유형을 식별하는 레이블을 추가하여 이 작업을 수행합니다.
4.1. 모니터링을 위한 보조 네트워크 메트릭 확장
보조 장치 또는 인터페이스는 다양한 용도로 사용됩니다. 효과적인 집계 및 모니터링을 허용하려면 보조 네트워크 인터페이스의 지표를 분류해야 합니다.
노출된 지표는 인터페이스를 포함하지만 인터페이스가 시작되는 위치는 지정하지 않습니다. 추가 인터페이스가 없는 경우 이 작업을 수행할 수 있습니다. 그러나 인터페이스 이름에만 의존하는 것은 목적을 식별하고 메트릭을 효과적으로 사용하기 어렵기 때문에 보조 인터페이스를 추가할 때 문제가 됩니다.
보조 인터페이스를 추가할 때 해당 이름은 추가 순서에 따라 달라집니다. 보조 인터페이스는 각각 다른 목적을 제공할 수 있는 별도의 네트워크에 속할 수 있습니다.
pod_network_name_info 를 사용하면 인터페이스 유형을 식별하는 추가 정보를 사용하여 현재 지표를 확장할 수 있습니다. 이러한 방식으로 지표를 집계하고 특정 인터페이스 유형에 특정 경보를 추가할 수 있습니다.
네트워크 유형은 NetworkAttachmentDefinition 리소스의 이름과 생성되며 서로 다른 보조 네트워크 클래스를 구분합니다. 예를 들어 서로 다른 네트워크에 속하거나 서로 다른 CNI를 사용하는 서로 다른 인터페이스는 서로 다른 네트워크 연결 정의 이름을 사용합니다.
4.2. 네트워크 지표 데몬
네트워크 지표 데몬은 네트워크 관련 지표를 수집하고 게시하는 데몬 구성 요소입니다.
kubelet은 이미 관찰 가능한 네트워크 관련 지표를 게시하고 있습니다. 이러한 지표는 다음과 같습니다.
-
container_network_receive_bytes_total -
container_network_receive_errors_total -
container_network_receive_packets_total -
container_network_receive_packets_dropped_total -
container_network_transmit_bytes_total -
container_network_transmit_errors_total -
container_network_transmit_packets_total -
container_network_transmit_packets_dropped_total
이러한 지표의 레이블에는 다음이 포함됩니다.
- 포드 이름
- 포드 네임스페이스
-
인터페이스 이름(예:
eth0)
이러한 지표는 예를 들면 Multus를 통해 Pod에 새 인터페이스를 추가할 때까지는 인터페이스 이름이 무엇을 나타내는지 명확하지 않기 때문에 잘 작동합니다.
인터페이스 레이블은 인터페이스 이름을 나타내지만 해당 인터페이스가 무엇을 의미하는지는 명확하지 않습니다. 인터페이스가 다양한 경우 모니터링 중인 지표에서 어떤 네트워크를 참조하는지 파악하기란 불가능합니다.
이 문제는 다음 섹션에 설명된 새로운 pod_network_name_info를 도입하여 해결됩니다.
4.3. 네트워크 이름이 있는 지표
네트워크 지표 데몬 세트에서는 고정 값이 0 인 pod_network_name_info 게이지 지표를 게시합니다.
pod_network_name_info의 예
pod_network_name_info{interface="net0",namespace="namespacename",network_name="nadnamespace/firstNAD",pod="podname"} 0네트워크 이름 레이블은 Multus에서 추가한 주석을 사용하여 생성됩니다. 네트워크 연결 정의가 속하는 네임스페이스와 네트워크 연결 정의의 이름입니다.
새 지표 단독으로는 많은 가치를 제공하지 않지만 네트워크 관련 container_network_* 지표와 결합되는 경우 보조 네트워크 모니터링을 더 잘 지원합니다.
다음과 같은 promql 쿼리를 사용하면 값이 포함된 새 메트릭과 k8s.v1.cni.cncf.io/network-status 주석에서 검색된 네트워크 이름을 가져올 수 있습니다.
(container_network_receive_bytes_total) + on(namespace,pod,interface) group_left(network_name) ( pod_network_name_info )
(container_network_receive_errors_total) + on(namespace,pod,interface) group_left(network_name) ( pod_network_name_info )
(container_network_receive_packets_total) + on(namespace,pod,interface) group_left(network_name) ( pod_network_name_info )
(container_network_receive_packets_dropped_total) + on(namespace,pod,interface) group_left(network_name) ( pod_network_name_info )
(container_network_transmit_bytes_total) + on(namespace,pod,interface) group_left(network_name) ( pod_network_name_info )
(container_network_transmit_errors_total) + on(namespace,pod,interface) group_left(network_name) ( pod_network_name_info )
(container_network_transmit_packets_total) + on(namespace,pod,interface) group_left(network_name) ( pod_network_name_info )
(container_network_transmit_packets_dropped_total) + on(namespace,pod,interface) group_left(network_name)
5장. PTP 하드웨어 사용
5.1. OpenShift 클러스터 노드의 정확한 시간 프로토콜 정보
PTP(Precision Time Protocol)는 네트워크의 클럭을 동기화하는 데 사용됩니다. 하드웨어 지원과 함께 사용할 경우 PTP는 마이크로초 미만의 정확성을 수행할 수 있으며 NTP(Network Time Protocol)보다 더 정확합니다.
PTP가 있는 openshift-sdn 클러스터에서 하드웨어 타임스탬프에 UDP(User Datagram Protocol)를 사용하고 OVN-Kubernetes 플러그인으로 마이그레이션하는 경우 OVS(Open vSwitch) 브리지와 같은 기본 인터페이스 장치에 하드웨어 타임스탬프를 적용할 수 없습니다. 결과적으로 UDP 버전 4 구성은 br-ex 인터페이스에서 작동할 수 없습니다.
OpenShift Container Platform 클러스터 노드에서 linuxptp 서비스를 구성하고 PTP 가능 하드웨어를 사용할 수 있습니다.
PTP Operator를 배포하여 OpenShift Container Platform 웹 콘솔 또는ocCLI(OpenShift CLI)를 사용하여 PTP를 설치합니다. PTP Operator는 linuxptp 서비스를 생성 및 관리하고 다음 기능을 제공합니다.
- 클러스터에서 PTP 가능 장치 검색.
-
linuxptp서비스의 구성 관리. -
PTP Operator
cloud-event-proxy사이드카를 사용하여 애플리케이션의 성능 및 안정성에 부정적인 영향을 주는 PTP 클록 이벤트 알림
PTP Operator는 베어 메탈 인프라에서만 프로비저닝된 클러스터에서 PTP 가능 장치와 함께 작동합니다.
5.1.1. PTP 도메인의 요소
PTP는 네트워크에 연결된 여러 노드를 각 노드의 클럭과 동기화하는 데 사용됩니다. PTP에 의해 동기화된 클록은 리더 후속 계층 구조로 구성됩니다. 계층 구조는 모든 클럭에서 실행되는 최상의 마스터 클럭(BMC) 알고리즘에 의해 자동으로 생성되고 업데이트됩니다. 후속 클럭은 리더 클록과 동기화되며 후속 클럭은 다른 다운스트림 클록의 소스가 될 수 있습니다.
그림 5.1. 네트워크의 PTP 노드

다음은 3가지 기본 PTP 클록 유형에 대해 설명합니다.
- GRandmaster 클록
- 마스터 클록은 네트워크의 다른 클록에 표준 시간 정보를 제공하며 정확하고 안정적인 동기화를 보장합니다. 타임스탬프를 작성하고 다른 클록의 시간 요청에 응답합니다. Grandmaster 클럭은 GNSS(Global Navigation Satellite System) 시간 소스와 동기화됩니다. Grandmaster 클록은 네트워크에서 신뢰할 수 있는 시간 소스이며 다른 모든 장치에 시간 동기화를 제공할 책임이 있습니다.
- 경계 클록
- 경계 클록에는 두 개 이상의 통신 경로에 포트가 있으며, 동시에 소스와 다른 대상 클록의 대상일 수 있습니다. 경계 클록은 대상 클록으로 작동합니다. 대상 클럭이 타이밍 메시지를 수신하고 지연을 조정한 다음 네트워크를 전달하기 위한 새 소스 시간 신호를 생성합니다. 경계 클록은 소스 클록과 정확하게 동기화되는 새로운 타이밍 패킷을 생성하며 소스 클럭에 직접 보고하는 연결된 장치의 수를 줄일 수 있습니다.
- 일반 클록
- 일반 클록에는 네트워크의 위치에 따라 소스 또는 대상 클록의 역할을 수행할 수 있는 단일 포트가 연결되어 있습니다. 일반 클록은 타임스탬프를 읽고 쓸 수 있습니다.
5.1.1.1. NTP를 통한 PTP의 이점
PTP가 NTP를 능가하는 주요 이점 중 하나는 다양한 NIC(네트워크 인터페이스 컨트롤러) 및 네트워크 스위치에 있는 하드웨어 지원입니다. 특수 하드웨어를 사용하면 PTP가 메시지 전송 지연을 고려하여 시간 동기화의 정확성을 향상시킬 수 있습니다. 최대한의 정확성을 달성하려면 PTP 클록 사이의 모든 네트워킹 구성 요소를 PTP 하드웨어를 사용하도록 설정하는 것이 좋습니다.
NIC는 전송 및 수신 즉시 PTP 패킷을 타임스탬프할 수 있으므로 하드웨어 기반 PTP는 최적의 정확성을 제공합니다. 이를 운영 체제에서 PTP 패킷을 추가로 처리해야 하는 소프트웨어 기반 PTP와 비교합니다.
PTP를 활성화하기 전에 필수 노드에 대해 NTP가 비활성화되어 있는지 확인합니다. MachineConfig 사용자 정의 리소스를 사용하여 chrony 타임 서비스 (chronyd)를 비활성화할 수 있습니다. 자세한 내용은 chrony 타임 서비스 비활성화를 참조하십시오.
5.1.2. OpenShift Container Platform 노드에서 linuxptp 및 gpsd 개요
OpenShift Container Platform은 높은 정밀 네트워크 동기화를 위해 linuxptp 및 gpsd 패키지와 함께 PTP Operator를 사용합니다. linuxptp 패키지는 네트워크에서 PTP 타이밍을 위한 툴과 데몬을 제공합니다. GNSS(Global Navigation Satellite System)가 있는 클러스터 호스트는 gpsd 를 사용하여 GNSS 클럭 소스와 상호 작용할 수 있습니다.
linuxptp 패키지에는 시스템 클럭 동기화를 위한 ts2phc,pmc,ptp4l, phc2sys 프로그램이 포함되어 있습니다.
- ts2phc
ts2phc는 PTP 장치에서 PTP 하드웨어 클럭(PHC)을 높은 수준의 정확성으로 동기화합니다.ts2phc는 마스터 클록 구성에 사용됩니다. 정확한 타이밍은 GNSS(Global Navigation Satellite System)와 같은 높은 정확도의 클럭 소스를 신호로 수신합니다. GNSS는 대규모 분산 네트워크에서 사용하기 위해 정확하고 신뢰할 수 있는 동기화 시간 소스를 제공합니다. GNSS 클록은 일반적으로 몇 나노초의 정확도로 시간 정보를 제공합니다.ts2phc시스템 데몬은 할드마스터 클록에서 시간 정보를 읽고 CryostatC 형식으로 변환하여 네트워크의 다른 PTP 장치로 타이밍 정보를 보냅니다. CryostatC 시간은 네트워크의 다른 장치에서 시계를 마스터 클록과 동기화하는 데 사용됩니다.- pmc
-
PMC는 IEEE 표준 1588.1588에 따라 PTP 관리 클라이언트(pmc)를 구현합니다.PMC는ptp4l시스템 데몬에 대한 기본 관리 액세스를 제공합니다.PMC는 표준 입력에서 읽고 선택한 전송을 통해 출력을 전송하여 수신하는 응답을 출력합니다. - ptp4l
ptp4l은 PTP 경계 클록과 일반 클록을 구현하고 시스템 데몬으로 실행됩니다.ptp4l은 다음을 수행합니다.- 하드웨어 타임스탬프를 사용하여 소스 클록과 synchronizes the source clock with hardware time stamping
- 소프트웨어 타임스탬프를 사용하여 시스템 클록을 소스 클록에 동기화
- phc2sys
-
phc2sys는 네트워크 인터페이스 컨트롤러(NIC)의 CryostatC에 시스템 시계를 동기화합니다.phc2sys시스템 데몬은 타이밍 정보를 지속적으로 모니터링합니다. 타이밍 오류를 감지하면 CryostatC가 시스템 시계를 수정합니다.
gpsd 패키지에는 호스트 클럭과 GNSS 클럭 동기화를 위한 ubxtool,gspipe,gpsd 프로그램이 포함되어 있습니다.
- ubxtool
-
ubxtoolCLI를 사용하면 u-blox GPS 시스템과 통신할 수 있습니다.ubxtoolCLI는 u-blox 바이너리 프로토콜을 사용하여 GPS와 통신합니다. - gpspipe
-
gpspipe는gpsd출력에 연결하여stdout에 파이프합니다. - gpsd
-
GPSD는 호스트에 연결된 하나 이상의 GPS 또는 AIS 수신기를 모니터링하는 서비스 데몬입니다.
5.1.3. PTP 할 마스터 클록에 대한 GNSS 타이밍 개요
OpenShift Container Platform은 클러스터에서 GNSS(Global Navigation Satellite System) 소스 및 마스터 클록(T-GM)에서 정확한 PTP 타이밍을 수신할 수 있습니다.
OpenShift Container Platform은 Intel E810 Westport 채널 NIC가 있는 GNSS 소스의 PTP 타이밍만 지원합니다.
그림 5.2. GNSS 및 T-GM과의 동기화 개요

- GNSS(Global navigation Satellite System)
GNSS는 전 세계 수신기에 위치 지정, 탐색 및 타이밍 정보를 제공하는 데 사용되는 Satellite 기반 시스템입니다. PTP에서 GNSS 수신기는 종종 매우 정확하고 안정적인 참조 클록 소스로 사용됩니다. 이러한 수신기는 여러 GNSS Satellite에서 신호를 수신하므로 정확한 시간 정보를 계산할 수 있습니다. GNSS에서 얻은 타이밍 정보는 PTP 할 마스터 클록에 의해 참조로 사용됩니다.
GNSS를 참조로 사용하면 PTP 네트워크의 마스터 클록은 다른 장치에 매우 정확한 타임스탬프를 제공하여 전체 네트워크에서 정확한 동기화를 가능하게 할 수 있습니다.
- Digital Phase-Locked Cryostat (DPLL)
- DPLL은 네트워크의 다양한 PTP 노드 간에 클럭 동기화를 제공합니다. DPLL은 로컬 시스템 클럭 신호의 단계를 들어오는 동기화 신호의 단계와 비교합니다(예: PTP 할 마스터 클록에서 PTP 메시지). DPLL은 로컬 클럭과 참조 클록 사이의 단계 차이를 최소화하기 위해 현지 클록 빈도 및 단계를 지속적으로 조정합니다.
5.1.3.1. GNSS 동기화 PTP grandmaster 클록에서 윤초 이벤트 처리
윤초는 국제 Atomic Time(TAI)과 동기화된 유지를 위해 UTC(Coordinated Universal Time)에 때때로 적용되는 1초 조정입니다. UTC 윤초는 예측할 수 없습니다. 국제적으로 합의된 윤초는 leap-seconds.list 에 나열됩니다. 이 파일은 IERS(International Earth Rotation and Reference Systems Service)에 의해 정기적으로 업데이트됩니다. 처리되지 않은 윤초는 훨씬 엣지 RAN 네트워크에 상당한 영향을 미칠 수 있습니다. 이를 통해 far edge RAN 애플리케이션이 즉시 음성 통화 및 데이터 세션의 연결을 끊을 수 있습니다.
5.1.4. PTP 및 클럭 동기화 오류 이벤트 정보
vRAN(가상 RAN)과 같은 클라우드 네이티브 애플리케이션에서는 전체 네트워크의 작동에 중요한 하드웨어 타이밍 이벤트에 대한 알림에 액세스해야 합니다. PTP 클럭 동기화 오류는 대기 시간이 짧은 애플리케이션의 성능 및 안정성에 부정적인 영향을 미칠 수 있습니다(예: 분산 장치(DU)에서 실행되는 vRAN 애플리케이션).
PTP 동기화 손실은 RAN 네트워크에 심각한 오류입니다. 노드에서 동기화가 손실된 경우 라디오가 종료될 수 있으며 네트워크 Over the Air (OTA) 트래픽이 무선 네트워크의 다른 노드로 이동될 수 있습니다. 클러스터 노드에서 PTP 클럭 동기화 상태를 DU에서 실행 중인 vRAN 애플리케이션에 통신할 수 있도록 함으로써 이벤트 알림이 워크로드 오류와 비교하여 완화됩니다.
이벤트 알림은 동일한 DU 노드에서 실행되는 vRAN 애플리케이션에서 사용할 수 있습니다. 게시/서브스크립션 REST API는 이벤트 알림을 메시징 버스에 전달합니다. 게시/서브스크립션 메시징 또는 pub-sub 메시징은 주제에 게시된 모든 메시지가 주제에 대한 모든 구독자에 의해 즉시 수신되는 비동기 서비스 간 통신 아키텍처입니다.
PTP Operator는 모든 PTP 가능 네트워크 인터페이스에 대한 빠른 이벤트 알림을 생성합니다. HTTP 메시지 버스를 통해 cloud-event-proxy 사이드카 컨테이너를 사용하여 이벤트에 액세스할 수 있습니다.
PTP 빠른 이벤트 알림은 PTP 일반 클럭, PTP 할 마스터 클록 또는 PTP 경계 클록을 사용하도록 구성된 네트워크 인터페이스에 사용할 수 있습니다.
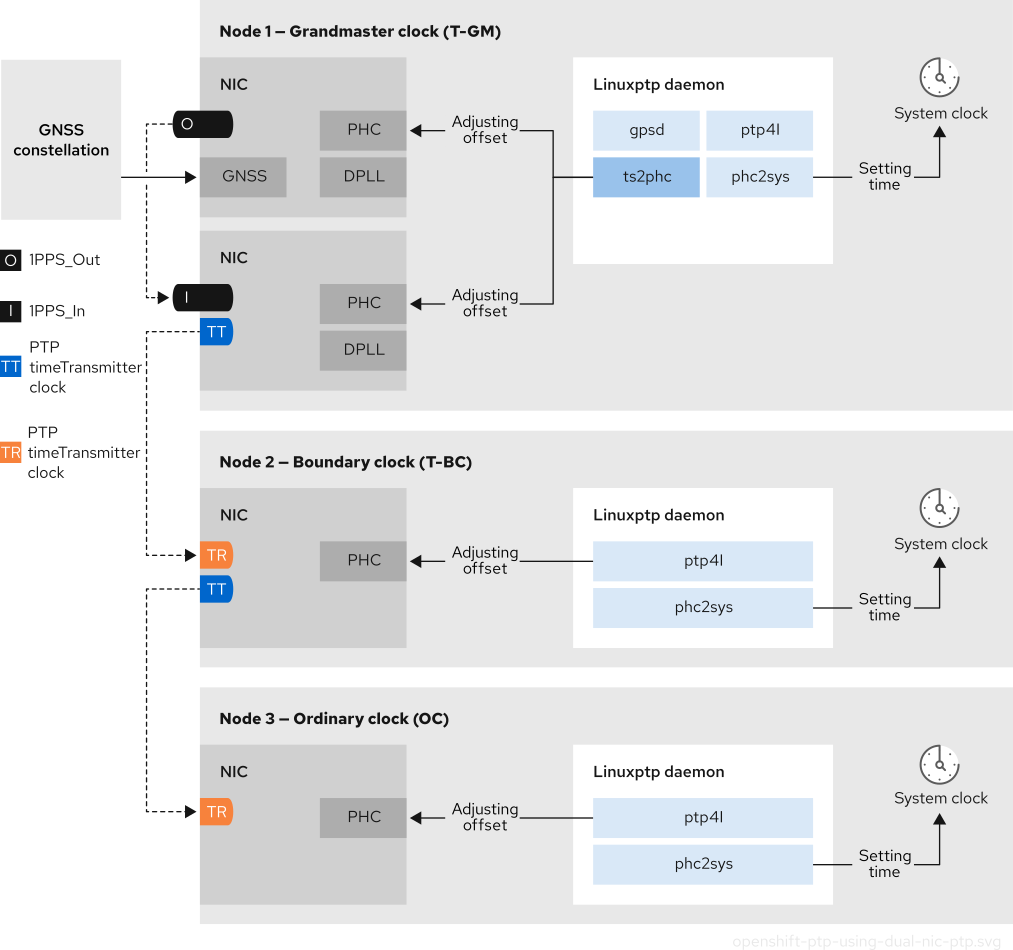
5.1.5. 2 카드 E810 NIC 구성 참조
OpenShift Container Platform은 T-GM (T-GM) 및 경계 클럭 (T-BC)의 PTP 타이밍을 위해 단일 및 듀얼 NIC Intel E810 하드웨어를 지원합니다.
- 듀얼 NIC 할드 마스터 클록
듀얼 NIC 하드웨어가 있는 클러스터 호스트를 PTP 할 마스터 클록으로 사용할 수 있습니다. 하나의 NIC는 글로벌 탐색 Satellite 시스템(GNSS)에서 타이밍 정보를 수신합니다. 두 번째 NIC는 E810 NIC faceplate에서 SMA1 Tx/Rx 연결을 사용하여 첫 번째 NIC에서 타이밍 정보를 수신합니다. 클러스터 호스트의 시스템 클럭은 GNSS satellite에 연결된 NIC에서 동기화됩니다.
듀얼 NIC 할 마스터 클록은 RRU(Remote radio Unit) 및 BBU(Baseband Unit)가 동일한 라디오 셀 사이트에 있는 분산 RAN(D-RAN) 구성의 기능입니다. D-RAN은 여러 사이트에 라디오 기능을 배포하고 이를 코어 네트워크에 백홀 연결로 연결합니다.
그림 5.3. 듀얼 NIC 할드 마스터 클록
 참고
참고듀얼 NIC T-GM 구성에서 단일
ts2phc프로그램은 각 NIC에 대해 하나씩 두 개의 PTP 하드웨어 클럭(PHC)에서 작동합니다.- 듀얼 NIC 경계 클록
중반 대역(VDU)을 제공하는 5G 통신 네트워크의 경우 각 가상 분산 장치(vDU)는 6개의 무선 장치(RU)에 대한 연결이 필요합니다. 이러한 연결을 위해 각 vDU 호스트에는 경계 클록으로 구성된 두 개의 NIC가 필요합니다.
듀얼 NIC 하드웨어를 사용하면 각 NIC가 다운스트림 클록에 대해 별도의
ptp4l인스턴스를 사용하여 각 NIC를 동일한 업스트림 리더 클록에 연결할 수 있습니다.- 듀얼 NIC 경계 클럭을 사용하는 고가용성 시스템 클럭
Intel E810-XXVDA4 Salem 채널 듀얼 NIC 하드웨어를 고가용성 시스템 클록에 대한 타이밍을 제공하는 듀얼 PTP 경계 클록으로 구성할 수 있습니다. 이 구성은 다른 NIC에 여러 시간 소스가 있는 경우 유용합니다. 고가용성을 통해 두 타이밍 소스 중 하나가 손실되거나 연결이 끊어진 경우 노드가 타이밍 동기화를 손실하지 않습니다.
각 NIC는 동일한 업스트림 리더 클록에 연결됩니다. 고가용성 경계 클록은 여러 PTP 도메인을 사용하여 대상 시스템 클록과 동기화합니다. T-BC를 고가용성으로 사용할 수 있는 경우 NIC CryostatC 클럭을 동기화하는 하나 이상의
ptp4l인스턴스가 실패하더라도 호스트 시스템 클럭이 올바른 오프셋을 유지할 수 있습니다. 단일 SFP 포트 또는 케이블 오류가 발생하면 경계 클록은 리더 클록과 동기화됩니다.경계 클럭 리더 소스 선택은 A-BMCA 알고리즘을 사용하여 수행됩니다. 자세한 내용은 ITU-T 권장 사항 G.8275.1 을 참조하십시오.
5.1.6. 듀얼 포트 NIC를 사용하여 PTP 일반 클록의 중복 개선
OpenShift Container Platform은 PTP 타이밍에 대해 단일 및 듀얼 포트 NIC(네트워크 인터페이스 카드)를 일반 클록으로 지원합니다. 중복성을 개선하기 위해 하나의 포트를 active로 사용하고 다른 하나는 대기 상태로 듀얼 포트 NIC를 구성할 수 있습니다.
이중 포트 NIC 중복을 사용하는 일반 클록으로 linuxptp 서비스를 구성하는 것은 기술 프리뷰 기능 전용입니다. 기술 프리뷰 기능은 Red Hat 프로덕션 서비스 수준 계약(SLA)에서 지원되지 않으며 기능적으로 완전하지 않을 수 있습니다. 따라서 프로덕션 환경에서 사용하는 것은 권장하지 않습니다. 이러한 기능을 사용하면 향후 제품 기능을 조기에 이용할 수 있어 개발 과정에서 고객이 기능을 테스트하고 피드백을 제공할 수 있습니다.
Red Hat 기술 프리뷰 기능의 지원 범위에 대한 자세한 내용은 기술 프리뷰 기능 지원 범위를 참조하십시오.
이 구성에서 듀얼 포트 NIC의 포트는 다음과 같이 작동합니다.
-
활성 포트는
다음포트 상태에서 일반 클록으로 작동합니다. -
대기 포트는
Listening포트 상태에 남아 있습니다. - 활성 포트가 실패하면 대기 포트가 활성 상태로 전환되어 계속 PTP 타이밍 동기화를 보장합니다.
-
두 포트 모두 결함이 발생하면 클럭 상태가
HOLDOVER상태로 이동하면 리더 클록으로 다시 동기화되기 전에 holdover 제한 시간이 만료될 때 freeRUN상태가 됩니다.
듀얼 포트 NIC만 있는 x86 아키텍처 노드에서 중복성을 추가하여 PTP 일반 클록을 구성할 수 있습니다.
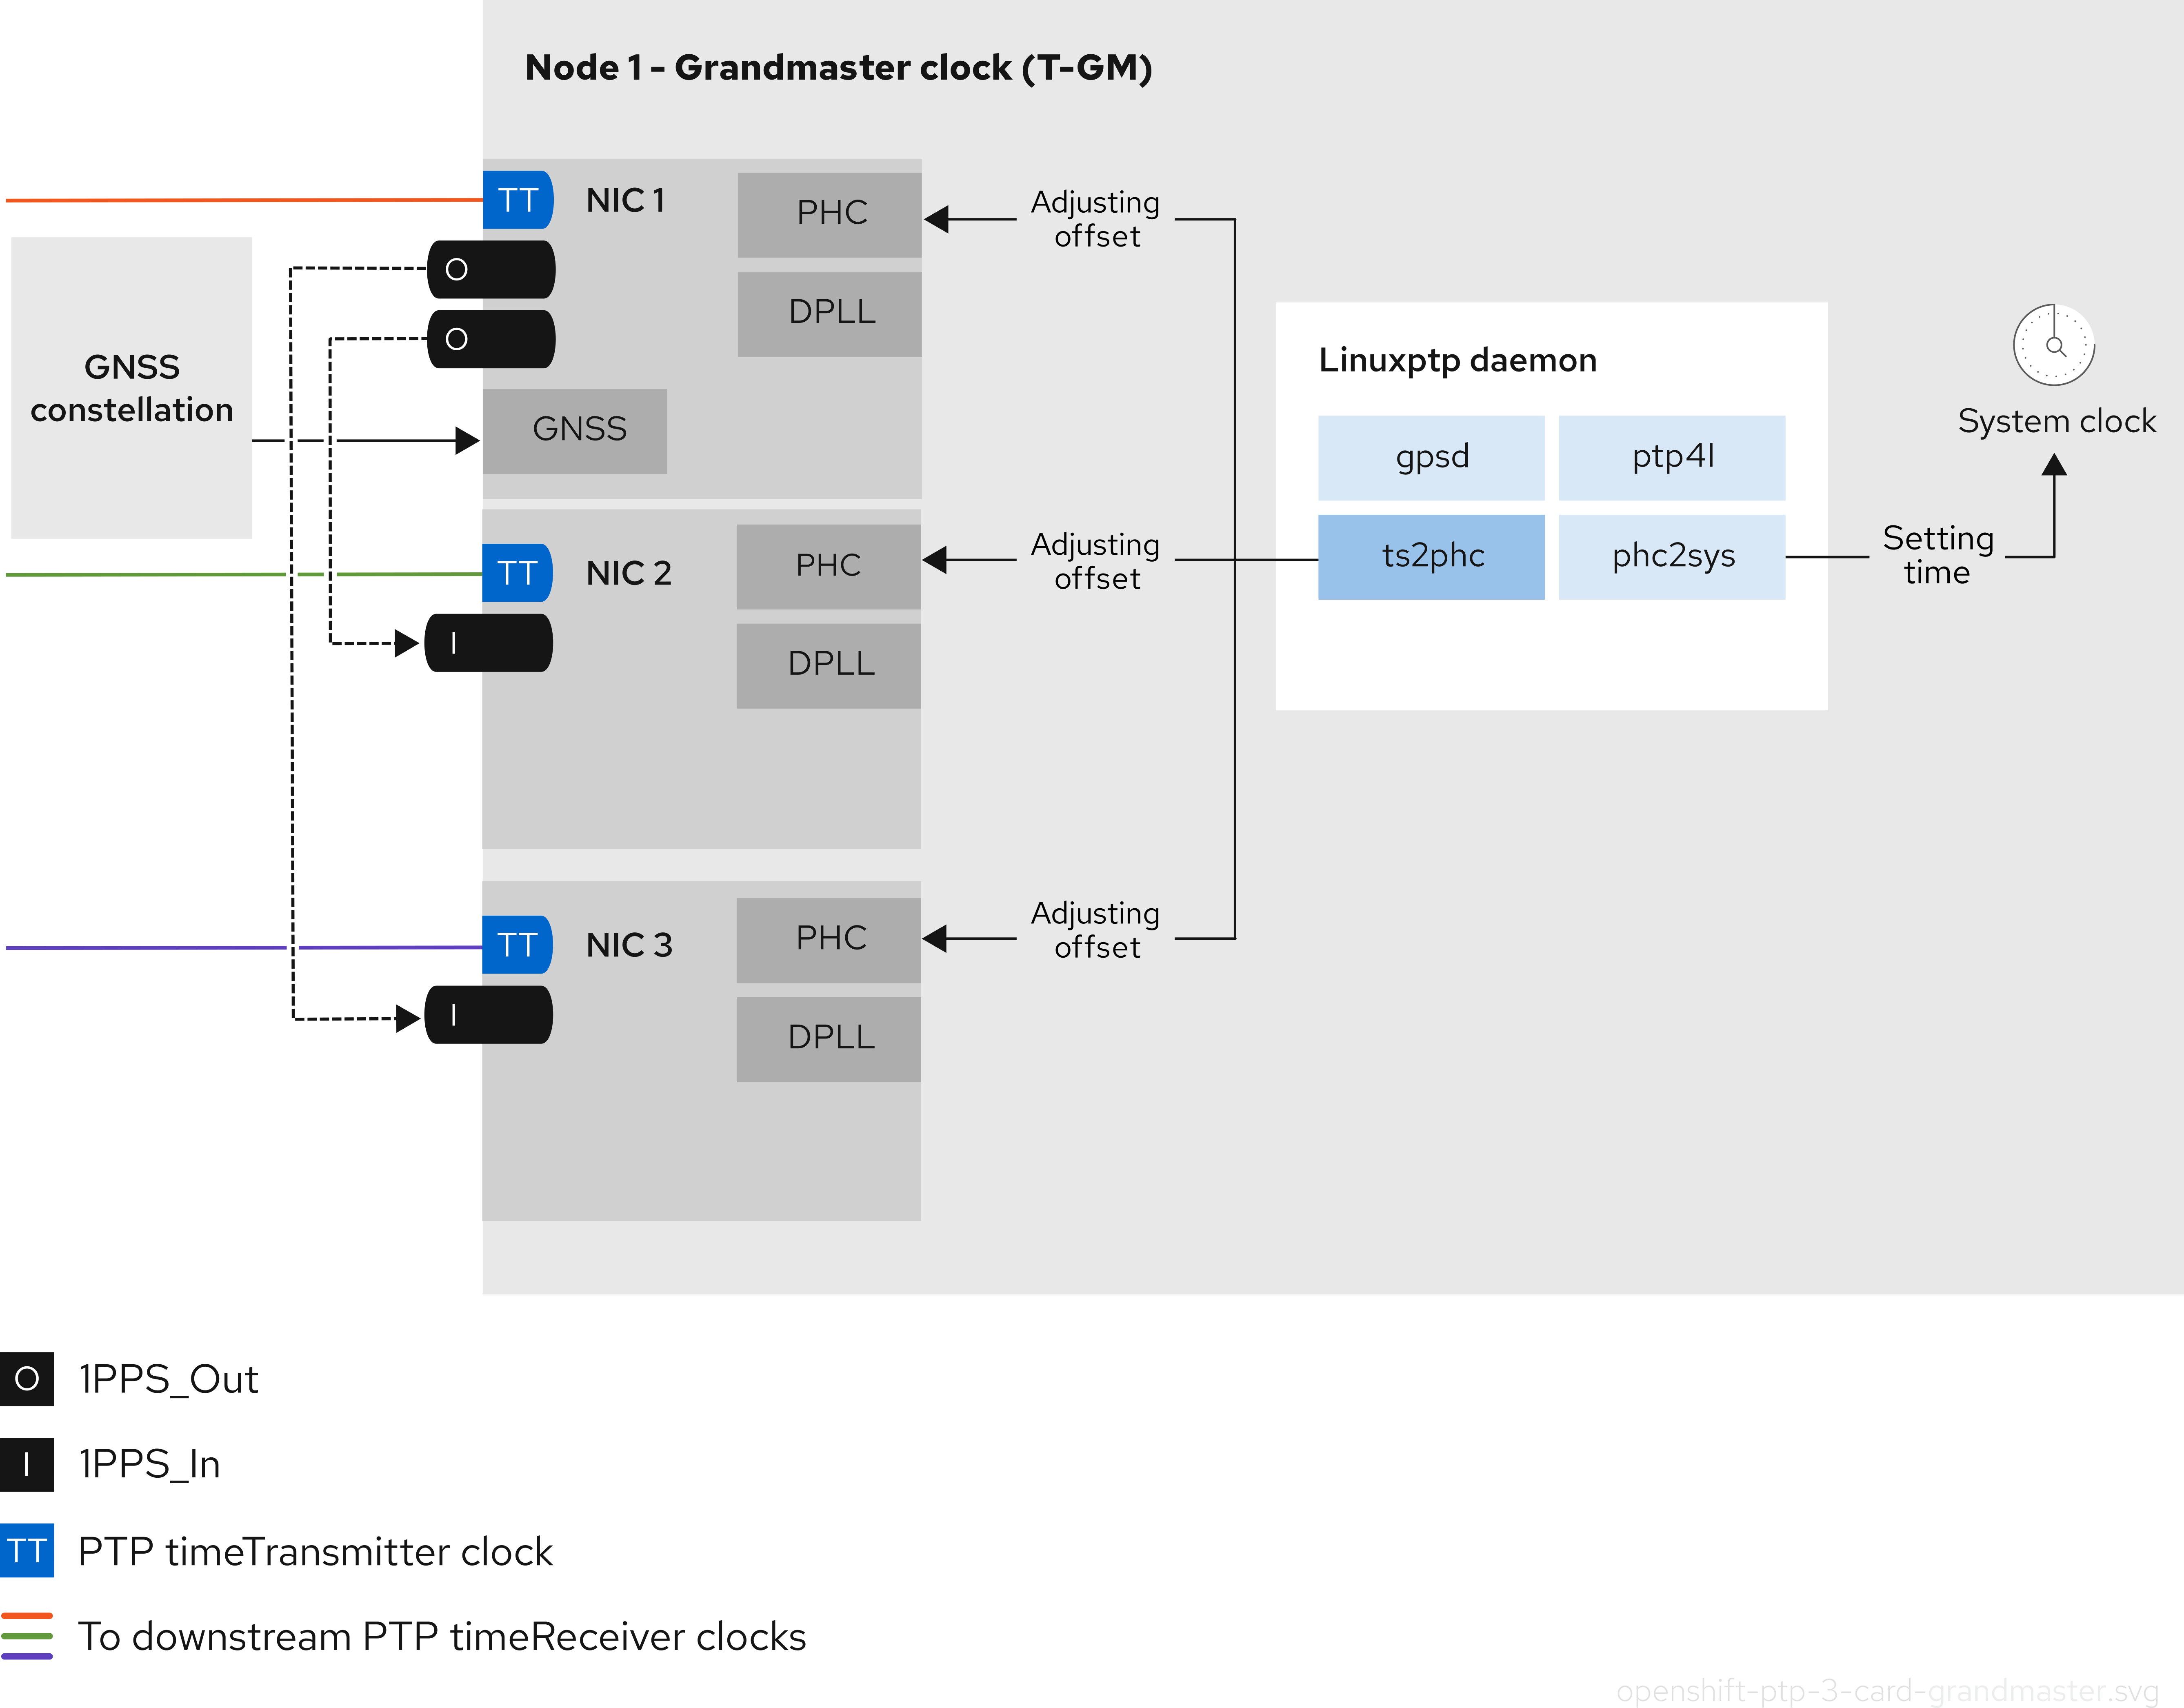
5.1.7. 3-card Intel E810 PTP grandmaster 클록
OpenShift Container Platform은 Intel E810 NIC가 PTP grandmaster 클럭(T-GM)인 클러스터 호스트를 지원합니다.
- 3 카드 할드 마스터 클록
NIC가 3개인 클러스터 호스트를 PTP 할 마스터 클록으로 사용할 수 있습니다. 하나의 NIC는 글로벌 탐색 Satellite 시스템(GNSS)에서 타이밍 정보를 수신합니다. 두 번째 및 세 번째 NIC는 E810 NIC faceplate에서 SMA1 Tx/Rx 연결을 사용하여 첫 번째 NIC에서 타이밍 정보를 수신합니다. 클러스터 호스트의 시스템 클럭은 GNSS satellite에 연결된 NIC에서 동기화됩니다.
3- 카드 NIC 할 마스터 클록은 분산 RAN (D-RAN) 구성에 사용할 수 있습니다. 여기서 radio Unit (RU)는 프론트 haul 스위치없이 분산 장치 (DU)에 직접 연결되어 있습니다. 예를 들어 RU와 DU가 동일한 라디오 셀 사이트에 있는 경우입니다. D-RAN은 여러 사이트에 라디오 기능을 배포하고 이를 코어 네트워크에 백홀 연결로 연결합니다.
그림 5.4. 3-card Intel E810 PTP grandmaster 클록
 참고
참고3 카드 T-GM 구성에서 단일
ts2phc프로세스는 시스템의 3ts2phc인스턴스로 보고합니다.
5.2. PTP 장치 구성
PTP Operator는 NodePtpDevice.ptp.openshift.io CRD(custom resource definition)를 OpenShift Container Platform에 추가합니다.
설치 시 PTP Operator는 각 노드에서 PTP(Precision Time Protocol) 가능 네트워크 장치를 클러스터에서 검색합니다. Operator는 호환되는 PTP 가능 네트워크 장치를 제공하는 각 노드에 대해 NodePtpDevice CR(사용자 정의 리소스) 오브젝트를 생성하고 업데이트합니다.
기본 제공 PTP 기능이 있는 NIC(네트워크 인터페이스 컨트롤러) 하드웨어에는 장치별 구성이 필요한 경우가 있습니다. PtpConfig CR(사용자 정의 리소스)에서 플러그인을 구성하여 PTP Operator에서 지원되는 하드웨어에 하드웨어별 NIC 기능을 사용할 수 있습니다. linuxptp-daemon 서비스는 plugin 스탠자에서 named 매개 변수를 사용하여 특정 하드웨어 구성에 따라 linuxptp 프로세스 ptp4l 및 phc2sys 를 시작합니다.
OpenShift Container Platform 4.18에서는 Intel E810 NIC가 PtpConfig 플러그인에서 지원됩니다.
5.2.1. CLI를 사용하여 PTP Operator 설치
클러스터 관리자는 CLI를 사용하여 Operator를 설치할 수 있습니다.
사전 요구 사항
- PTP를 지원하는 하드웨어가 있는 노드로 베어 메탈 하드웨어에 설치된 클러스터
-
OpenShift CLI(
oc)를 설치합니다. -
cluster-admin권한이 있는 사용자로 로그인합니다.
프로세스
PTP Operator의 네임스페이스를 생성합니다.
다음 YAML을
ptp-namespace.yaml파일에 저장합니다.apiVersion: v1 kind: Namespace metadata: name: openshift-ptp annotations: workload.openshift.io/allowed: management labels: name: openshift-ptp openshift.io/cluster-monitoring: "true"NamespaceCR을 생성합니다.$ oc create -f ptp-namespace.yaml
PTP Operator에 대한 Operator 그룹을 생성합니다.
다음 YAML을
ptp-operatorgroup.yaml파일에 저장합니다.apiVersion: operators.coreos.com/v1 kind: OperatorGroup metadata: name: ptp-operators namespace: openshift-ptp spec: targetNamespaces: - openshift-ptpOperatorGroupCR을 생성합니다.$ oc create -f ptp-operatorgroup.yaml
PTP Operator에 등록합니다.
다음 YAML을
ptp-sub.yaml파일에 저장합니다.apiVersion: operators.coreos.com/v1alpha1 kind: Subscription metadata: name: ptp-operator-subscription namespace: openshift-ptp spec: channel: "stable" name: ptp-operator source: redhat-operators sourceNamespace: openshift-marketplaceSubscriptionCR을 생성합니다.$ oc create -f ptp-sub.yaml
Operator가 설치되었는지 확인하려면 다음 명령을 입력합니다.
$ oc get csv -n openshift-ptp -o custom-columns=Name:.metadata.name,Phase:.status.phase출력 예
Name                         Phase
4.18.0-202301261535          Succeeded
5.2.2. 웹 콘솔을 사용하여 PTP Operator 설치
클러스터 관리자는 웹 콘솔을 사용하여 PTP Operator를 설치할 수 있습니다.
이전 섹션에서 언급한 것처럼 네임스페이스 및 Operator group을 생성해야 합니다.
프로세스
OpenShift Container Platform 웹 콘솔을 사용하여 PTP Operator를 설치합니다.
- OpenShift Container Platform 웹 콘솔에서 Operator → OperatorHub를 클릭합니다.
- 사용 가능한 Operator 목록에서 PTP Operator를 선택한 다음 설치를 클릭합니다.
- Operator 설치 페이지의 클러스터의 특정 네임스페이스에서 openshift-ptp를 선택합니다. 그런 다음, 설치를 클릭합니다.
선택 사항: PTP Operator가 설치되었는지 확인합니다.
- Operator → 설치된 Operator 페이지로 전환합니다.
PTP Operator가 openshift-ptp 프로젝트에 InstallSucceeded 상태로 나열되어 있는지 확인합니다.
참고설치 중에 Operator는 실패 상태를 표시할 수 있습니다. 나중에 InstallSucceeded 메시지와 함께 설치에 성공하면 이 실패 메시지를 무시할 수 있습니다.
Operator가 설치된 것으로 나타나지 않으면 다음과 같이 추가 문제 해결을 수행합니다.
- Operator → 설치된 Operator 페이지로 이동하고 Operator 서브스크립션 및 설치 계획 탭의 상태에 장애나 오류가 있는지 검사합니다.
-
Workloads → Pod 페이지로 이동하여
openshift-ptp프로젝트에서 Pod 로그를 확인합니다.
5.2.3. 클러스터에서 PTP 가능 네트워크 장치 검색
클러스터에 존재하는 PTP 가능 네트워크 장치를 식별하여 구성할 수 있습니다.
전제 조건
- PTP Operator를 설치했습니다.
프로세스
클러스터에서 PTP 가능 네트워크 장치의 전체 목록을 반환하려면 다음 명령을 실행합니다.
$ oc get NodePtpDevice -n openshift-ptp -o yaml출력 예
apiVersion: v1
items:
- apiVersion: ptp.openshift.io/v1
  kind: NodePtpDevice
  metadata:
    creationTimestamp: "2022-01-27T15:16:28Z"
    generation: 1
    name: dev-worker-0
1 namespace: openshift-ptp resourceVersion: "6538103" uid: d42fc9ad-bcbf-4590-b6d8-b676c642781a spec: {} status: devices:2 - name: eno1 - name: eno2 - name: eno3 - name: eno4 - name: enp5s0f0 - name: enp5s0f1 ...
5.2.4. linuxptp 서비스를 할 마스터 클록으로 구성
호스트 NIC를 구성하는 PtpConfig CR(사용자 정의 리소스)을 생성하여 linuxptp 서비스(ptp4l,phc2sys,ts2phc)를 마스터 클록(T-GM)으로 구성할 수 있습니다.
ts2phc 유틸리티를 사용하면 시스템 시계를 PTP 할 마스터 클록과 동기화하여 노드가 PTP 일반 클럭 및 경계 클록으로 정밀한 클럭을 스트리밍할 수 있습니다.
다음 예제 PtpConfig CR을 기반으로 하여 Intel Westport Channel E810-XXVDA4T 네트워크 인터페이스의 linuxptp 서비스를 T-GM으로 구성합니다.
PTP 빠른 이벤트를 구성하려면 ptp4lOpts,ptp4lConf 및 ptpClockThreshold 에 적절한 값을 설정합니다. ptpClockThreshold 는 이벤트가 활성화된 경우에만 사용됩니다. 자세한 내용은 " PTP 빠른 이벤트 알림 게시자 구성"을 참조하십시오.
사전 요구 사항
- 프로덕션 환경의 T-GM 클록의 경우 베어 메탈 클러스터 호스트에 Intel E810 Westport 채널 NIC를 설치합니다.
-
OpenShift CLI(
oc)를 설치합니다. -
cluster-admin권한이 있는 사용자로 로그인합니다. - PTP Operator를 설치합니다.
프로세스
PtpConfigCR을 생성합니다. 예를 들면 다음과 같습니다.요구 사항에 따라 배포에 다음 T-GM 구성 중 하나를 사용하십시오. YAML을
grandmaster-clock-ptp-config.yaml파일에 저장합니다.예 5.1. E810 NIC의 PTP 마스터 클럭 구성
apiVersion: ptp.openshift.io/v1 kind: PtpConfig metadata: name: grandmaster namespace: openshift-ptp annotations: {} spec: profile: - name: "grandmaster" ptp4lOpts: "-2 --summary_interval -4" phc2sysOpts: -r -u 0 -m -N 8 -R 16 -s $iface_master -n 24 ptpSchedulingPolicy: SCHED_FIFO ptpSchedulingPriority: 10 ptpSettings: logReduce: "true" plugins: e810: enableDefaultConfig: false settings: LocalMaxHoldoverOffSet: 1500 LocalHoldoverTimeout: 14400 MaxInSpecOffset: 1500 pins: $e810_pins # "$iface_master": # "U.FL2": "0 2" # "U.FL1": "0 1" # "SMA2": "0 2" # "SMA1": "0 1" ublxCmds: - args: #ubxtool -P 29.20 -z CFG-HW-ANT_CFG_VOLTCTRL,1 - "-P" - "29.20" - "-z" - "CFG-HW-ANT_CFG_VOLTCTRL,1" reportOutput: false - args: #ubxtool -P 29.20 -e GPS - "-P" - "29.20" - "-e" - "GPS" reportOutput: false - args: #ubxtool -P 29.20 -d Galileo - "-P" - "29.20" - "-d" - "Galileo" reportOutput: false - args: #ubxtool -P 29.20 -d GLONASS - "-P" - "29.20" - "-d" - "GLONASS" reportOutput: false - args: #ubxtool -P 29.20 -d BeiDou - "-P" - "29.20" - "-d" - "BeiDou" reportOutput: false - args: #ubxtool -P 29.20 -d SBAS - "-P" - "29.20" - "-d" - "SBAS" reportOutput: false - args: #ubxtool -P 29.20 -t -w 5 -v 1 -e SURVEYIN,600,50000 - "-P" - "29.20" - "-t" - "-w" - "5" - "-v" - "1" - "-e" - "SURVEYIN,600,50000" reportOutput: true - args: #ubxtool -P 29.20 -p MON-HW - "-P" - "29.20" - "-p" - "MON-HW" reportOutput: true - args: #ubxtool -P 29.20 -p CFG-MSG,1,38,248 - "-P" - "29.20" - "-p" - "CFG-MSG,1,38,248" reportOutput: true ts2phcOpts: " " ts2phcConf: | [nmea] ts2phc.master 1 [global] use_syslog 0 verbose 1 logging_level 7 ts2phc.pulsewidth 100000000 #cat /dev/GNSS to find available serial port #example value of gnss_serialport is /dev/ttyGNSS_1700_0 ts2phc.nmea_serialport $gnss_serialport [$iface_master] ts2phc.extts_polarity rising ts2phc.extts_correction 0 ptp4lConf: | [$iface_master] masterOnly 1 [$iface_master_1] masterOnly 1 [$iface_master_2] masterOnly 1 [$iface_master_3] masterOnly 1 [global] # # Default Data Set # twoStepFlag 1 priority1 128 priority2 128 domainNumber 24 #utc_offset 37 clockClass 6 clockAccuracy 0x27 offsetScaledLogVariance 0xFFFF free_running 0 freq_est_interval 1 dscp_event 0 dscp_general 0 dataset_comparison G.8275.x G.8275.defaultDS.localPriority 128 # # Port Data Set # logAnnounceInterval -3 logSyncInterval -4 logMinDelayReqInterval -4 logMinPdelayReqInterval 0 announceReceiptTimeout 3 syncReceiptTimeout 0 delayAsymmetry 0 fault_reset_interval -4 neighborPropDelayThresh 20000000 masterOnly 0 G.8275.portDS.localPriority 128 # # Run time options # assume_two_step 0 logging_level 6 path_trace_enabled 0 follow_up_info 0 hybrid_e2e 0 inhibit_multicast_service 0 net_sync_monitor 0 tc_spanning_tree 0 tx_timestamp_timeout 50 unicast_listen 0 unicast_master_table 0 unicast_req_duration 3600 use_syslog 1 verbose 0 summary_interval -4 kernel_leap 1 check_fup_sync 0 clock_class_threshold 7 # # Servo Options # pi_proportional_const 0.0 pi_integral_const 0.0 pi_proportional_scale 0.0 pi_proportional_exponent -0.3 pi_proportional_norm_max 0.7 pi_integral_scale 0.0 pi_integral_exponent 0.4 pi_integral_norm_max 0.3 step_threshold 2.0 first_step_threshold 0.00002 clock_servo pi sanity_freq_limit 200000000 ntpshm_segment 0 # # Transport options # transportSpecific 0x0 ptp_dst_mac 01:1B:19:00:00:00 p2p_dst_mac 01:80:C2:00:00:0E udp_ttl 1 udp6_scope 0x0E uds_address /var/run/ptp4l # # Default interface options # clock_type BC network_transport L2 delay_mechanism E2E time_stamping hardware tsproc_mode filter delay_filter moving_median delay_filter_length 10 egressLatency 0 ingressLatency 0 boundary_clock_jbod 0 # # Clock description # productDescription ;; revisionData ;; manufacturerIdentity 00:00:00 userDescription ; timeSource 0x20 recommend: - profile: "grandmaster" priority: 4 match: - nodeLabel: "node-role.kubernetes.io/$mcp"참고E810 Westport Channel NIC의 경우
ts2phc.nmea_serialport값을/dev/gnss0로 설정합니다.다음 명령을 실행하여 CR을 생성합니다.
$ oc create -f grandmaster-clock-ptp-config.yaml
검증
PtpConfig프로필이 노드에 적용되었는지 확인합니다.다음 명령을 실행하여
openshift-ptp네임스페이스에서 Pod 목록을 가져옵니다.$ oc get pods -n openshift-ptp -o wide출력 예
NAME                          READY   STATUS    RESTARTS   AGE     IP             NODE
linuxptp-daemon-74m2g         3/3     Running   3          4d15h   10.16.230.7    compute-1.example.com
ptp-operator-5f4f48d7c-x7zkf  1/1     Running   1          4d15h   10.128.1.145   compute-1.example.com
프로필이 올바른지 확인합니다.
PtpConfig프로필에 지정한 노드에 해당하는linuxptp데몬의 로그를 검사합니다. 다음 명령을 실행합니다.$ oc logs linuxptp-daemon-74m2g -n openshift-ptp -c linuxptp-daemon-container출력 예
ts2phc[94980.334]: [ts2phc.0.config] nmea delay: 98690975 ns
ts2phc[94980.334]: [ts2phc.0.config] ens3f0 extts index 0 at 1676577329.999999999 corr 0 src 1676577330.901342528 diff -1
ts2phc[94980.334]: [ts2phc.0.config] ens3f0 master offset         -1 s2 freq      -1
ts2phc[94980.441]: [ts2phc.0.config] nmea sentence: GNRMC,195453.00,A,4233.24427,N,07126.64420,W,0.008,,160223,,,A,V
phc2sys[94980.450]: [ptp4l.0.config] CLOCK_REALTIME phc offset       943 s2 freq  -89604 delay    504
phc2sys[94980.512]: [ptp4l.0.config] CLOCK_REALTIME phc offset      1000 s2 freq  -89264 delay    474
5.2.4.1. linuxptp 서비스를 듀얼 E810 NIC의 할마스터 클록으로 구성
NIC를 구성하는 PtpConfig CR(사용자 정의 리소스)을 2 E810 NIC의 grandmaster 클럭(T-GM)으로 linuxptp 서비스(ptp4l,phc2sys,ts2phc)를 구성할 수 있습니다.
다음 E810 NIC의 경우 linuxptp 서비스를 T-GM으로 구성할 수 있습니다.
- Intel E810-XXVDA4T Westport 채널 NIC
- Intel E810-CQDA2T Logan Beach NIC
분산 RAN(D-RAN) 사용 사례의 경우 다음과 같이 2개의 NIC에 대해 PTP를 구성할 수 있습니다.
- NIC 1은 GNSS(Global navigation satellite System) 시간 소스와 동기화됩니다.
-
NIC 2는 NIC가 제공하는 1PPS 타이밍 출력과 동기화됩니다. 이 구성은
PtpConfigCR의 PTP 하드웨어 플러그인에서 제공합니다.
2 카드 PTP T-GM 구성에서는 ptp4l 의 인스턴스 1개와 ts2phc 의 인스턴스 1개를 사용합니다. ptp4l 및 ts2phc 프로그램은 각각 NIC마다 하나씩 두 개의 PTP 하드웨어 클럭(PHC)에서 작동하도록 구성됩니다. 호스트 시스템 클록은 GNSS 시간 소스에 연결된 NIC에서 동기화됩니다.
다음 예제 PtpConfig CR을 기반으로 하여 이중 Intel E810 네트워크 인터페이스의 경우 linuxptp 서비스를 T-GM으로 구성합니다.
PTP 빠른 이벤트를 구성하려면 ptp4lOpts,ptp4lConf 및 ptpClockThreshold 에 적절한 값을 설정합니다. ptpClockThreshold 는 이벤트가 활성화된 경우에만 사용됩니다. 자세한 내용은 " PTP 빠른 이벤트 알림 게시자 구성"을 참조하십시오.
사전 요구 사항
- 프로덕션 환경의 T-GM 클록의 경우 베어 메탈 클러스터 호스트에 두 개의 Intel E810 NIC를 설치합니다.
-
OpenShift CLI(
oc)를 설치합니다. -
cluster-admin권한이 있는 사용자로 로그인합니다. - PTP Operator를 설치합니다.
프로세스
PtpConfigCR을 생성합니다. 예를 들면 다음과 같습니다.다음 YAML을
grandmaster-clock-ptp-config-dual-nics.yaml파일에 저장합니다.예 5.2. 듀얼 E810 NIC에 대한 PTP 마스터 클록 구성
# In this example two cards $iface_nic1 and $iface_nic2 are connected via # SMA1 ports by a cable and $iface_nic2 receives 1PPS signals from $iface_nic1 apiVersion: ptp.openshift.io/v1 kind: PtpConfig metadata: name: grandmaster namespace: openshift-ptp annotations: {} spec: profile: - name: "grandmaster" ptp4lOpts: "-2 --summary_interval -4" phc2sysOpts: -r -u 0 -m -N 8 -R 16 -s $iface_nic1 -n 24 ptpSchedulingPolicy: SCHED_FIFO ptpSchedulingPriority: 10 ptpSettings: logReduce: "true" plugins: e810: enableDefaultConfig: false settings: LocalMaxHoldoverOffSet: 1500 LocalHoldoverTimeout: 14400 MaxInSpecOffset: 1500 pins: $e810_pins # "$iface_nic1": # "U.FL2": "0 2" # "U.FL1": "0 1" # "SMA2": "0 2" # "SMA1": "2 1" # "$iface_nic2": # "U.FL2": "0 2" # "U.FL1": "0 1" # "SMA2": "0 2" # "SMA1": "1 1" ublxCmds: - args: #ubxtool -P 29.20 -z CFG-HW-ANT_CFG_VOLTCTRL,1 - "-P" - "29.20" - "-z" - "CFG-HW-ANT_CFG_VOLTCTRL,1" reportOutput: false - args: #ubxtool -P 29.20 -e GPS - "-P" - "29.20" - "-e" - "GPS" reportOutput: false - args: #ubxtool -P 29.20 -d Galileo - "-P" - "29.20" - "-d" - "Galileo" reportOutput: false - args: #ubxtool -P 29.20 -d GLONASS - "-P" - "29.20" - "-d" - "GLONASS" reportOutput: false - args: #ubxtool -P 29.20 -d BeiDou - "-P" - "29.20" - "-d" - "BeiDou" reportOutput: false - args: #ubxtool -P 29.20 -d SBAS - "-P" - "29.20" - "-d" - "SBAS" reportOutput: false - args: #ubxtool -P 29.20 -t -w 5 -v 1 -e SURVEYIN,600,50000 - "-P" - "29.20" - "-t" - "-w" - "5" - "-v" - "1" - "-e" - "SURVEYIN,600,50000" reportOutput: true - args: #ubxtool -P 29.20 -p MON-HW - "-P" - "29.20" - "-p" - "MON-HW" reportOutput: true - args: #ubxtool -P 29.20 -p CFG-MSG,1,38,248 - "-P" - "29.20" - "-p" - "CFG-MSG,1,38,248" reportOutput: true ts2phcOpts: " " ts2phcConf: | [nmea] ts2phc.master 1 [global] use_syslog 0 verbose 1 logging_level 7 ts2phc.pulsewidth 100000000 #cat /dev/GNSS to find available serial port #example value of gnss_serialport is /dev/ttyGNSS_1700_0 ts2phc.nmea_serialport $gnss_serialport [$iface_nic1] ts2phc.extts_polarity rising ts2phc.extts_correction 0 [$iface_nic2] ts2phc.master 0 ts2phc.extts_polarity rising #this is a measured value in nanoseconds to compensate for SMA cable delay ts2phc.extts_correction -10 ptp4lConf: | [$iface_nic1] masterOnly 1 [$iface_nic1_1] masterOnly 1 [$iface_nic1_2] masterOnly 1 [$iface_nic1_3] masterOnly 1 [$iface_nic2] masterOnly 1 [$iface_nic2_1] masterOnly 1 [$iface_nic2_2] masterOnly 1 [$iface_nic2_3] masterOnly 1 [global] # # Default Data Set # twoStepFlag 1 priority1 128 priority2 128 domainNumber 24 #utc_offset 37 clockClass 6 clockAccuracy 0x27 offsetScaledLogVariance 0xFFFF free_running 0 freq_est_interval 1 dscp_event 0 dscp_general 0 dataset_comparison G.8275.x G.8275.defaultDS.localPriority 128 # # Port Data Set # logAnnounceInterval -3 logSyncInterval -4 logMinDelayReqInterval -4 logMinPdelayReqInterval 0 announceReceiptTimeout 3 syncReceiptTimeout 0 delayAsymmetry 0 fault_reset_interval -4 neighborPropDelayThresh 20000000 masterOnly 0 G.8275.portDS.localPriority 128 # # Run time options # assume_two_step 0 logging_level 6 path_trace_enabled 0 follow_up_info 0 hybrid_e2e 0 inhibit_multicast_service 0 net_sync_monitor 0 tc_spanning_tree 0 tx_timestamp_timeout 50 unicast_listen 0 unicast_master_table 0 unicast_req_duration 3600 use_syslog 1 verbose 0 summary_interval -4 kernel_leap 1 check_fup_sync 0 clock_class_threshold 7 # # Servo Options # pi_proportional_const 0.0 pi_integral_const 0.0 pi_proportional_scale 0.0 pi_proportional_exponent -0.3 pi_proportional_norm_max 0.7 pi_integral_scale 0.0 pi_integral_exponent 0.4 pi_integral_norm_max 0.3 step_threshold 2.0 first_step_threshold 0.00002 clock_servo pi sanity_freq_limit 200000000 ntpshm_segment 0 # # Transport options # transportSpecific 0x0 ptp_dst_mac 01:1B:19:00:00:00 p2p_dst_mac 01:80:C2:00:00:0E udp_ttl 1 udp6_scope 0x0E uds_address /var/run/ptp4l # # Default interface options # clock_type BC network_transport L2 delay_mechanism E2E time_stamping hardware tsproc_mode filter delay_filter moving_median delay_filter_length 10 egressLatency 0 ingressLatency 0 boundary_clock_jbod 1 # # Clock description # productDescription ;; revisionData ;; manufacturerIdentity 00:00:00 userDescription ; timeSource 0x20 recommend: - profile: "grandmaster" priority: 4 match: - nodeLabel: "node-role.kubernetes.io/$mcp"참고ts2phc.nmea_serialport의 값을/dev/gnss0로 설정합니다.다음 명령을 실행하여 CR을 생성합니다.
$ oc create -f grandmaster-clock-ptp-config-dual-nics.yaml
검증
PtpConfig프로필이 노드에 적용되었는지 확인합니다.다음 명령을 실행하여
openshift-ptp네임스페이스에서 Pod 목록을 가져옵니다.$ oc get pods -n openshift-ptp -o wide출력 예
NAME                          READY   STATUS    RESTARTS   AGE     IP             NODE
linuxptp-daemon-74m2g         3/3     Running   3          4d15h   10.16.230.7    compute-1.example.com
ptp-operator-5f4f48d7c-x7zkf  1/1     Running   1          4d15h   10.128.1.145   compute-1.example.com
프로필이 올바른지 확인합니다.
PtpConfig프로필에 지정한 노드에 해당하는linuxptp데몬의 로그를 검사합니다. 다음 명령을 실행합니다.$ oc logs linuxptp-daemon-74m2g -n openshift-ptp -c linuxptp-daemon-container출력 예
ts2phc[509863.660]: [ts2phc.0.config] nmea delay: 347527248 ns
ts2phc[509863.660]: [ts2phc.0.config] ens2f0 extts index 0 at 1705516553.000000000 corr 0 src 1705516553.652499081 diff 0
ts2phc[509863.660]: [ts2phc.0.config] ens2f0 master offset          0 s2 freq      -0
I0117 18:35:16.000146 1633226 stats.go:57] state updated for ts2phc =s2
I0117 18:35:16.000163 1633226 event.go:417] dpll State s2, gnss State s2, tsphc state s2, gm state s2,
ts2phc[1705516516]:[ts2phc.0.config] ens2f0 nmea_status 1 offset 0 s2
GM[1705516516]:[ts2phc.0.config] ens2f0 T-GM-STATUS s2
ts2phc[509863.677]: [ts2phc.0.config] ens7f0 extts index 0 at 1705516553.000000010 corr -10 src 1705516553.652499081 diff 0
ts2phc[509863.677]: [ts2phc.0.config] ens7f0 master offset          0 s2 freq      -0
I0117 18:35:16.016597 1633226 stats.go:57] state updated for ts2phc =s2
phc2sys[509863.719]: [ptp4l.0.config] CLOCK_REALTIME phc offset        -6 s2 freq  +15441 delay    510
phc2sys[509863.782]: [ptp4l.0.config] CLOCK_REALTIME phc offset        -7 s2 freq  +15438 delay    502
5.2.4.2. linuxptp 서비스를 3 E810 NIC의 할마스터 클록으로 구성
NIC를 구성하는 PtpConfig CR(사용자 정의 리소스)을 3 E810 NIC의 grandmaster 클럭(T-GM)으로 linuxptp 서비스(ptp4l,phc2sys,ts2phc)를 구성할 수 있습니다.
다음 E810 NIC에 대해 3개의 NIC를 사용하여 linuxptp 서비스를 T-GM으로 구성할 수 있습니다.
- Intel E810-XXVDA4T Westport 채널 NIC
- Intel E810-CQDA2T Logan Beach NIC
분산 RAN(D-RAN) 사용 사례의 경우 다음과 같이 3개의 NIC에 대해 PTP를 구성할 수 있습니다.
- NIC 1이 GNSS(Global Navigation Satellite System)와 동기화됩니다.
- NIC 2 및 3은 1PPS faceplate 연결을 사용하여 NIC 1과 동기화됩니다.
다음 예제 PtpConfig CR을 기반으로 linuxptp 서비스를 3 카드 Intel E810 T-GM으로 구성합니다.
사전 요구 사항
- 프로덕션 환경의 T-GM 클록의 경우 베어 메탈 클러스터 호스트에 3개의 Intel E810 NIC를 설치합니다.
-
OpenShift CLI(
oc)를 설치합니다. -
cluster-admin권한이 있는 사용자로 로그인합니다. - PTP Operator를 설치합니다.
프로세스
PtpConfigCR을 생성합니다. 예를 들면 다음과 같습니다.다음 YAML을
three-nic-grandmaster-clock-ptp-config.yaml파일에 저장합니다.예 5.3. 3개의 E810 NIC에 대한 PTP 마스터 클록 구성
# In this example, the three cards are connected via SMA cables: # - $iface_timeTx1 has the GNSS signal input # - $iface_timeTx2 SMA1 is connected to $iface_timeTx1 SMA1 # - $iface_timeTx3 SMA1 is connected to $iface_timeTx1 SMA2 apiVersion: ptp.openshift.io/v1 kind: PtpConfig metadata: name: gm-3card namespace: openshift-ptp annotations: ran.openshift.io/ztp-deploy-wave: "10" spec: profile: - name: grandmaster ptp4lOpts: -2 --summary_interval -4 phc2sysOpts: -r -u 0 -m -N 8 -R 16 -s $iface_timeTx1 -n 24 ptpSchedulingPolicy: SCHED_FIFO ptpSchedulingPriority: 10 ptpSettings: logReduce: "true" plugins: e810: enableDefaultConfig: false settings: LocalHoldoverTimeout: 14400 LocalMaxHoldoverOffSet: 1500 MaxInSpecOffset: 1500 pins: # Syntax guide: # - The 1st number in each pair must be one of: # 0 - Disabled # 1 - RX # 2 - TX # - The 2nd number in each pair must match the channel number $iface_timeTx1: SMA1: 2 1 SMA2: 2 2 U.FL1: 0 1 U.FL2: 0 2 $iface_timeTx2: SMA1: 1 1 SMA2: 0 2 U.FL1: 0 1 U.FL2: 0 2 $iface_timeTx3: SMA1: 1 1 SMA2: 0 2 U.FL1: 0 1 U.FL2: 0 2 ublxCmds: - args: #ubxtool -P 29.20 -z CFG-HW-ANT_CFG_VOLTCTRL,1 - "-P" - "29.20" - "-z" - "CFG-HW-ANT_CFG_VOLTCTRL,1" reportOutput: false - args: #ubxtool -P 29.20 -e GPS - "-P" - "29.20" - "-e" - "GPS" reportOutput: false - args: #ubxtool -P 29.20 -d Galileo - "-P" - "29.20" - "-d" - "Galileo" reportOutput: false - args: #ubxtool -P 29.20 -d GLONASS - "-P" - "29.20" - "-d" - "GLONASS" reportOutput: false - args: #ubxtool -P 29.20 -d BeiDou - "-P" - "29.20" - "-d" - "BeiDou" reportOutput: false - args: #ubxtool -P 29.20 -d SBAS - "-P" - "29.20" - "-d" - "SBAS" reportOutput: false - args: #ubxtool -P 29.20 -t -w 5 -v 1 -e SURVEYIN,600,50000 - "-P" - "29.20" - "-t" - "-w" - "5" - "-v" - "1" - "-e" - "SURVEYIN,600,50000" reportOutput: true - args: #ubxtool -P 29.20 -p MON-HW - "-P" - "29.20" - "-p" - "MON-HW" reportOutput: true - args: #ubxtool -P 29.20 -p CFG-MSG,1,38,248 - "-P" - "29.20" - "-p" - "CFG-MSG,1,38,248" reportOutput: true ts2phcOpts: " " ts2phcConf: | [nmea] ts2phc.master 1 [global] use_syslog 0 verbose 1 logging_level 7 ts2phc.pulsewidth 100000000 #example value of nmea_serialport is /dev/gnss0 ts2phc.nmea_serialport (?<gnss_serialport>[/\w\s/]+) leapfile /usr/share/zoneinfo/leap-seconds.list [$iface_timeTx1] ts2phc.extts_polarity rising ts2phc.extts_correction 0 [$iface_timeTx2] ts2phc.master 0 ts2phc.extts_polarity rising #this is a measured value in nanoseconds to compensate for SMA cable delay ts2phc.extts_correction -10 [$iface_timeTx3] ts2phc.master 0 ts2phc.extts_polarity rising #this is a measured value in nanoseconds to compensate for SMA cable delay ts2phc.extts_correction -10 ptp4lConf: | [$iface_timeTx1] masterOnly 1 [$iface_timeTx1_1] masterOnly 1 [$iface_timeTx1_2] masterOnly 1 [$iface_timeTx1_3] masterOnly 1 [$iface_timeTx2] masterOnly 1 [$iface_timeTx2_1] masterOnly 1 [$iface_timeTx2_2] masterOnly 1 [$iface_timeTx2_3] masterOnly 1 [$iface_timeTx3] masterOnly 1 [$iface_timeTx3_1] masterOnly 1 [$iface_timeTx3_2] masterOnly 1 [$iface_timeTx3_3] masterOnly 1 [global] # # Default Data Set # twoStepFlag 1 priority1 128 priority2 128 domainNumber 24 #utc_offset 37 clockClass 6 clockAccuracy 0x27 offsetScaledLogVariance 0xFFFF free_running 0 freq_est_interval 1 dscp_event 0 dscp_general 0 dataset_comparison G.8275.x G.8275.defaultDS.localPriority 128 # # Port Data Set # logAnnounceInterval -3 logSyncInterval -4 logMinDelayReqInterval -4 logMinPdelayReqInterval 0 announceReceiptTimeout 3 syncReceiptTimeout 0 delayAsymmetry 0 fault_reset_interval -4 neighborPropDelayThresh 20000000 masterOnly 0 G.8275.portDS.localPriority 128 # # Run time options # assume_two_step 0 logging_level 6 path_trace_enabled 0 follow_up_info 0 hybrid_e2e 0 inhibit_multicast_service 0 net_sync_monitor 0 tc_spanning_tree 0 tx_timestamp_timeout 50 unicast_listen 0 unicast_master_table 0 unicast_req_duration 3600 use_syslog 1 verbose 0 summary_interval -4 kernel_leap 1 check_fup_sync 0 clock_class_threshold 7 # # Servo Options # pi_proportional_const 0.0 pi_integral_const 0.0 pi_proportional_scale 0.0 pi_proportional_exponent -0.3 pi_proportional_norm_max 0.7 pi_integral_scale 0.0 pi_integral_exponent 0.4 pi_integral_norm_max 0.3 step_threshold 2.0 first_step_threshold 0.00002 clock_servo pi sanity_freq_limit 200000000 ntpshm_segment 0 # # Transport options # transportSpecific 0x0 ptp_dst_mac 01:1B:19:00:00:00 p2p_dst_mac 01:80:C2:00:00:0E udp_ttl 1 udp6_scope 0x0E uds_address /var/run/ptp4l # # Default interface options # clock_type BC network_transport L2 delay_mechanism E2E time_stamping hardware tsproc_mode filter delay_filter moving_median delay_filter_length 10 egressLatency 0 ingressLatency 0 boundary_clock_jbod 1 # # Clock description # productDescription ;; revisionData ;; manufacturerIdentity 00:00:00 userDescription ; timeSource 0x20 ptpClockThreshold: holdOverTimeout: 5 maxOffsetThreshold: 1500 minOffsetThreshold: -1500 recommend: - profile: grandmaster priority: 4 match: - nodeLabel: node-role.kubernetes.io/$mcp참고ts2phc.nmea_serialport의 값을/dev/gnss0로 설정합니다.다음 명령을 실행하여 CR을 생성합니다.
$ oc create -f three-nic-grandmaster-clock-ptp-config.yaml
검증
PtpConfig프로필이 노드에 적용되었는지 확인합니다.다음 명령을 실행하여
openshift-ptp네임스페이스에서 Pod 목록을 가져옵니다.$ oc get pods -n openshift-ptp -o wide출력 예
NAME                          READY   STATUS    RESTARTS   AGE     IP             NODE
linuxptp-daemon-74m3q         3/3     Running   3          4d15h   10.16.230.7    compute-1.example.com
ptp-operator-5f4f48d7c-x6zkn  1/1     Running   1          4d15h   10.128.1.145   compute-1.example.com
프로필이 올바른지 확인합니다. 다음 명령을 실행하고
PtpConfig프로필에 지정한 노드에 해당하는linuxptp데몬의 로그를 검사합니다.$ oc logs linuxptp-daemon-74m3q -n openshift-ptp -c linuxptp-daemon-container출력 예
ts2phc[2527.586]: [ts2phc.0.config:7] adding tstamp 1742826342.000000000 to clock /dev/ptp111 ts2phc[2527.586]: [ts2phc.0.config:7] adding tstamp 1742826342.000000000 to clock /dev/ptp72 ts2phc[2527.586]: [ts2phc.0.config:7] adding tstamp 1742826342.000000000 to clock /dev/ptp143 ts2phc[2527.586]: [ts2phc.0.config:7] nmea delay: 56308811 ns ts2phc[2527.586]: [ts2phc.0.config:6] /dev/ptp14 offset 0 s2 freq +04 ts2phc[2527.587]: [ts2phc.0.config:6] /dev/ptp7 offset 0 s2 freq +05 ts2phc[2527.587]: [ts2phc.0.config:6] /dev/ptp11 offset 0 s2 freq -06 I0324 14:25:05.000439 106907 stats.go:61] state updated for ts2phc =s2 I0324 14:25:05.000504 106907 event.go:419] dpll State s2, gnss State s2, tsphc state s2, gm state s2, I0324 14:25:05.000906 106907 stats.go:61] state updated for ts2phc =s2 I0324 14:25:05.001059 106907 stats.go:61] state updated for ts2phc =s2 ts2phc[1742826305]:[ts2phc.0.config] ens4f0 nmea_status 1 offset 0 s2 GM[1742826305]:[ts2phc.0.config] ens4f0 T-GM-STATUS s27
5.2.5. Grandmaster 클럭 PtpConfig 구성 참조
다음 참조 정보는 linuxptp 서비스(ptp4l,phc2sys,ts2phc)를 마스터 클록으로 구성하는 PtpConfig CR(사용자 정의 리소스)의 구성 옵션을 설명합니다.
| PtpConfig CR 필드 | 설명 |
|---|---|
|
|
마스터 클록 작업에 대한 NIC를 구성하는
플러그인 메커니즘을 사용하면 PTP Operator가 자동화된 하드웨어 구성을 수행할 수 있습니다. Intel Westport Channel NIC 또는 Intel Logan Beach NIC의 경우 |
|
|
|
|
|
|
|
| 데이터를 삭제하기 전에 발신자로부터 전송(TX) 타임스탬프를 대기할 최대 시간(TX)을 지정합니다. |
|
| JBOD 경계 클럭 시간 지연 값을 지정합니다. 이 값은 네트워크 시간 장치 간에 전달되는 시간 값을 수정하는 데 사용됩니다. |
|
|
참고
여기에 나열된 네트워크 인터페이스가 grandmaster로 구성되어 있고 |
|
|
|
|
|
|
|
|
선택 사항: |
|
|
|
|
|
|
|
|
|
|
|
|
|
|
|
|
|
|
|
|
|
|
|
|
5.2.5.1. Grandmaster 클럭 클래스 동기화 상태 참조
다음 표는 PTP 할 마스터 클록 (T-GM) gm.ClockClass 상태를 설명합니다. 클럭 클래스는 PRTC(Basic Reference Time Clock) 또는 기타 타이밍 소스와 관련하여 정확성 및 안정성을 기반으로 T-GM 시계를 분류합니다.
홀드오버 사양은 PTP 클럭이 기본 시간 소스에서 업데이트를 수신하지 않고도 동기화를 유지할 수 있는 시간입니다.
| 클럭 클래스 상태 | 설명 |
|---|---|
|
|
T-GM 클록은 |
|
|
T-GM 클록은 |
|
|
T-GM 시계는 |
자세한 내용은 "상시/시간 추적 정보", ITU-T G.8275.1/Y.1369.1 권장 사항을 참조하십시오.
5.2.5.2. Intel E810 NIC 하드웨어 구성 참조
이 정보를 사용하여 Intel E810 하드웨어 플러그인을 사용하여 E810 네트워크 인터페이스를 PTP 마스터 클록으로 구성하는 방법을 파악합니다. 하드웨어 핀 구성은 네트워크 인터페이스가 시스템의 다른 구성 요소 및 장치와 상호 작용하는 방식을 결정합니다. Intel E810 NIC에는 외부 1PPS 신호를 위한 네 개의 커넥터가 있습니다: SMA1,SMA2,U.FL1 및 U.FL2.
| 하드웨어 핀 | 권장 설정 | 설명 |
|---|---|---|
|
|
|
|
|
|
|
|
|
|
|
|
|
|
|
|
다음 예와 같이 spec.profile.plugins.e810.pins 매개변수를 사용하여 Intel E810 NIC에서 핀 구성을 설정할 수 있습니다.
pins:
      <interface_name>:
        <connector_name>: <function> <channel_number>
다음과 같습니다.
<function > : 핀의 역할을 지정합니다. 다음 값은 pin 역할과 연결됩니다.
-
0: disabled -
1: RX (Receive timestamping) -
2: TX (Transmit timestamping)
<channel number > : 물리적 커넥터와 관련된 번호입니다. 다음 채널 번호는 물리적 커넥터와 연결되어 있습니다.
-
1:SMA1또는U.FL1 -
2:SMA2또는U.FL2
예:
-
0 1:SMA1또는U.FL1에 매핑된 핀을 비활성화합니다. -
1 2: Rx 함수를SMA2또는U.FL2에 할당합니다.
SMA1 및 U.FL1 커넥터는 채널 1을 공유합니다. SMA2 및 U.FL2 커넥터는 채널 2를 공유합니다.
spec.profile.plugins.e810.ublxCmds 매개변수를 설정하여 PtpConfig CR(사용자 정의 리소스)에서 GNSS 시계를 구성합니다.
T-GM GPS 마케이터 케이블 신호 지연을 보완하려면 오프셋 값을 구성해야 합니다. 최적의 T-GM radio offset 값을 구성하려면 GNSS radio cable signal 지연을 정확하게 측정하십시오. Red Hat은 이러한 측정을 지원하거나 필요한 지연 오프셋에 대한 값을 제공할 수 없습니다.
이러한 ublxCmds 스탠자 각각 ubxtool 명령을 사용하여 호스트 NIC에 적용되는 구성에 해당합니다. 예를 들면 다음과 같습니다.
ublxCmds:
  - args:
      - "-P"
      - "29.20"
      - "-z"
      - "CFG-HW-ANT_CFG_VOLTCTRL,1"
      - "-z"
      - "CFG-TP-ANT_CABLEDELAY,<antenna_delay_offset>"
reportOutput: false- 1
- 나노초 단위의 T-GM 마더레이션 지연 오프셋입니다. 필요한 지연 오프셋 값을 얻으려면 외부 테스트 장치를 사용하여 케이블 지연을 측정해야 합니다.
다음 표에서는 동일한 ubxtool 명령을 설명합니다.
| ubxtool 명령 | 설명 |
|---|---|
|
|
사도전압 제어를 가능하게 하고, |
|
| Angon이 GPS 신호를 수신할 수 있도록 합니다. |
|
| Galileo GPS satellite에서 신호를 수신하도록 Angalileo GPS Satellite를 구성합니다. |
|
| GLONASS GPS Satellite에서 신호를 수신하지 못하게 합니다. |
|
| 마진이 BeiDou GPS Satellite에서 신호를 수신하지 못하도록 비활성화합니다. |
|
| SBAS GPS Satellite에서 신호를 수신하지 못하게 합니다. |
|
| 초기 위치 추정을 개선하도록 GNSS 수신기 설문 조사 프로세스를 구성합니다. 최적의 결과를 얻으려면 최대 24 시간이 걸릴 수 있습니다. |
|
| 하드웨어의 자동화된 단일 검사를 실행하고 NIC 상태 및 구성 설정에 대해 보고합니다. |
5.2.5.3. Dual E810 NIC 구성 참조
이 정보를 사용하여 Intel E810 하드웨어 플러그인을 사용하여 E810 네트워크 인터페이스를 PTP 할 마스터 클록(T-GM)으로 구성하는 방법을 파악합니다.
듀얼 NIC 클러스터 호스트를 구성하기 전에 1PPS faceplace 연결을 사용하여 두 NIC를 SMA1 케이블과 연결해야 합니다.
듀얼 NIC T-GM을 구성할 때 SMA1 연결 포트를 사용하여 NIC를 연결할 때 발생하는 1PPS 신호 지연을 보완해야 합니다. 케이블 길이, 주변 온도 및 구성 요소 및 제조 허용 오차와 같은 다양한 요인은 신호 지연에 영향을 미칠 수 있습니다. 지연을 보완하려면 신호 지연을 오프셋하는 데 사용하는 특정 값을 계산해야 합니다.
| PtpConfig 필드 | 설명 |
|---|---|
|
| PTP Operator E810 하드웨어 플러그인을 사용하여 E810 하드웨어 핀을 구성합니다.
|
|
|
|
|
|
|
spec.profile.plugins.e810.pins 목록의 각 값은 < function > < channel_number > 형식을 따릅니다.
다음과 같습니다.
<function > : 핀 역할을 지정합니다. 다음 값은 pin 역할과 연결됩니다.
-
0: disabled -
1: 수신 (Rx) - 1PPS IN의 경우 -
2: 전송 (Tx) - 1PPS OUT 용
<channel_number >: 물리적 커넥터와 관련된 번호입니다. 다음 채널 번호는 물리적 커넥터와 연결되어 있습니다.
-
1:SMA1또는U.FL1 -
2:SMA2또는U.FL2
예:
-
2 1:SMA1에서1PPS OUT(Tx)을 활성화합니다. -
1 1:SMA1에서1PPS IN(Rx)을 활성화합니다.
PTP Operator는 이러한 값을 Intel E810 하드웨어 플러그인에 전달하여 각 NIC의 sysfs 핀 구성 인터페이스에 씁니다.
5.2.5.4. 3-card E810 NIC 구성 참조
이 정보를 사용하여 E810 NIC를 PTP 할 마스터 클록(T-GM)으로 구성하는 방법을 파악합니다.
3 카드 클러스터 호스트를 구성하기 전에 1PPS faceplate 연결을 사용하여 3 NIC를 연결해야 합니다. 기본 NIC 1PPS_out 출력은 다른 2 NIC를 제공합니다.
3 카드 T-GM을 구성할 때 SMA1 연결 포트를 사용하여 NIC를 연결할 때 발생하는 1PPS 신호 지연을 보완해야 합니다. 케이블 길이, 주변 온도 및 구성 요소 및 제조 허용 오차와 같은 다양한 요인은 신호 지연에 영향을 미칠 수 있습니다. 지연을 보완하려면 신호 지연을 오프셋하는 데 사용하는 특정 값을 계산해야 합니다.
| PtpConfig 필드 | 설명 |
|---|---|
|
| PTP Operator E810 하드웨어 플러그인을 사용하여 E810 하드웨어 핀을 구성합니다.
|
|
|
|
|
|
|
5.2.6. GNSS를 소스로 사용하는 마스터 클록의 홀드오버
holdover를 사용하면 GNSS(Global navigation satellite system) 소스를 사용할 수 없는 경우 T-GM(T-GM) 클럭을 동기화 성능을 유지할 수 있습니다. 이 기간 동안 T-GM 클럭은 타이밍 중단을 줄이기 위해 내부 오실레이터 및 홀드오버 매개변수에 의존합니다.
PTPConfig CR(사용자 정의 리소스)에서 다음 holdover 매개변수를 구성하여 홀드오버 동작을 정의할 수 있습니다.
MaxInSpecOffset-
나노초 단위로 허용되는 최대 오프셋을 지정합니다. T-GM 시계가
MaxInSpecOffset값을 초과하면 freeRUN상태(clock 클래스 상태gm.ClockClass 248)로 전환됩니다. LocalHoldoverTimeout-
free
RUN상태로 전환하기 전에 T-GM 클럭이 홀드오버 상태에 남아 있는 최대 기간(초)을 지정합니다. LocalMaxHoldoverOffSet- T-GM 클럭이 나노초 단위의 홀드오버 상태 중에 도달할 수 있는 최대 오프셋을 지정합니다.
MaxInSpecOffset 값이 LocalMaxHoldoverOffset 값보다 적고 T-GM 클럭이 최대 오프셋 값을 초과하면 T-GM 클럭이 홀드오버 상태에서 free RUN 상태로 전환됩니다.
LocalMaxHoldoverOffSet 값이 MaxInSpecOffset 값보다 작으면 클럭이 최대 오프셋에 도달하기 전에 홀오버 타임아웃이 수행됩니다. 이 문제를 해결하려면 MaxInSpecOffset 필드와 LocalMaxHoldoverOffset 필드를 동일한 값으로 설정합니다.
클럭 클래스 상태에 대한 자세한 내용은 "Grandmaster clock class sync state reference" 문서를 참조하십시오.
T-GM 클록은 로컬MaxHoldoverOffSet 및 매개 변수를 사용하여 기울기를 계산합니다. 슬로프는 시간 경과에 따라 단계 오프셋이 변경되는 비율입니다. 이는 초당 나노초 단위로 측정되며, 여기서 set 값은 지정된 기간 동안 오프셋이 얼마나 증가했는지를 나타냅니다.
LocalHoldover Timeout
T-GM 클록은 슬로프 값을 사용하여 시간 변동을 예측 및 보완하여 홀드 중에 타이밍 중단을 줄입니다. T-GM 클록은 슬로프를 계산하기 위해 다음 공식을 사용합니다.
Slope =
localMaxHoldoverOffSet/localHoldoverTimeout예를 들어
LocalHoldOverTimeout매개변수가 60초로 설정되고LocalMaxHoldoverOffset매개변수가 3000 나노초로 설정된 경우 슬로프는 다음과 같이 계산됩니다.기울기 = 3000 나노초 / 60 초 = 초당 50 나노초
T-GM 클록은 60초 내에 최대 오프셋에 도달합니다.
단계 오프셋은 picoseconds에서 나노초로 변환됩니다. 결과적으로 홀드오버 중 계산된 단계 오프셋은 나노초로 표시되고 결과 슬로프는 초당 나노초 단위로 표시됩니다.
다음 그림은 GNSS를 소스로 사용하여 T-GM 클록의 홀드오버 동작을 보여줍니다.
그림 5.5. GNSS를 소스로 사용하는 T-GM 클록의 홀드오버
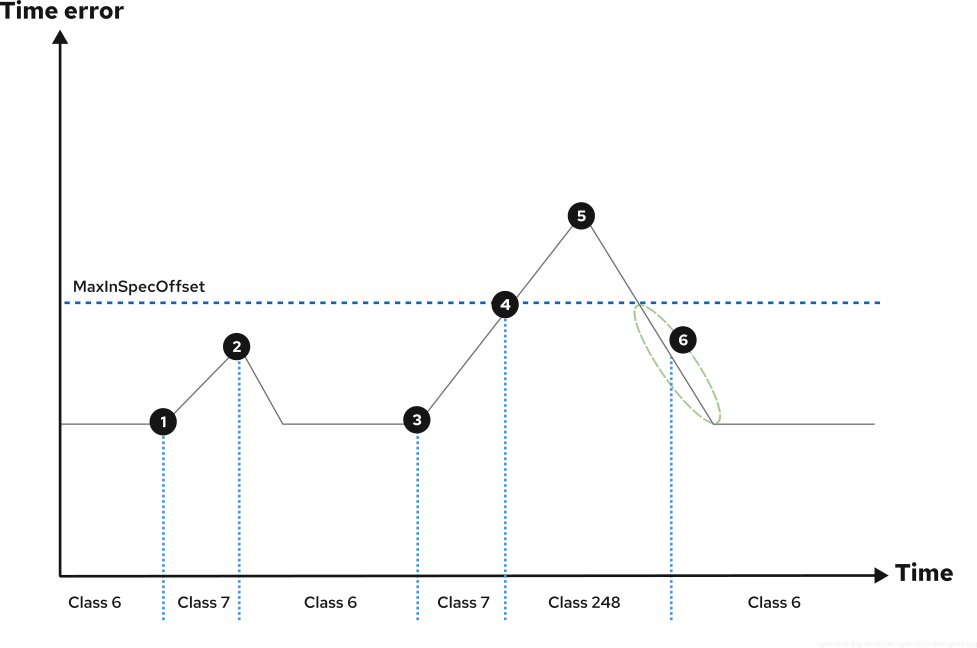
![]() GNSS 신호가 손실되어 T-GM 시계가
GNSS 신호가 손실되어 T-GM 시계가 HOLDOVER 모드로 전환됩니다. T-GM 클록은 내부 시계를 사용하여 시간 정확성을 유지합니다.
![]() GNSS 신호가 복원되고 T-GM 클럭이
GNSS 신호가 복원되고 T-GM 클럭이 LOCKED 모드를 다시 입력합니다. GNSS 신호가 복원되면 ts2phc offset, digital phase-locked loop (DPLL) 단계 오프셋, GNSS 오프셋과 같은 동기화 체인의 모든 종속 구성 요소만 T-GM 클럭을 다시 입력하고 GNSS 오프셋에 도달합니다.
![]() GNSS 신호가 다시 손실되고 T-GM 클럭이
GNSS 신호가 다시 손실되고 T-GM 클럭이 HOLDOVER 모드로 다시 들어갑니다. 시간 오류가 증가하기 시작합니다.
![]() 시간 오류는 추적 기능의 긴 손실로 인해
시간 오류는 추적 기능의 긴 손실로 인해 MaxInSpecOffset 임계값을 초과합니다.
![]() GNSS 신호가 복원되고 T-GM 클럭이 동기화를 재개합니다. 시간 오류가 줄어들기 시작합니다.
GNSS 신호가 복원되고 T-GM 클럭이 동기화를 재개합니다. 시간 오류가 줄어들기 시작합니다.
![]() 시간 오류는
시간 오류는 MaxInSpecOffset 임계값 내에 감소하고 대체합니다.
5.2.7. PTP grandmaster 클록에 대한 동적 윤초 처리 구성
PTP Operator 컨테이너 이미지에는 릴리스 시 사용할 수 있는 최신 leap-seconds.list 파일이 포함되어 있습니다. PTP Operator는 GPS(Global positioning System) 발표를 사용하여 윤초 파일을 자동으로 업데이트하도록 구성할 수 있습니다.
윤초 정보는 openshift-ptp 네임스페이스에 leap-configmap 이라는 자동으로 생성된 ConfigMap 리소스에 저장됩니다. PTP Operator는 ts2phc 프로세스에서 액세스할 수 있는 linuxptp-daemon Pod에 leap-configmap 리소스를 볼륨으로 마운트합니다.
GPS satellite에서 새 윤초 데이터를 브로드캐스트하는 경우 PTP Operator는 leap-configmap 리소스를 새 데이터로 업데이트합니다. ts2phc 프로세스는 변경 사항을 자동으로 선택합니다.
다음 절차는 참조로 제공됩니다. PTP Operator의 4.18 버전은 기본적으로 자동 윤초 관리를 활성화합니다.
사전 요구 사항
-
OpenShift CLI(
oc)가 설치되어 있습니다. -
cluster-admin권한이 있는 사용자로 로그인했습니다. - PTP Operator를 설치하고 클러스터에 PTP 할 마스터 클럭 (T-GM)을 구성했습니다.
프로세스
PtpConfigCR의phc2sysOpts섹션에서 자동 윤초 처리를 구성합니다. 다음 옵션을 설정합니다.phc2sysOpts: -r -u 0 -m -N 8 -R 16 -S 2 -s ens2f0 -n 241 참고이전에는 T-GM에서 과거 윤초를 고려하여
phc2sys구성(-O -37)에 오프셋 조정이 필요했습니다. 더 이상 필요하지 않습니다.PtpConfigCR의spec.profile.plugins.e810.ublxCmds섹션에서 GPS 수신자가NAV-TIMELS메시지의 정기 보고를 사용하도록 Intel e810 NIC를 구성합니다. 예를 들면 다음과 같습니다.- args: #ubxtool -P 29.20 -p CFG-MSG,1,38,248 - "-P" - "29.20" - "-p" - "CFG-MSG,1,38,248"
검증
구성된 T-GM이 연결된 GPS에서
NAV-TIMELS메시지를 수신하는지 확인합니다. 다음 명령을 실행합니다.$ oc -n openshift-ptp -c linuxptp-daemon-container exec -it $(oc -n openshift-ptp get pods -o name | grep daemon) -- ubxtool -t -p NAV-TIMELS -P 29.20출력 예
1722509534.4417
UBX-NAV-STATUS:
  iTOW 384752000 gpsFix 5 flags 0xdd fixStat 0x0 flags2 0x8
  ttff 18261, msss 1367642864

1722509534.4419
UBX-NAV-TIMELS:
  iTOW 384752000 version 0 reserved2 0 0 0 srcOfCurrLs 2
  currLs 18 srcOfLsChange 2 lsChange 0 timeToLsEvent 70376866
  dateOfLsGpsWn 2441 dateOfLsGpsDn 7 reserved2 0 0 0
  valid x3

1722509534.4421
UBX-NAV-CLOCK:
  iTOW 384752000 clkB 784281 clkD 435 tAcc 3 fAcc 215

1722509535.4477
UBX-NAV-STATUS:
  iTOW 384753000 gpsFix 5 flags 0xdd fixStat 0x0 flags2 0x8
  ttff 18261, msss 1367643864

1722509535.4479
UBX-NAV-CLOCK:
  iTOW 384753000 clkB 784716 clkD 435 tAcc 3 fAcc 218
PTP Operator에서
leap-configmap리소스가 성공적으로 생성되었으며 최신 버전의 leap-seconds.list 를 사용하여 최신 상태인지 확인합니다. 다음 명령을 실행합니다.$ oc -n openshift-ptp get configmap leap-configmap -o jsonpath='{.data.<node_name>}'1 출력 예
# Do not edit
# This file is generated automatically by linuxptp-daemon
#$  3913697179
#@  4291747200
2272060800     10    # 1 Jan 1972
2287785600     11    # 1 Jul 1972
2303683200     12    # 1 Jan 1973
2335219200     13    # 1 Jan 1974
2366755200     14    # 1 Jan 1975
2398291200     15    # 1 Jan 1976
2429913600     16    # 1 Jan 1977
2461449600     17    # 1 Jan 1978
2492985600     18    # 1 Jan 1979
2524521600     19    # 1 Jan 1980
2571782400     20    # 1 Jul 1981
2603318400     21    # 1 Jul 1982
2634854400     22    # 1 Jul 1983
2698012800     23    # 1 Jul 1985
2776982400     24    # 1 Jan 1988
2840140800     25    # 1 Jan 1990
2871676800     26    # 1 Jan 1991
2918937600     27    # 1 Jul 1992
2950473600     28    # 1 Jul 1993
2982009600     29    # 1 Jul 1994
3029443200     30    # 1 Jan 1996
3076704000     31    # 1 Jul 1997
3124137600     32    # 1 Jan 1999
3345062400     33    # 1 Jan 2006
3439756800     34    # 1 Jan 2009
3550089600     35    # 1 Jul 2012
3644697600     36    # 1 Jul 2015
3692217600     37    # 1 Jan 2017

#h  e65754d4 8f39962b aa854a61 661ef546 d2af0bfa
5.2.8. linuxptp 서비스를 경계 클록으로 구성
PtpConfig CR(사용자 정의 리소스) 오브젝트를 생성하여 linuxptp 서비스(ptp4l,phc2sys)를 경계 클록으로 구성할 수 있습니다.
다음 예제 PtpConfig CR을 기준으로 사용하여 linuxptp 서비스를 특정 하드웨어 및 환경의 경계 클록으로 구성합니다. 이 예제 CR에서는 PTP 빠른 이벤트를 구성하지 않습니다. PTP 빠른 이벤트를 구성하려면 ptp4lOpts,ptp4lConf 및 ptpClockThreshold 에 적절한 값을 설정합니다. ptpClockThreshold 는 이벤트가 활성화된 경우에만 사용됩니다. 자세한 내용은 " PTP 빠른 이벤트 알림 게시자 구성"을 참조하십시오.
사전 요구 사항
-
OpenShift CLI(
oc)를 설치합니다. -
cluster-admin권한이 있는 사용자로 로그인합니다. - PTP Operator를 설치합니다.
프로세스
다음
PtpConfigCR을 만든 다음 YAML을boundary-clock-ptp-config.yaml파일에 저장합니다.PTP 경계 클럭 구성의 예
apiVersion: ptp.openshift.io/v1
kind: PtpConfig
metadata:
  name: boundary-clock
  namespace: openshift-ptp
  annotations: {}
spec:
  profile:
    - name: boundary-clock
      ptp4lOpts: "-2"
      phc2sysOpts: "-a -r -n 24"
      ptpSchedulingPolicy: SCHED_FIFO
      ptpSchedulingPriority: 10
      ptpSettings:
        logReduce: "true"
      ptp4lConf: |
        # The interface name is hardware-specific
        [$iface_slave]
        masterOnly 0
        [$iface_master_1]
        masterOnly 1
        [$iface_master_2]
        masterOnly 1
        [$iface_master_3]
        masterOnly 1
        [global]
        #
        # Default Data Set
        #
        twoStepFlag 1
        slaveOnly 0
        priority1 128
        priority2 128
        domainNumber 24
        #utc_offset 37
        clockClass 248
        clockAccuracy 0xFE
        offsetScaledLogVariance 0xFFFF
        free_running 0
        freq_est_interval 1
        dscp_event 0
        dscp_general 0
        dataset_comparison G.8275.x
        G.8275.defaultDS.localPriority 128
        #
        # Port Data Set
        #
        logAnnounceInterval -3
        logSyncInterval -4
        logMinDelayReqInterval -4
        logMinPdelayReqInterval -4
        announceReceiptTimeout 3
        syncReceiptTimeout 0
        delayAsymmetry 0
        fault_reset_interval -4
        neighborPropDelayThresh 20000000
        masterOnly 0
        G.8275.portDS.localPriority 128
        #
        # Run time options
        #
        assume_two_step 0
        logging_level 6
        path_trace_enabled 0
        follow_up_info 0
        hybrid_e2e 0
        inhibit_multicast_service 0
        net_sync_monitor 0
        tc_spanning_tree 0
        tx_timestamp_timeout 50
        unicast_listen 0
        unicast_master_table 0
        unicast_req_duration 3600
        use_syslog 1
        verbose 0
        summary_interval 0
        kernel_leap 1
        check_fup_sync 0
        clock_class_threshold 135
        #
        # Servo Options
        #
        pi_proportional_const 0.0
        pi_integral_const 0.0
        pi_proportional_scale 0.0
        pi_proportional_exponent -0.3
        pi_proportional_norm_max 0.7
        pi_integral_scale 0.0
        pi_integral_exponent 0.4
        pi_integral_norm_max 0.3
        step_threshold 2.0
        first_step_threshold 0.00002
        max_frequency 900000000
        clock_servo pi
        sanity_freq_limit 200000000
        ntpshm_segment 0
        #
        # Transport options
        #
        transportSpecific 0x0
        ptp_dst_mac 01:1B:19:00:00:00
        p2p_dst_mac 01:80:C2:00:00:0E
        udp_ttl 1
        udp6_scope 0x0E
        uds_address /var/run/ptp4l
        #
        # Default interface options
        #
        clock_type BC
        network_transport L2
        delay_mechanism E2E
        time_stamping hardware
        tsproc_mode filter
        delay_filter moving_median
        delay_filter_length 10
        egressLatency 0
        ingressLatency 0
        boundary_clock_jbod 0
        #
        # Clock description
        #
        productDescription ;;
        revisionData ;;
        manufacturerIdentity 00:00:00
        userDescription ;
        timeSource 0xA0
  recommend:
    - profile: boundary-clock
      priority: 4
      match:
        - nodeLabel: "node-role.kubernetes.io/$mcp"
Expand 표 5.7. PTP 경계 클럭 CR 구성 옵션 CR 필드 설명 namePtpConfigCR의 이름입니다.profile하나 이상의
profile오브젝트의 배열을 지정합니다.name프로파일 오브젝트를 고유하게 식별하는 프로파일 오브젝트의 이름을 지정합니다.
ptp4lOptsptp4l서비스에 대한 시스템 구성 옵션을 지정합니다. 옵션은 네트워크 인터페이스 이름과 서비스 구성 파일이 자동으로 추가되므로 네트워크 인터페이스 이름-i <interface>및 서비스 구성 파일-f /etc/ptp4l.conf를 포함하지 않아야 합니다.ptp4lConfptp4l을 경계 클록으로 시작하는 데 필요한 구성을 지정합니다. 예를 들어ens1f0은 그랜드 마스터 클록에서 동기화되고ens1f3은 연결된 장치를 동기화합니다.<interface_1>동기화 시계를 수신하는 인터페이스입니다.
<interface_2>동기화 시계를 전송하는 인터페이스입니다.
tx_timestamp_timeoutIntel Columbiaville 800 시리즈 NIC의 경우
tx_timestamp_timeout을50으로 설정합니다.boundary_clock_jbodIntel Columbiaville 800 시리즈 NIC의 경우
boundary_clock_jbod가0으로 설정되어 있는지 확인합니다. Intel Fortville X710 시리즈 NIC의 경우boundary_clock_jbod가1로 설정되어 있는지 확인합니다.phc2sysOptsphc2sys서비스에 대한 시스템 구성 옵션을 지정합니다. 이 필드가 비어 있으면 PTP Operator에서phc2sys서비스를 시작하지 않습니다.ptpSchedulingPolicyptp4l 및 phc2sys 프로세스에 대한 스케줄링 정책. 기본값은 Cryo
stat_OTHER입니다. FIFO 스케줄링을 지원하는 시스템에서 Cryostat_FIFO를 사용합니다.ptpSchedulingPriorityptpSchedulingPolicy가 Cryostat_FIFO로 설정된 경우ptp4l및phc2sys프로세스의 FIFO 우선 순위를 설정하는 데 사용되는 1-65의 정수 값입니다.ptpSchedulingPolicy가 ptpSchedulingPolicy로 설정된 경우ptpSchedulingPriority필드는 사용되지않습니다.ptpClockThreshold선택 사항:
ptpClockThreshold가 없으면ptpClockThreshold필드에 기본값이 사용됩니다.ptpClockThreshold는 PTP 이벤트가 트리거되기 전에 PTP 마스터 클록의 연결이 해제된 후의 시간을 구성합니다.holdOverTimeout은 PTP 마스터 클록의 연결이 끊어지면 PTP 클럭 이벤트 상태가 FreeRUN으로 변경되기 전의 시간(초)입니다.maxOffsetThreshold및minOffsetThreshold설정은CLOCK_REALTIME(phc2sys) 또는 master 오프셋(ptp4l)의 값과 비교하는 오프셋 값을 나노초로 구성합니다.ptp4l또는phc2sys오프셋 값이 이 범위를 벗어나는 경우 PTP 클럭 상태가 FreeRUN으로설정됩니다. 오프셋 값이 이 범위 내에 있으면 PTP 클럭 상태가LOCKED로 설정됩니다.권장프로필을 노드에 적용하는 방법에 대한 규칙을 정의하는 하나 이상의recommend오브젝트 배열을 지정합니다..recommend.profileprofile 섹션에 정의된
.recommend.오브젝트 이름을 지정합니다.profile.recommend.priority0에서99사이의 정수 값으로priority를 지정합니다. 숫자가 클수록 우선순위가 낮으므로 우선순위99는 우선순위10보다 낮습니다.match필드에 정의된 규칙에 따라 여러 프로필과 노드를 일치시킬 수 있는 경우 우선 순위가 높은 프로필이 해당 노드에 적용됩니다..recommend.matchnodeLabel또는nodeName값을 사용하여.recommend.match규칙을 지정합니다..recommend.match.nodeLabeloc get nodes --show-labels명령을 사용하여 노드 오브젝트에서node.Labels필드의키로nodeLabel을 설정합니다. 예:node-role.kubernetes.io/worker..recommend.match.nodeNameoc get nodes명령을 사용하여 노드 오브젝트의node.Name필드 값으로nodeName을 설정합니다. 예를 들면compute-1.example.com입니다.다음 명령을 실행하여 CR을 생성합니다.
$ oc create -f boundary-clock-ptp-config.yaml
검증
PtpConfig프로필이 노드에 적용되었는지 확인합니다.다음 명령을 실행하여
openshift-ptp네임스페이스에서 Pod 목록을 가져옵니다.$ oc get pods -n openshift-ptp -o wide출력 예
NAME                            READY   STATUS    RESTARTS   AGE   IP               NODE
linuxptp-daemon-4xkbb           1/1     Running   0          43m   10.1.196.24      compute-0.example.com
linuxptp-daemon-tdspf           1/1     Running   0          43m   10.1.196.25      compute-1.example.com
ptp-operator-657bbb64c8-2f8sj   1/1     Running   0          43m   10.129.0.61      control-plane-1.example.com
프로필이 올바른지 확인합니다.
PtpConfig프로필에 지정한 노드에 해당하는linuxptp데몬의 로그를 검사합니다. 다음 명령을 실행합니다.$ oc logs linuxptp-daemon-4xkbb -n openshift-ptp -c linuxptp-daemon-container출력 예
I1115 09:41:17.117596 4143292 daemon.go:107] in applyNodePTPProfile
I1115 09:41:17.117604 4143292 daemon.go:109] updating NodePTPProfile to:
I1115 09:41:17.117607 4143292 daemon.go:110] ------------------------------------
I1115 09:41:17.117612 4143292 daemon.go:102] Profile Name: profile1
I1115 09:41:17.117616 4143292 daemon.go:102] Interface:
I1115 09:41:17.117620 4143292 daemon.go:102] Ptp4lOpts: -2
I1115 09:41:17.117623 4143292 daemon.go:102] Phc2sysOpts: -a -r -n 24
I1115 09:41:17.117626 4143292 daemon.go:116] ------------------------------------
5.2.8.1. linuxptp 서비스를 듀얼 NIC 하드웨어의 경계 클럭으로 구성
각 NIC에 대해 PtpConfig CR(사용자 정의 리소스) 오브젝트를 생성하여 linuxptp 서비스(ptp4l,phc2sys)를 듀얼 NIC 하드웨어의 경계 클록으로 구성할 수 있습니다.
듀얼 NIC 하드웨어를 사용하면 각 NIC가 다운스트림 클록에 대해 별도의 ptp4l 인스턴스를 사용하여 각 NIC를 동일한 업스트림 리더 클록에 연결할 수 있습니다.
사전 요구 사항
-
OpenShift CLI(
oc)를 설치합니다. -
cluster-admin권한이 있는 사용자로 로그인합니다. - PTP Operator를 설치합니다.
프로세스
각 CR의 기준으로 "linuxptp 서비스를 경계 클록으로 구성"의 참조 CR을 사용하여 각 NIC에 대해 하나씩 두 개의 개별
PtpConfigCR을 생성합니다. 예를 들면 다음과 같습니다.phc2sysOpts: 값을 지정하여boundary-clock-ptp-config-nic1.yaml을 생성합니다.apiVersion: ptp.openshift.io/v1 kind: PtpConfig metadata: name: boundary-clock-ptp-config-nic1 namespace: openshift-ptp spec: profile: - name: "profile1" ptp4lOpts: "-2 --summary_interval -4" ptp4lConf: |1 [ens5f1] masterOnly 1 [ens5f0] masterOnly 0 ... phc2sysOpts: "-a -r -m -n 24 -N 8 -R 16"2 boundary-clock-ptp-config-nic2.yaml을 생성하여phc2sysOpts필드를 완전히 제거하여 두 번째 NIC에 대한phc2sys서비스를 비활성화합니다.apiVersion: ptp.openshift.io/v1 kind: PtpConfig metadata: name: boundary-clock-ptp-config-nic2 namespace: openshift-ptp spec: profile: - name: "profile2" ptp4lOpts: "-2 --summary_interval -4" ptp4lConf: |1 [ens7f1] masterOnly 1 [ens7f0] masterOnly 0 ...- 1
ptp4l을 두 번째 NIC에서 경계 클록으로 시작하는 데 필요한 인터페이스를 지정합니다.
참고두 번째 NIC에서
phc2sys서비스를 비활성화하려면 두 번째PtpConfigCR에서phc2sys필드를 완전히 제거해야 합니다.
다음 명령을 실행하여 듀얼 NIC
PtpConfigCR을 생성합니다.첫 번째 NIC에 대해 PTP를 구성하는 CR을 생성합니다.
$ oc create -f boundary-clock-ptp-config-nic1.yaml두 번째 NIC에 대해 PTP를 구성하는 CR을 생성합니다.
$ oc create -f boundary-clock-ptp-config-nic2.yaml
검증
PTP Operator가 두 NIC 모두에
PtpConfigCR을 적용했는지 확인합니다. 듀얼 NIC 하드웨어가 설치된 노드에 해당하는linuxptp데몬의 로그를 검사합니다. 예를 들어 다음 명령을 실행합니다.$ oc logs linuxptp-daemon-cvgr6 -n openshift-ptp -c linuxptp-daemon-container출력 예
ptp4l[80828.335]: [ptp4l.1.config] master offset          5 s2 freq   -5727 path delay       519
ptp4l[80828.343]: [ptp4l.0.config] master offset         -5 s2 freq  -10607 path delay       533
phc2sys[80828.390]: [ptp4l.0.config] CLOCK_REALTIME phc offset         1 s2 freq  -87239 delay    539
5.2.8.2. 듀얼 NIC Intel E810 PTP 경계 클록의 고가용성 시스템 클럭으로 linuxptp 구성
이중 PTP 경계 클럭(T-BC)의 linuxptp 서비스 ptp4l 및 phc2sys 를 고가용성(HA) 시스템 클럭으로 구성할 수 있습니다.
고가용성 시스템 클록은 두 개의 경계 클럭으로 구성된 듀얼 NIC Intel E810 Salesm 채널 하드웨어의 여러 시간 소스를 사용합니다. 두 개의 경계 클럭 인스턴스가 HA 설정에 참여하며 각각 고유한 구성 프로필이 있습니다. 각 NIC에 대해 별도의 ptp4l 인스턴스를 사용하여 각 NIC를 동일한 업스트림 리더 클록에 연결합니다.
NIC를 T-BC로 구성하는 두 개의 PtpConfig CR(사용자 정의 리소스) 오브젝트와 두 NIC 간에 고가용성을 구성하는 세 번째 PtpConfig CR을 생성합니다.
HA를 구성하는 PtpConfig CR에서 phc2SysOpts 옵션을 한 번 설정합니다. 두 NIC를 구성하는 PtpConfig CR의 phc2sysOpts 필드를 빈 문자열로 설정합니다. 이렇게 하면 두 프로필에 대해 개별 phc2sys 프로세스가 설정되지 않습니다.
세 번째 PtpConfig CR은 고가용성 시스템 클럭 서비스를 구성합니다. CR은 ptp4l 프로세스가 실행되지 않도록 ptp4lOpts 필드를 빈 문자열로 설정합니다. CR은 spec.profile.ptpSettings.haProfiles 키 아래에 ptp4l 구성에 대한 프로필을 추가하고 해당 프로필의 커널 소켓 경로를 phc2sys 서비스에 전달합니다. ptp4l 오류가 발생하면 phc2sys 서비스가 백업 ptp4l 구성으로 전환됩니다. 기본 프로필이 다시 활성화되면 phc2sys 서비스가 원래 상태로 되돌아갑니다.
HA를 구성하는 데 사용하는 세 가지 PtpConfig CR 모두에 대해 spec.recommend.priority 를 동일한 값으로 설정해야 합니다.
사전 요구 사항
-
OpenShift CLI(
oc)를 설치합니다. -
cluster-admin권한이 있는 사용자로 로그인합니다. - PTP Operator를 설치합니다.
- Intel E810 Salem 채널 듀얼 NIC로 클러스터 노드를 구성합니다.
프로세스
각 CR에 대한 참조로 "linuxptp 서비스를 경계 클록으로 구성"의 CR을 사용하여 각 NIC에 대해 하나씩 두 개의 개별
PtpConfigCR을 생성합니다.phc2sysOpts필드에 빈 문자열을 지정하여ha-ptp-config-nic1.yaml파일을 생성합니다. 예를 들면 다음과 같습니다.apiVersion: ptp.openshift.io/v1 kind: PtpConfig metadata: name: ha-ptp-config-nic1 namespace: openshift-ptp spec: profile: - name: "ha-ptp-config-profile1" ptp4lOpts: "-2 --summary_interval -4" ptp4lConf: |1 [ens5f1] masterOnly 1 [ens5f0] masterOnly 0 #... phc2sysOpts: ""2 다음 명령을 실행하여 NIC 1에 대해
PtpConfigCR을 적용합니다.$ oc create -f ha-ptp-config-nic1.yamlphc2sysOpts필드에 빈 문자열을 지정하여ha-ptp-config-nic2.yaml파일을 생성합니다. 예를 들면 다음과 같습니다.apiVersion: ptp.openshift.io/v1 kind: PtpConfig metadata: name: ha-ptp-config-nic2 namespace: openshift-ptp spec: profile: - name: "ha-ptp-config-profile2" ptp4lOpts: "-2 --summary_interval -4" ptp4lConf: | [ens7f1] masterOnly 1 [ens7f0] masterOnly 0 #... phc2sysOpts: ""다음 명령을 실행하여 NIC 2에 대해
PtpConfigCR을 적용합니다.$ oc create -f ha-ptp-config-nic2.yaml
HA 시스템 시계를 구성하는
PtpConfigCR을 생성합니다. 예를 들면 다음과 같습니다.ptp-config-for-ha.yaml파일을 생성합니다. 두 NIC를 구성하는PtpConfigCR에 설정된metadata.name필드와 일치하도록haProfiles를 설정합니다. 예:haProfiles: ha-ptp-config-nic1,ha-ptp-config-nic2apiVersion: ptp.openshift.io/v1 kind: PtpConfig metadata: name: boundary-ha namespace: openshift-ptp annotations: {} spec: profile: - name: "boundary-ha" ptp4lOpts: ""1 phc2sysOpts: "-a -r -n 24" ptpSchedulingPolicy: SCHED_FIFO ptpSchedulingPriority: 10 ptpSettings: logReduce: "true" haProfiles: "$profile1,$profile2" recommend: - profile: "boundary-ha" priority: 4 match: - nodeLabel: "node-role.kubernetes.io/$mcp"- 1
ptp4lOpts필드를 빈 문자열로 설정합니다. 비어 있지 않으면p4ptl프로세스가 중요한 오류로 시작됩니다.
중요개별 NIC를 구성하는
PtpConfigCR 전에 고가용성PtpConfigCR을 적용하지 마십시오.다음 명령을 실행하여 HA
PtpConfigCR을 적용합니다.$ oc create -f ptp-config-for-ha.yaml
검증
PTP Operator에서
PtpConfigCR을 올바르게 적용했는지 확인합니다. 다음 단계를 수행합니다.다음 명령을 실행하여
openshift-ptp네임스페이스에서 Pod 목록을 가져옵니다.$ oc get pods -n openshift-ptp -o wide출력 예
NAME READY STATUS RESTARTS AGE IP NODE linuxptp-daemon-4xkrb 1/1 Running 0 43m 10.1.196.24 compute-0.example.com ptp-operator-657bbq64c8-2f8sj 1/1 Running 0 43m 10.129.0.61 control-plane-1.example.com참고linuxptp-daemonPod가 하나만 있어야 합니다.다음 명령을 실행하여 프로필이 올바른지 확인합니다.
PtpConfig프로필에 지정한 노드에 해당하는linuxptp데몬의 로그를 검사합니다.$ oc logs linuxptp-daemon-4xkrb -n openshift-ptp -c linuxptp-daemon-container출력 예
I1115 09:41:17.117596 4143292 daemon.go:107] in applyNodePTPProfile
I1115 09:41:17.117604 4143292 daemon.go:109] updating NodePTPProfile to:
I1115 09:41:17.117607 4143292 daemon.go:110] ------------------------------------
I1115 09:41:17.117612 4143292 daemon.go:102] Profile Name: ha-ptp-config-profile1
I1115 09:41:17.117616 4143292 daemon.go:102] Interface:
I1115 09:41:17.117620 4143292 daemon.go:102] Ptp4lOpts: -2
I1115 09:41:17.117623 4143292 daemon.go:102] Phc2sysOpts: -a -r -n 24
I1115 09:41:17.117626 4143292 daemon.go:116] ------------------------------------
5.2.9. linuxptp 서비스를 일반 클록으로 구성
PtpConfig CR(사용자 정의 리소스) 오브젝트를 생성하여 linuxptp 서비스(ptp4l,phc2sys)를 일반 클록으로 구성할 수 있습니다.
다음 예제 PtpConfig CR을 기반으로 linuxptp 서비스를 특정 하드웨어 및 환경의 일반 클록으로 구성합니다. 이 예제 CR에서는 PTP 빠른 이벤트를 구성하지 않습니다. PTP 빠른 이벤트를 구성하려면 ptp4lOpts,ptp4lConf 및 ptpClockThreshold 에 적절한 값을 설정합니다. ptpClockThreshold 는 이벤트가 활성화된 경우에만 필요합니다. 자세한 내용은 " PTP 빠른 이벤트 알림 게시자 구성"을 참조하십시오.
사전 요구 사항
-
OpenShift CLI(
oc)를 설치합니다. -
cluster-admin권한이 있는 사용자로 로그인합니다. - PTP Operator를 설치합니다.
프로세스
다음
PtpConfigCR을 생성한 다음 YAML을ordinary-clock-ptp-config.yaml파일에 저장합니다.PTP 일반 클럭 구성의 예
apiVersion: ptp.openshift.io/v1
kind: PtpConfig
metadata:
  name: ordinary-clock
  namespace: openshift-ptp
  annotations: {}
spec:
  profile:
    - name: ordinary-clock
      # The interface name is hardware-specific
      interface: $interface
      ptp4lOpts: "-2 -s"
      phc2sysOpts: "-a -r -n 24"
      ptpSchedulingPolicy: SCHED_FIFO
      ptpSchedulingPriority: 10
      ptpSettings:
        logReduce: "true"
      ptp4lConf: |
        [global]
        #
        # Default Data Set
        #
        twoStepFlag 1
        slaveOnly 1
        priority1 128
        priority2 128
        domainNumber 24
        #utc_offset 37
        clockClass 255
        clockAccuracy 0xFE
        offsetScaledLogVariance 0xFFFF
        free_running 0
        freq_est_interval 1
        dscp_event 0
        dscp_general 0
        dataset_comparison G.8275.x
        G.8275.defaultDS.localPriority 128
        #
        # Port Data Set
        #
        logAnnounceInterval -3
        logSyncInterval -4
        logMinDelayReqInterval -4
        logMinPdelayReqInterval -4
        announceReceiptTimeout 3
        syncReceiptTimeout 0
        delayAsymmetry 0
        fault_reset_interval -4
        neighborPropDelayThresh 20000000
        masterOnly 0
        G.8275.portDS.localPriority 128
        #
        # Run time options
        #
        assume_two_step 0
        logging_level 6
        path_trace_enabled 0
        follow_up_info 0
        hybrid_e2e 0
        inhibit_multicast_service 0
        net_sync_monitor 0
        tc_spanning_tree 0
        tx_timestamp_timeout 50
        unicast_listen 0
        unicast_master_table 0
        unicast_req_duration 3600
        use_syslog 1
        verbose 0
        summary_interval 0
        kernel_leap 1
        check_fup_sync 0
        clock_class_threshold 7
        #
        # Servo Options
        #
        pi_proportional_const 0.0
        pi_integral_const 0.0
        pi_proportional_scale 0.0
        pi_proportional_exponent -0.3
        pi_proportional_norm_max 0.7
        pi_integral_scale 0.0
        pi_integral_exponent 0.4
        pi_integral_norm_max 0.3
        step_threshold 2.0
        first_step_threshold 0.00002
        max_frequency 900000000
        clock_servo pi
        sanity_freq_limit 200000000
        ntpshm_segment 0
        #
        # Transport options
        #
        transportSpecific 0x0
        ptp_dst_mac 01:1B:19:00:00:00
        p2p_dst_mac 01:80:C2:00:00:0E
        udp_ttl 1
        udp6_scope 0x0E
        uds_address /var/run/ptp4l
        #
        # Default interface options
        #
        clock_type OC
        network_transport L2
        delay_mechanism E2E
        time_stamping hardware
        tsproc_mode filter
        delay_filter moving_median
        delay_filter_length 10
        egressLatency 0
        ingressLatency 0
        boundary_clock_jbod 0
        #
        # Clock description
        #
        productDescription ;;
        revisionData ;;
        manufacturerIdentity 00:00:00
        userDescription ;
        timeSource 0xA0
  recommend:
    - profile: ordinary-clock
      priority: 4
      match:
        - nodeLabel: "node-role.kubernetes.io/$mcp"
Expand 표 5.8. PTP 일반 클럭 CR 구성 옵션 CR 필드 설명 namePtpConfigCR의 이름입니다.profile하나 이상의
profile오브젝트의 배열을 지정합니다. 각 프로필의 이름은 고유해야 합니다.interfaceptp4l서비스에서 사용할 네트워크 인터페이스를 지정합니다(예:ens787f1).ptp4lOptsptp4l서비스에 대한 시스템 구성 옵션을 지정합니다(예:-2)는 IEEE 802.3 네트워크 전송을 선택합니다. 옵션은 네트워크 인터페이스 이름과 서비스 구성 파일이 자동으로 추가되므로 네트워크 인터페이스 이름-i <interface>및 서비스 구성 파일-f /etc/ptp4l.conf를 포함하지 않아야 합니다. 이 인터페이스에서 PTP 빠른 이벤트를 사용하려면--summary_interval -4를 추가합니다.phc2sysOptsphc2sys서비스에 대한 시스템 구성 옵션을 지정합니다. 이 필드가 비어 있으면 PTP Operator에서phc2sys서비스를 시작하지 않습니다. Intel Columbiaville 800 시리즈 NIC의 경우phc2sysOpts옵션을-a -r -m -n 24 -N 8 -R 16으로 설정합니다.-m은 메시지를stdout에 출력합니다.linuxptp-daemonDaemonSet은 로그를 구문 분석하고 Prometheus 지표를 생성합니다.ptp4lConf기본
/etc/ptp4l.conf파일을 대체할 구성이 포함된 문자열을 지정합니다. 기본 구성을 사용하려면 필드를 비워 둡니다.tx_timestamp_timeoutIntel Columbiaville 800 시리즈 NIC의 경우
tx_timestamp_timeout을50으로 설정합니다.boundary_clock_jbodIntel Columbiaville 800 시리즈 NIC의 경우
boundary_clock_jbod를0으로 설정합니다.ptpSchedulingPolicyptp4l및phc2sys프로세스에 대한 스케줄링 정책. 기본값은 Cryostat_OTHER입니다. FIFO 스케줄링을 지원하는 시스템에서 Cryostat_FIFO를 사용합니다.ptpSchedulingPriorityptpSchedulingPolicy가 Cryostat_FIFO로 설정된 경우ptp4l및phc2sys프로세스의 FIFO 우선 순위를 설정하는 데 사용되는 1-65의 정수 값입니다.ptpSchedulingPolicy가 ptpSchedulingPolicy로 설정된 경우ptpSchedulingPriority필드는 사용되지않습니다.ptpClockThreshold선택 사항:
ptpClockThreshold가 없으면ptpClockThreshold필드에 기본값이 사용됩니다.ptpClockThreshold는 PTP 이벤트가 트리거되기 전에 PTP 마스터 클록의 연결이 해제된 후의 시간을 구성합니다.holdOverTimeout은 PTP 마스터 클록의 연결이 끊어지면 PTP 클럭 이벤트 상태가 FreeRUN으로 변경되기 전의 시간(초)입니다.maxOffsetThreshold및minOffsetThreshold설정은CLOCK_REALTIME(phc2sys) 또는 master 오프셋(ptp4l)의 값과 비교하는 오프셋 값을 나노초로 구성합니다.ptp4l또는phc2sys오프셋 값이 이 범위를 벗어나는 경우 PTP 클럭 상태가 FreeRUN으로설정됩니다. 오프셋 값이 이 범위 내에 있으면 PTP 클럭 상태가LOCKED로 설정됩니다.권장프로필을 노드에 적용하는 방법에 대한 규칙을 정의하는 하나 이상의recommend오브젝트 배열을 지정합니다..recommend.profileprofile 섹션에 정의된
.recommend.오브젝트 이름을 지정합니다.profile.recommend.priority일반 클록의 경우
.recommend.priority를0으로 설정합니다..recommend.matchnodeLabel또는nodeName값을 사용하여.recommend.match규칙을 지정합니다..recommend.match.nodeLabeloc get nodes --show-labels명령을 사용하여 노드 오브젝트에서node.Labels필드의키로nodeLabel을 설정합니다. 예:node-role.kubernetes.io/worker..recommend.match.nodeNameoc get nodes명령을 사용하여 노드 오브젝트의node.Name필드 값으로nodeName을 설정합니다. 예를 들면compute-1.example.com입니다.다음 명령을 실행하여
PtpConfigCR을 생성합니다.$ oc create -f ordinary-clock-ptp-config.yaml
검증
PtpConfig프로필이 노드에 적용되었는지 확인합니다.다음 명령을 실행하여
openshift-ptp네임스페이스에서 Pod 목록을 가져옵니다.$ oc get pods -n openshift-ptp -o wide출력 예
NAME                            READY   STATUS    RESTARTS   AGE   IP               NODE
linuxptp-daemon-4xkbb           1/1     Running   0          43m   10.1.196.24      compute-0.example.com
linuxptp-daemon-tdspf           1/1     Running   0          43m   10.1.196.25      compute-1.example.com
ptp-operator-657bbb64c8-2f8sj   1/1     Running   0          43m   10.129.0.61      control-plane-1.example.com
프로필이 올바른지 확인합니다.
PtpConfig프로필에 지정한 노드에 해당하는linuxptp데몬의 로그를 검사합니다. 다음 명령을 실행합니다.$ oc logs linuxptp-daemon-4xkbb -n openshift-ptp -c linuxptp-daemon-container출력 예
I1115 09:41:17.117596 4143292 daemon.go:107] in applyNodePTPProfile
I1115 09:41:17.117604 4143292 daemon.go:109] updating NodePTPProfile to:
I1115 09:41:17.117607 4143292 daemon.go:110] ------------------------------------
I1115 09:41:17.117612 4143292 daemon.go:102] Profile Name: profile1
I1115 09:41:17.117616 4143292 daemon.go:102] Interface: ens787f1
I1115 09:41:17.117620 4143292 daemon.go:102] Ptp4lOpts: -2 -s
I1115 09:41:17.117623 4143292 daemon.go:102] Phc2sysOpts: -a -r -n 24
I1115 09:41:17.117626 4143292 daemon.go:116] ------------------------------------
5.2.9.1. Intel Columbiaville E800 시리즈 NIC를 PTP 일반 클럭 참조
다음 표에서는 Intel Columbiaville E800 시리즈 NIC를 일반 클록으로 사용하기 위해 참조 PTP 구성에 대해 설명합니다. 클러스터에 적용하는 PtpConfig CR(사용자 정의 리소스)을 변경합니다.
| PTP 구성 | 권장 설정 |
|---|---|
|
|
|
|
|
|
|
|
|
phc2sysOpts 의 경우-m 은 메시지를 stdout 에 출력합니다. linuxptp-daemon DaemonSet 은 로그를 구문 분석하고 Prometheus 지표를 생성합니다.
5.2.9.2. 이중 포트 NIC 중복성을 사용하여 linuxptp 서비스를 일반 클록으로 구성
PtpConfig CR(사용자 정의 리소스) 오브젝트를 생성하여 linuxptp 서비스(ptp4l,phc2sys)를 듀얼 포트 NIC 중복성을 사용하여 일반 클록으로 구성할 수 있습니다. 일반 클록에 대한 듀얼 포트 NIC 구성에서 하나의 포트가 실패하면 대기 포트를 인수하여 PTP 타이밍 동기화를 유지합니다.
이중 포트 NIC 중복을 사용하는 일반 클록으로 linuxptp 서비스를 구성하는 것은 기술 프리뷰 기능 전용입니다. 기술 프리뷰 기능은 Red Hat 프로덕션 서비스 수준 계약(SLA)에서 지원되지 않으며 기능적으로 완전하지 않을 수 있습니다. 따라서 프로덕션 환경에서 사용하는 것은 권장하지 않습니다. 이러한 기능을 사용하면 향후 제품 기능을 조기에 이용할 수 있어 개발 과정에서 고객이 기능을 테스트하고 피드백을 제공할 수 있습니다.
Red Hat 기술 프리뷰 기능의 지원 범위에 대한 자세한 내용은 기술 프리뷰 기능 지원 범위를 참조하십시오.
사전 요구 사항
-
OpenShift CLI(
oc)를 설치합니다. -
cluster-admin권한이 있는 사용자로 로그인합니다. - PTP Operator를 설치합니다.
- 노드는 듀얼 포트 NIC가 있는 x86_64 아키텍처를 사용합니다.
프로세스
다음
PtpConfigCR을 생성한 다음 YAML을oc-dual-port-ptp-config.yaml파일에 저장합니다.PTP 일반 클럭 듀얼 포트 구성의 예
apiVersion: ptp.openshift.io/v1
kind: PtpConfig
metadata:
  name: ordinary-clock-1
  namespace: openshift-ptp
spec:
  profile:
  - name: oc-dual-port
    phc2sysOpts: -a -r -n 24 -N 8 -R 16 -u 0
1 ptp4lConf: |-2 [ens3f2] masterOnly 0 [ens3f3] masterOnly 0 [global] # # Default Data Set # slaveOnly 13 #...다음 명령을 실행하여
PtpConfigCR을 생성합니다.$ oc create -f oc-dual-port-ptp-config.yaml
검증
PtpConfig프로필이 노드에 적용되었는지 확인합니다.다음 명령을 실행하여
openshift-ptp네임스페이스에서 Pod 목록을 가져옵니다.$ oc get pods -n openshift-ptp -o wide출력 예
NAME                            READY   STATUS    RESTARTS   AGE   IP               NODE
linuxptp-daemon-4xkbb           1/1     Running   0          43m   10.1.196.24      compute-0.example.com
linuxptp-daemon-tdspf           1/1     Running   0          43m   10.1.196.25      compute-1.example.com
ptp-operator-657bbb64c8-2f8sj   1/1     Running   0          43m   10.129.0.61      control-plane-1.example.com
프로필이 올바른지 확인합니다.
PtpConfig프로필에 지정한 노드에 해당하는linuxptp데몬의 로그를 검사합니다. 다음 명령을 실행합니다.$ oc logs linuxptp-daemon-4xkbb -n openshift-ptp -c linuxptp-daemon-container출력 예
I1115 09:41:17.117596 4143292 daemon.go:107] in applyNodePTPProfile
I1115 09:41:17.117604 4143292 daemon.go:109] updating NodePTPProfile to:
I1115 09:41:17.117607 4143292 daemon.go:110] ------------------------------------
I1115 09:41:17.117612 4143292 daemon.go:102] Profile Name: oc-dual-port
I1115 09:41:17.117616 4143292 daemon.go:102] Interface: ens787f1
I1115 09:41:17.117620 4143292 daemon.go:102] Ptp4lOpts: -2 --summary_interval -4
I1115 09:41:17.117623 4143292 daemon.go:102] Phc2sysOpts: -a -r -n 24 -N 8 -R 16 -u 0
I1115 09:41:17.117626 4143292 daemon.go:116] ------------------------------------
5.2.10. PTP 하드웨어에 대한 FIFO 우선순위 스케줄링 구성
대기 시간이 짧은 통신 또는 기타 배포 유형에서는 PTP 데몬 스레드는 나머지 인프라 구성 요소와 함께 제한된 CPU 풋프린트에서 실행됩니다. 기본적으로 PTP 스레드는 Cryostat _OTHER 정책으로 실행됩니다. 로드가 높은 상태에서 이러한 스레드는 오류가 없는 작업에 필요한 스케줄링 대기 시간을 얻지 못할 수 있습니다.
잠재적인 스케줄링 대기 시간 오류를 완화하기 위해 PTP Operator linuxptp 서비스를 구성하여 스레드가 a Cryostat _FIFO 정책으로 실행되도록 할 수 있습니다. PtpConfig CR에 대해 Cryostat _FIFO 가 설정된 경우 ptp4l 및 phc2sys 는 PtpConfig CR의 ptpSchedulingPriority 필드에 의해 설정된 우선순위를 가진 chrt 아래의 상위 컨테이너에서 실행됩니다.
ptpSchedulingPolicy 설정은 선택 사항이며 대기 시간 오류가 발생하는 경우에만 필요합니다.
프로세스
PtpConfigCR 프로필을 편집합니다.$ oc edit PtpConfig -n openshift-ptpptpSchedulingPolicy및ptpSchedulingPriority필드를 변경합니다.apiVersion: ptp.openshift.io/v1 kind: PtpConfig metadata: name: <ptp_config_name> namespace: openshift-ptp ... spec: profile: - name: "profile1" ... ptpSchedulingPolicy: SCHED_FIFO1 ptpSchedulingPriority: 102 -
저장하고 종료하여
PtpConfigCR에 변경 사항을 적용합니다.
검증
linuxptp-daemonPod의 이름과PtpConfigCR이 적용된 해당 노드를 가져옵니다.$ oc get pods -n openshift-ptp -o wide출력 예
NAME                            READY   STATUS    RESTARTS   AGE     IP            NODE
linuxptp-daemon-gmv2n           3/3     Running   0          1d17h   10.1.196.24   compute-0.example.com
linuxptp-daemon-lgm55           3/3     Running   0          1d17h   10.1.196.25   compute-1.example.com
ptp-operator-3r4dcvf7f4-zndk7   1/1     Running   0          1d7h    10.129.0.61   control-plane-1.example.com
업데이트된
chrtFIFO 우선 순위로ptp4l프로세스가 실행 중인지 확인합니다.$ oc -n openshift-ptp logs linuxptp-daemon-lgm55 -c linuxptp-daemon-container|grep chrt출력 예
I1216 19:24:57.091872 1600715 daemon.go:285] /bin/chrt -f 65 /usr/sbin/ptp4l -f /var/run/ptp4l.0.config -2 --summary_interval -4 -m
5.2.11. linuxptp 서비스에 대한 로그 필터링 구성
linuxptp 데몬은 디버깅을 위해 사용할 수 있는 로그를 생성합니다. 제한된 스토리지 용량을 제공하는 통신 또는 기타 배포 유형에서는 이러한 로그가 스토리지 요구에 추가할 수 있습니다.
수 로그 메시지를 줄이기 위해 마스터 오프셋 값을 보고하는 로그 메시지를 제외하도록 PtpConfig CR(사용자 정의 리소스)을 구성할 수 있습니다. 마스터 오프셋 로그 메시지는 현재 노드의 클록과 나노초의 마스터 클록의 차이를 보고합니다.
사전 요구 사항
-
OpenShift CLI(
oc)를 설치합니다. -
cluster-admin권한이 있는 사용자로 로그인합니다. - PTP Operator를 설치합니다.
프로세스
PtpConfigCR을 편집합니다.$ oc edit PtpConfig -n openshift-ptpspec.profile에서ptpSettings.logReduce사양을 추가하고 값을true로 설정합니다.apiVersion: ptp.openshift.io/v1 kind: PtpConfig metadata: name: <ptp_config_name> namespace: openshift-ptp ... spec: profile: - name: "profile1" ... ptpSettings: logReduce: "true"참고디버깅을 위해 이 사양을
False로 되돌리고 마스터 오프셋 메시지를 포함할 수 있습니다.-
저장하고 종료하여
PtpConfigCR에 변경 사항을 적용합니다.
검증
linuxptp-daemonPod의 이름과PtpConfigCR이 적용된 해당 노드를 가져옵니다.$ oc get pods -n openshift-ptp -o wide출력 예
NAME                            READY   STATUS    RESTARTS   AGE     IP            NODE
linuxptp-daemon-gmv2n           3/3     Running   0          1d17h   10.1.196.24   compute-0.example.com
linuxptp-daemon-lgm55           3/3     Running   0          1d17h   10.1.196.25   compute-1.example.com
ptp-operator-3r4dcvf7f4-zndk7   1/1     Running   0          1d7h    10.129.0.61   control-plane-1.example.com
다음 명령을 실행하여 마스터 오프셋 메시지가 로그에서 제외되었는지 확인합니다.
$ oc -n openshift-ptp logs <linux_daemon_container> -c linuxptp-daemon-container | grep "master offset"1 - 1
- <linux_daemon_container>는
linuxptp-daemonPod의 이름입니다(예:linuxptp-daemon-gmv2n).
logReduce사양을 구성할 때 이 명령은linuxptp데몬의 로그에마스터 오프셋의 인스턴스를 보고하지 않습니다.
5.2.12. 일반적인 PTP Operator 문제 해결
다음 단계를 수행하여 PTP Operator의 일반적인 문제를 해결합니다.
사전 요구 사항
-
OpenShift Container Platform CLI (
oc)를 설치합니다. -
cluster-admin권한이 있는 사용자로 로그인합니다. - PTP를 지원하는 호스트가 있는 베어 메탈 클러스터에 PTP Operator를 설치합니다.
프로세스
구성된 노드를 위해 Operator 및 Operand가 클러스터에 성공적으로 배포되었는지 확인합니다.
$ oc get pods -n openshift-ptp -o wide출력 예
NAME READY STATUS RESTARTS AGE IP NODE linuxptp-daemon-lmvgn 3/3 Running 0 4d17h 10.1.196.24 compute-0.example.com linuxptp-daemon-qhfg7 3/3 Running 0 4d17h 10.1.196.25 compute-1.example.com ptp-operator-6b8dcbf7f4-zndk7 1/1 Running 0 5d7h 10.129.0.61 control-plane-1.example.com참고PTP 빠른 이벤트 버스가 활성화되면 준비된
linuxptp-daemonPod 수는3/3가 됩니다. PTP 빠른 이벤트 버스가 활성화되지 않으면2/2가 표시됩니다.지원되는 하드웨어가 클러스터에 있는지 확인합니다.
$ oc -n openshift-ptp get nodeptpdevices.ptp.openshift.io출력 예
NAME                                  AGE
control-plane-0.example.com           10d
control-plane-1.example.com           10d
compute-0.example.com                 10d
compute-1.example.com                 10d
compute-2.example.com                 10d
노드에 사용 가능한 PTP 네트워크 인터페이스를 확인합니다.
$ oc -n openshift-ptp get nodeptpdevices.ptp.openshift.io <node_name> -o yaml다음과 같습니다.
- <node_name>
쿼리할 노드를 지정합니다 (예:
compute-0.example.com).출력 예
apiVersion: ptp.openshift.io/v1
kind: NodePtpDevice
metadata:
  creationTimestamp: "2021-09-14T16:52:33Z"
  generation: 1
  name: compute-0.example.com
  namespace: openshift-ptp
  resourceVersion: "177400"
  uid: 30413db0-4d8d-46da-9bef-737bacd548fd
spec: {}
status:
  devices:
  - name: eno1
  - name: eno2
  - name: eno3
  - name: eno4
  - name: enp5s0f0
  - name: enp5s0f1
해당 노드의
linuxptp-daemonPod에 액세스하여 PTP 인터페이스가 기본 클록에 성공적으로 동기화되었는지 확인합니다.다음 명령을 실행하여
linuxptp-daemonPod의 이름과 문제를 해결하려는 해당 노드를 가져옵니다.$ oc get pods -n openshift-ptp -o wide출력 예
NAME                            READY   STATUS    RESTARTS   AGE     IP            NODE
linuxptp-daemon-lmvgn           3/3     Running   0          4d17h   10.1.196.24   compute-0.example.com
linuxptp-daemon-qhfg7           3/3     Running   0          4d17h   10.1.196.25   compute-1.example.com
ptp-operator-6b8dcbf7f4-zndk7   1/1     Running   0          5d7h    10.129.0.61   control-plane-1.example.com
필수
linuxptp-daemon컨테이너로의 원격 쉘:$ oc rsh -n openshift-ptp -c linuxptp-daemon-container <linux_daemon_container>다음과 같습니다.
- <linux_daemon_container>
-
진단할 컨테이너입니다 (예:
linuxptp-daemon-lmvgn).
linuxptp-daemon컨테이너에 대한 원격 쉘 연결에서 PTP 관리 클라이언트(pmc) 툴을 사용하여 네트워크 인터페이스를 진단합니다. 다음pmc명령을 실행하여 PTP 장치의 동기화 상태를 확인합니다(예:ptp4l).# pmc -u -f /var/run/ptp4l.0.config -b 0 'GET PORT_DATA_SET'노드가 기본 클록에 성공적으로 동기화되었을 때의 출력 예
sending: GET PORT_DATA_SET
    40a6b7.fffe.166ef0-1 seq 0 RESPONSE MANAGEMENT PORT_DATA_SET
        portIdentity            40a6b7.fffe.166ef0-1
        portState               SLAVE
        logMinDelayReqInterval  -4
        peerMeanPathDelay       0
        logAnnounceInterval     -3
        announceReceiptTimeout  3
        logSyncInterval         -4
        delayMechanism          1
        logMinPdelayReqInterval -4
        versionNumber           2
GNSS 소싱 할 마스터 클록의 경우 in-tree NIC 아이스크림 드라이버가 다음 명령을 실행하여 올바른지 확인합니다. 예를 들면 다음과 같습니다.
$ oc rsh -n openshift-ptp -c linuxptp-daemon-container linuxptp-daemon-74m2g ethtool -i ens7f0출력 예
driver: ice
version: 5.14.0-356.bz2232515.el9.x86_64
firmware-version: 4.20 0x8001778b 1.3346.0
GNSS 소싱된 마스터 클록의 경우
linuxptp-daemon컨테이너가 GNSS radio에서 신호를 수신하고 있는지 확인합니다. 컨테이너가 GNSS 신호를 수신하지 않으면/dev/gnss0파일이 채워지지 않습니다. 확인하려면 다음 명령을 실행합니다.$ oc rsh -n openshift-ptp -c linuxptp-daemon-container linuxptp-daemon-jnz6r cat /dev/gnss0출력 예
$GNRMC,125223.00,A,4233.24463,N,07126.64561,W,0.000,,300823,,,A,V*0A
$GNVTG,,T,,M,0.000,N,0.000,K,A*3D
$GNGGA,125223.00,4233.24463,N,07126.64561,W,1,12,99.99,98.6,M,-33.1,M,,*7E
$GNGSA,A,3,25,17,19,11,12,06,05,04,09,20,,,99.99,99.99,99.99,1*37
$GPGSV,3,1,10,04,12,039,41,05,31,222,46,06,50,064,48,09,28,064,42,1*62
5.2.13. Intel 800 시리즈 NIC에서 CGU의 DPLL 펌웨어 버전 가져오기
클러스터 노드에 디버그 쉘을 열고 NIC 하드웨어를 쿼리하여 Intel 800 시리즈 NIC에서 Clock Generation Unit (CGU)의 Clock Generation Unit (CGU)의 디지털 DPLL( phase-locked loop) 펌웨어 버전을 가져올 수 있습니다.
사전 요구 사항
-
OpenShift CLI(
oc)가 설치되어 있습니다. -
cluster-admin권한이 있는 사용자로 로그인했습니다. - 클러스터 호스트에 Intel 800 시리즈 NIC를 설치했습니다.
- PTP를 지원하는 호스트를 사용하여 베어 메탈 클러스터에 PTP Operator를 설치했습니다.
프로세스
다음 명령을 실행하여 디버그 Pod를 시작합니다.
$ oc debug node/<node_name>다음과 같습니다.
- <node_name>
- Intel 800 시리즈 NIC를 설치한 노드입니다.
devlink툴과 NIC가 설치된 버스 및 장치 이름을 사용하여 NIC의 CGU 펌웨어 버전을 확인합니다. 예를 들어 다음 명령을 실행합니다.sh-4.4# devlink dev info <bus_name>/<device_name> | grep cgu다음과 같습니다.
- <bus_name>
-
NIC가 설치된 버스입니다. 예:
pci. - <device_name>
-
NIC 장치 이름입니다. 예를 들면
0000:51:00.0입니다.
출력 예
cgu.id 361 fw.cgu 8032.16973825.60212 참고펌웨어 버전에는 버전 번호의 각 부분에 대해 선행 nibble 및 3 옥텟이 있습니다. 바이너리의
16973825번호는0001 0000 0011 0000 0000 0001입니다. 바이너리 값을 사용하여 펌웨어 버전을 디코딩합니다. 예를 들면 다음과 같습니다.Expand 표 5.10. DPLL 펌웨어 버전 바이너리 부분 10진수 값 00011
0000 00113
0000 00000
0000 00011
5.2.14. PTP Operator 데이터 수집
oc adm must-gather 명령을 사용하여 PTP Operator와 관련된 기능 및 오브젝트를 포함하여 클러스터에 대한 정보를 수집할 수 있습니다.
사전 요구 사항
-
cluster-admin역할의 사용자로 클러스터에 액세스할 수 있어야 합니다. -
OpenShift CLI(
oc)가 설치되어 있습니다. - PTP Operator를 설치했습니다.
프로세스
must-gather를 사용하여 PTP Operator 데이터를 수집하려면 PTP Operatormust-gather이미지를 지정해야 합니다.$ oc adm must-gather --image=registry.redhat.io/openshift4/ptp-must-gather-rhel9:v4.18
5.3. REST API v2를 사용하여 PTP 이벤트 소비자 애플리케이션 개발
베어 메탈 클러스터 노드에서 PTP(Precision Time Protocol) 이벤트를 사용하는 소비자 애플리케이션을 개발할 때 별도의 애플리케이션 포드에 소비자 애플리케이션을 배포합니다. 소비자 애플리케이션은 PTP 이벤트 REST API v2를 사용하여 PTP 이벤트를 서브스크립션합니다.
다음 정보는 PTP 이벤트를 사용하는 소비자 애플리케이션을 개발하기 위한 일반적인 지침을 제공합니다. 전체 이벤트 소비자 애플리케이션 예제는 이 정보의 범위를 벗어납니다.
5.3.1. PTP 빠른 이벤트 알림 프레임워크 정보
PTP(Precision Time Protocol) 빠른 이벤트 REST API v2를 사용하여 베어 메탈 클러스터 노드에서 생성하는 PTP 이벤트에 클러스터 애플리케이션을 서브스크립션합니다.
빠른 이벤트 알림 프레임워크는 통신에 REST API를 사용합니다. PTP 이벤트 REST API v1 및 v2는 O-RAN ALLIANCE 사양에서 사용할 수 있는 이벤트 소비자 4.0의 O-RAN O-Cloud 알림 API 사양 을 기반으로 합니다.
PTP 이벤트 REST API v2만 O-RAN v4와 호환됩니다.
5.3.2. PTP 이벤트 REST API v2를 사용하여 PTP 이벤트 검색
애플리케이션은 생산자 측 클라우드 이벤트 프록시 사이드카에서 O-RAN v4 호환 REST API를 사용하여 PTP 이벤트에 서브스크립션합니다. cloud-event-proxy 사이드카 컨테이너는 기본 애플리케이션의 리소스를 사용하지 않고 대기 시간 없이 기본 애플리케이션 컨테이너와 동일한 리소스에 액세스할 수 있습니다.
그림 5.6. PTP 이벤트 생산자 REST API v2의 PTP 빠른 이벤트 사용 개요

-
 클러스터 호스트에서 이벤트가 생성됩니다.
 -
PTP Operator 관리 Pod의
linuxptp-daemon프로세스는 KubernetesDaemonSet로 실행되며 다양한linuxptp프로세스(ptp4l,phc2sys, 선택 사항으로 마스터 클록,ts2phc)를 관리합니다.linuxptp-daemon은 이벤트를 UNIX 도메인 소켓에 전달합니다. -
 이벤트는 cloud-event-proxy 사이드카에 전달됩니다.
 -
PTP 플러그인은 UNIX 도메인 소켓에서 이벤트를 읽고 PTP Operator 관리 Pod의
cloud-event-proxy사이드카에 전달합니다.cloud-event-proxy는 Kubernetes 인프라에서 대기 시간이 짧은 CNF(Cloud-Native Network Functions)로 이벤트를 제공합니다. -
 이벤트가 게시됨
 -
PTP Operator 관리 Pod의
cloud-event-proxy사이드카는 이벤트를 처리하고 PTP 이벤트 REST API v2를 사용하여 이벤트를 게시합니다. -
 소비자 애플리케이션은 서브스크립션을 요청하고 서브스크립션 이벤트를 수신
 -
소비자 애플리케이션은 API 요청을 생산자
cloud-event-proxy사이드카로 전송하여 PTP 이벤트 서브스크립션을 생성합니다. 서브스크립션하면 소비자 애플리케이션은 리소스 한정자에 지정된 주소를 수신 대기하고 PTP 이벤트를 수신하고 처리합니다.
5.3.3. PTP 빠른 이벤트 알림 게시자 구성
클러스터에서 네트워크 인터페이스에 PTP 빠른 이벤트 알림을 사용하려면 PTP Operator PtpOperatorConfig CR(사용자 정의 리소스)에서 빠른 이벤트 게시자를 활성화하고 생성한 PtpConfig CR에서 ptpClockThreshold 값을 구성해야 합니다.
사전 요구 사항
-
OpenShift Container Platform CLI(
oc)를 설치했습니다. -
cluster-admin권한이 있는 사용자로 로그인했습니다. - PTP Operator를 설치했습니다.
프로세스
기본 PTP Operator 구성을 수정하여 PTP 빠른 이벤트를 활성화합니다.
다음 YAML을
ptp-operatorconfig.yaml파일에 저장합니다.apiVersion: ptp.openshift.io/v1 kind: PtpOperatorConfig metadata: name: default namespace: openshift-ptp spec: daemonNodeSelector: node-role.kubernetes.io/worker: "" ptpEventConfig: apiVersion: "2.0"1 enableEventPublisher: true2 참고OpenShift Container Platform 4.13 이상에서는 PTP 이벤트에 HTTP 전송을 사용할 때
PtpOperatorConfig리소스에서spec.ptpEventConfig.transportHost필드를 설정할 필요가 없습니다.PtpOperatorConfigCR을 업데이트합니다.$ oc apply -f ptp-operatorconfig.yaml
PTP가 활성화된 인터페이스에 대한
PtpConfigCR(사용자 정의 리소스)을 생성하고ptpClockThreshold및ptp4lOpts에 필요한 값을 설정합니다. 다음 YAML은PtpConfigCR에 설정해야 하는 필수 값을 보여줍니다.spec: profile: - name: "profile1" interface: "enp5s0f0" ptp4lOpts: "-2 -s --summary_interval -4"1 phc2sysOpts: "-a -r -m -n 24 -N 8 -R 16"2 ptp4lConf: ""3 ptpClockThreshold:4 holdOverTimeout: 5 maxOffsetThreshold: 100 minOffsetThreshold: -100- 1
- PTP 빠른 이벤트를 사용하려면
--summary_interval -4를 추가합니다. - 2
- 필수
phc2sysOpts값.-m은 메시지를stdout에 출력합니다.linuxptp-daemonDaemonSet은 로그를 구문 분석하고 Prometheus 지표를 생성합니다. - 3
- 기본
/etc/ptp4l.conf파일을 대체할 구성이 포함된 문자열을 지정합니다. 기본 구성을 사용하려면 필드를 비워 둡니다. - 4
- 선택 사항입니다.
ptpClockThreshold스탠자가 없으면ptpClockThreshold필드에 기본값이 사용됩니다. 스탠자는 기본ptpClockThreshold값을 표시합니다.ptpClockThreshold값은 PTP 이벤트가 트리거되기 전에 PTP 마스터 클록의 연결이 해제된 후의 시간을 구성합니다.holdOverTimeout은 PTP 마스터 클록의 연결이 끊어지면 PTP 클럭 이벤트 상태가 FreeRUN으로 변경되기 전의 시간(초)입니다.maxOffsetThreshold및minOffsetThreshold설정은CLOCK_REALTIME(phc2sys) 또는 master 오프셋(ptp4l)의 값과 비교하는 오프셋 값을 나노초로 구성합니다.ptp4l또는phc2sys오프셋 값이 이 범위를 벗어나는 경우 PTP 클럭 상태가 FreeRUN으로설정됩니다. 오프셋 값이 이 범위 내에 있으면 PTP 클럭 상태가LOCKED로 설정됩니다.
5.3.4. PTP 이벤트 REST API v2 소비자 애플리케이션 참조
PTP 이벤트 소비자 애플리케이션에는 다음 기능이 필요합니다.
-
클라우드 기본 PTP 이벤트 JSON 페이로드를 수신하기 위해
POST처리기로 실행되는 웹 서비스 -
PTP 이벤트 생산자를 구독하는
createSubscription함수 -
PTP 이벤트 생산자의 현재 상태를 폴링하는
getCurrentState함수
다음 예제 Go 스니펫에서는 다음 요구 사항을 보여줍니다.
Go의 PTP 이벤트 소비자 서버 기능의 예
func server() {
  http.HandleFunc("/event", getEvent)
  http.ListenAndServe(":9043", nil)
}

func getEvent(w http.ResponseWriter, req *http.Request) {
  defer req.Body.Close()
  bodyBytes, err := io.ReadAll(req.Body)
  if err != nil {
    log.Errorf("error reading event %v", err)
  }
  e := string(bodyBytes)
  if e != "" {
    processEvent(bodyBytes)
    log.Infof("received event %s", string(bodyBytes))
  }
  w.WriteHeader(http.StatusNoContent)
}
Go의 PTP 이벤트 createSubscription 함수의 예
import (
"github.com/redhat-cne/sdk-go/pkg/pubsub"
"github.com/redhat-cne/sdk-go/pkg/types"
v1pubsub "github.com/redhat-cne/sdk-go/v1/pubsub"
)

// Subscribe to PTP events using v2 REST API
s1,_:=createsubscription("/cluster/node/<node_name>/sync/sync-status/sync-state")
s2,_:=createsubscription("/cluster/node/<node_name>/sync/ptp-status/lock-state")
s3,_:=createsubscription("/cluster/node/<node_name>/sync/gnss-status/gnss-sync-status")
s4,_:=createsubscription("/cluster/node/<node_name>/sync/sync-status/os-clock-sync-state")
s5,_:=createsubscription("/cluster/node/<node_name>/sync/ptp-status/clock-class")

// Create PTP event subscriptions POST
func createSubscription(resourceAddress string) (sub pubsub.PubSub, err error) {
  var status int
  apiPath := "/api/ocloudNotifications/v2/"
  localAPIAddr := "consumer-events-subscription-service.cloud-events.svc.cluster.local:9043" // vDU service API address
  apiAddr := "ptp-event-publisher-service-<node_name>.openshift-ptp.svc.cluster.local:9043"
  apiVersion := "2.0"

  subURL := &types.URI{URL: url.URL{Scheme: "http",
    Host: apiAddr
    Path: fmt.Sprintf("%s%s", apiPath, "subscriptions")}}
  endpointURL := &types.URI{URL: url.URL{Scheme: "http",
    Host: localAPIAddr,
    Path: "event"}}

  sub = v1pubsub.NewPubSub(endpointURL, resourceAddress, apiVersion)
  var subB []byte

  if subB, err = json.Marshal(&sub); err == nil {
    rc := restclient.New()
    if status, subB = rc.PostWithReturn(subURL, subB); status != http.StatusCreated {
      err = fmt.Errorf("error in subscription creation api at %s, returned status %d", subURL, status)
    } else {
      err = json.Unmarshal(subB, &sub)
    }
  } else {
    err = fmt.Errorf("failed to marshal subscription for %s", resourceAddress)
  }
  return
}- 1
- &
lt;node_name>을 PTP 이벤트를 생성하는 노드의 FQDN으로 바꿉니다. 예를 들면compute-1.example.com입니다.
Go에서 PTP 이벤트 소비자 getCurrentState 함수의 예
//Get PTP event state for the resource
func getCurrentState(resource string) {
  //Create publisher
  url := &types.URI{URL: url.URL{Scheme: "http",
    Host: "ptp-event-publisher-service-<node_name>.openshift-ptp.svc.cluster.local:9043",
    Path: fmt.SPrintf("/api/ocloudNotifications/v2/%s/CurrentState",resource}}
  rc := restclient.New()
  status, event := rc.Get(url)
  if status != http.StatusOK {
    log.Errorf("CurrentState:error %d from url %s, %s", status, url.String(), event)
  } else {
    log.Debugf("Got CurrentState: %s ", event)
  }
}- 1
- &
lt;node_name>을 PTP 이벤트를 생성하는 노드의 FQDN으로 바꿉니다. 예를 들면compute-1.example.com입니다.
5.3.5. PTP 이벤트 REST API v2를 사용하여 이벤트 소비자 배포 및 서비스 CR 참조
PTP 이벤트 REST API v2와 함께 사용할 PTP 이벤트 소비자 소비자 소비자 소비자 애플리케이션을 배포할 때 다음 예제 PTP 이벤트 소비자 CR(사용자 정의 리소스)을 참조로 사용합니다.
참조 클라우드 이벤트 소비자 네임스페이스
apiVersion: v1
kind: Namespace
metadata:
  name: cloud-events
  labels:
    security.openshift.io/scc.podSecurityLabelSync: "false"
    pod-security.kubernetes.io/audit: "privileged"
    pod-security.kubernetes.io/enforce: "privileged"
    pod-security.kubernetes.io/warn: "privileged"
    name: cloud-events
    openshift.io/cluster-monitoring: "true"
  annotations:
    workload.openshift.io/allowed: management
참조 클라우드 이벤트 소비자 배포
apiVersion: apps/v1
kind: Deployment
metadata:
  name: cloud-consumer-deployment
  namespace: cloud-events
  labels:
    app: consumer
spec:
  replicas: 1
  selector:
    matchLabels:
      app: consumer
  template:
    metadata:
      annotations:
        target.workload.openshift.io/management: '{"effect": "PreferredDuringScheduling"}'
      labels:
        app: consumer
    spec:
      nodeSelector:
        node-role.kubernetes.io/worker: ""
      serviceAccountName: consumer-sa
      containers:
        - name: cloud-event-consumer
          image: cloud-event-consumer
          imagePullPolicy: Always
          args:
            - "--local-api-addr=consumer-events-subscription-service.cloud-events.svc.cluster.local:9043"
            - "--api-path=/api/ocloudNotifications/v2/"
            - "--api-addr=127.0.0.1:8089"
            - "--api-version=2.0"
            - "--http-event-publishers=ptp-event-publisher-service-NODE_NAME.openshift-ptp.svc.cluster.local:9043"
          env:
            - name: NODE_NAME
              valueFrom:
                fieldRef:
                  fieldPath: spec.nodeName
            - name: CONSUMER_TYPE
              value: "PTP"
            - name: ENABLE_STATUS_CHECK
              value: "true"
      volumes:
        - name: pubsubstore
          emptyDir: {}
참조 클라우드 이벤트 소비자 서비스 계정
apiVersion: v1
kind: ServiceAccount
metadata:
  name: consumer-sa
  namespace: cloud-events
참조 클라우드 이벤트 소비자 서비스
apiVersion: v1
kind: Service
metadata:
  annotations:
    prometheus.io/scrape: "true"
  name: consumer-events-subscription-service
  namespace: cloud-events
  labels:
    app: consumer-service
spec:
  ports:
    - name: sub-port
      port: 9043
  selector:
    app: consumer
  sessionAffinity: None
  type: ClusterIP
5.3.6. REST API v2를 사용하여 PTP 이벤트 구독
cloud-event-consumer 애플리케이션 컨테이너를 배포하고 cloud-event-consumer 애플리케이션을 PTP Operator가 관리하는 Pod의 cloud-event-proxy 컨테이너에 게시한 PTP 이벤트에 등록합니다.
적절한 서브스크립션 요청 페이로드를 전달하여 http://ptp-event-publisher-service-NODE_NAME.openshift-ptp.svc.cluster.local:9043/api/ocloudNotifications/v2/subscriptions 에 POST 요청을 전송하여 소비자 애플리케이션을 PTP 이벤트에 구독합니다.
9043 은 PTP 이벤트 생산자 Pod에 배포된 cloud-event-proxy 컨테이너의 기본 포트입니다. 필요에 따라 애플리케이션에 대해 다른 포트를 구성할 수 있습니다.
5.3.7. PTP 이벤트 REST API v2 소비자 애플리케이션이 이벤트를 수신하고 있는지 확인
애플리케이션 Pod의 cloud-event-consumer 컨테이너에 PTP(Precision Time Protocol) 이벤트가 수신되는지 확인합니다.
사전 요구 사항
-
OpenShift CLI(
oc)가 설치되어 있습니다. -
cluster-admin권한이 있는 사용자로 로그인했습니다. - PTP Operator를 설치하고 구성했습니다.
- 클라우드 이벤트 애플리케이션 Pod 및 PTP 이벤트 소비자 애플리케이션을 배포했습니다.
프로세스
배포된 이벤트 소비자 애플리케이션의 로그를 확인합니다. 예를 들어 다음 명령을 실행합니다.
$ oc -n cloud-events logs -f deployment/cloud-consumer-deployment출력 예
time = "2024-09-02T13:49:01Z"
level = info msg = "transport host path is set to  ptp-event-publisher-service-compute-1.openshift-ptp.svc.cluster.local:9043"
time = "2024-09-02T13:49:01Z"
level = info msg = "apiVersion=2.0, updated apiAddr=ptp-event-publisher-service-compute-1.openshift-ptp.svc.cluster.local:9043, apiPath=/api/ocloudNotifications/v2/"
time = "2024-09-02T13:49:01Z"
level = info msg = "Starting local API listening to :9043"
time = "2024-09-02T13:49:06Z"
level = info msg = "transport host path is set to  ptp-event-publisher-service-compute-1.openshift-ptp.svc.cluster.local:9043"
time = "2024-09-02T13:49:06Z"
level = info msg = "checking for rest service health"
time = "2024-09-02T13:49:06Z"
level = info msg = "health check http://ptp-event-publisher-service-compute-1.openshift-ptp.svc.cluster.local:9043/api/ocloudNotifications/v2/health"
time = "2024-09-02T13:49:07Z"
level = info msg = "rest service returned healthy status"
time = "2024-09-02T13:49:07Z"
level = info msg = "healthy publisher; subscribing to events"
time = "2024-09-02T13:49:07Z"
level = info msg = "received event {\"specversion\":\"1.0\",\"id\":\"ab423275-f65d-4760-97af-5b0b846605e4\",\"source\":\"/sync/ptp-status/clock-class\",\"type\":\"event.sync.ptp-status.ptp-clock-class-change\",\"time\":\"2024-09-02T13:49:07.226494483Z\",\"data\":{\"version\":\"1.0\",\"values\":[{\"ResourceAddress\":\"/cluster/node/compute-1.example.com/ptp-not-set\",\"data_type\":\"metric\",\"value_type\":\"decimal64.3\",\"value\":\"0\"}]}}"
선택 사항입니다.
linuxptp-daemon배포에서oc및 port-forwarding 포트9043을 사용하여 REST API를 테스트합니다. 예를 들어 다음 명령을 실행합니다.$ oc port-forward -n openshift-ptp ds/linuxptp-daemon 9043:9043출력 예
Forwarding from 127.0.0.1:9043 -> 9043
Forwarding from [::1]:9043 -> 9043
Handling connection for 9043
새 쉘 프롬프트를 열고 REST API v2 끝점을 테스트합니다.
$ curl -X GET http://localhost:9043/api/ocloudNotifications/v2/health출력 예
OK
5.3.8. PTP 빠른 이벤트 메트릭 모니터링
linuxptp-daemon 이 실행 중인 클러스터 노드에서 PTP 빠른 이벤트 메트릭을 모니터링할 수 있습니다. 사전 구성 및 자체 업데이트 Prometheus 모니터링 스택을 사용하여 OpenShift Container Platform 웹 콘솔에서 PTP 빠른 이벤트 메트릭을 모니터링할 수도 있습니다.
사전 요구 사항
-
OpenShift Container Platform CLI
oc를 설치합니다. -
cluster-admin권한이 있는 사용자로 로그인합니다. - PTP 가능 하드웨어를 사용하여 노드에 PTP Operator를 설치하고 구성합니다.
프로세스
다음 명령을 실행하여 노드의 디버그 Pod를 시작합니다.
$ oc debug node/<node_name>linuxptp-daemon컨테이너에서 노출하는 PTP 메트릭을 확인합니다. 예를 들어 다음 명령을 실행합니다.sh-4.4# curl http://localhost:9091/metrics출력 예
# HELP cne_api_events_published Metric to get number of events published by the rest api
# TYPE cne_api_events_published gauge
cne_api_events_published{address="/cluster/node/compute-1.example.com/sync/gnss-status/gnss-sync-status",status="success"} 1
cne_api_events_published{address="/cluster/node/compute-1.example.com/sync/ptp-status/lock-state",status="success"} 94
cne_api_events_published{address="/cluster/node/compute-1.example.com/sync/ptp-status/class-change",status="success"} 18
cne_api_events_published{address="/cluster/node/compute-1.example.com/sync/sync-status/os-clock-sync-state",status="success"} 27
선택 사항입니다.
cloud-event-proxy컨테이너의 로그에서 PTP 이벤트를 찾을 수도 있습니다. 예를 들어 다음 명령을 실행합니다.$ oc logs -f linuxptp-daemon-cvgr6 -n openshift-ptp -c cloud-event-proxy-
OpenShift Container Platform 웹 콘솔에서 PTP 이벤트를 보려면 쿼리할 PTP 지표의 이름을 복사합니다(예:
openshift_ptp_offset_ns). - OpenShift Container Platform 웹 콘솔에서 모니터링 → 메트릭을 클릭합니다.
- PTP 메트릭 이름을 표현식 필드에 붙여넣고 쿼리 실행을 클릭합니다.
5.3.9. PTP 빠른 이벤트 메트릭 참조
다음 표는 linuxptp-daemon 서비스가 실행 중인 클러스터 노드에서 사용할 수 있는 PTP 빠른 이벤트 메트릭을 설명합니다.
| 지표 | 설명 | 예 |
|---|---|---|
|
|
인터페이스의 PTP 클럭 클래스를 반환합니다. PTP 클럭 클래스에 대한 가능한 값은 6 ( |
|
|
|
인터페이스의 현재 PTP 클럭 상태를 반환합니다. PTP 클럭 상태에 사용 가능한 값은 free |
|
|
| 타이밍 패킷을 전송하는 기본 클록과 타이밍 패킷을 수신하는 보조 클럭 사이의 지연 나노초를 반환합니다. |
|
|
|
다른 NIC에 여러 시간 소스가 있는 경우 고가용성 시스템 클록의 현재 상태를 반환합니다. 가능한 값은 0( |
|
|
|
2 PTP 클록 사이의 나노초 단위로 빈도 조정을 반환합니다. 예를 들어, 시스템 클럭과 NIC 사이의 업스트림 클럭과 NIC 사이 또는 PTP 하드웨어 클록 ( |
|
|
|
인터페이스에 대해 구성된 PTP 클럭 역할을 반환합니다. 가능한 값은 0 ( |
|
|
|
2 클럭 또는 인터페이스 사이의 나노초의 최대 오프셋을 반환합니다. 예를 들어 업스트림 GNSS 클록과 NIC( |
|
|
| DPLL 클록 또는 GNSS 클록 소스와 NIC 하드웨어 클록 사이에 나노초 단위로 오프셋을 반환합니다. |
|
|
|
|
|
|
| PTP 프로세스가 실행 중인지 여부를 나타내는 상태 코드를 반환합니다. |
|
|
|
|
|
5.3.9.1. T-GM이 활성화된 경우에만 PTP 빠른 이벤트 메트릭
다음 표에서는 PTP grandmaster 클럭(T-GM)이 활성화된 경우에만 사용할 수 있는 PTP 빠른 이벤트 메트릭을 설명합니다.
| 지표 | 설명 | 예 |
|---|---|---|
|
|
NIC에 대한 디지털 DPLL( phase-locked loop) 빈도의 현재 상태를 반환합니다. 가능한 값은 -1 ( |
|
|
|
NMEA 연결의 현재 상태를 반환합니다. NMEA는 1PPS NIC 연결에 사용되는 프로토콜입니다. 가능한 값은 0 ( |
|
|
|
NIC의 DPLL 단계 상태를 반환합니다. 가능한 값은 -1 ( |
|
|
|
NIC 1PPS 연결의 현재 상태를 반환합니다. 1PPS 연결을 사용하여 연결된 NIC 간에 타이밍을 동기화합니다. 가능한 값은 0 ( |
|
|
|
글로벌 탐색 Satellite 시스템(GNSS) 연결의 현재 상태를 반환합니다. GNSS는 전 세계적으로 Satellite 기반 위치 지정, 탐색 및 타이밍 서비스를 제공합니다. 가능한 값은 0 ( |
|
5.4. PTP 이벤트 REST API v2 참조
다음 REST API v2 끝점을 사용하여 cloud-event-consumer 애플리케이션을 PTP 이벤트 생산자 Pod에 게시한 PTP(Precision Time Protocol) 이벤트에 등록합니다.
api/ocloudNotifications/v2/subscriptions-
POST: 새 서브스크립션을 생성합니다. -
GET: 서브스크립션 목록 검색합니다. -
DELETE: 모든 서브스크립션 삭제
-
api/ocloudNotifications/v2/subscriptions/{subscription_id}-
GET: 지정된 서브스크립션 ID에 대한 세부 정보를 반환합니다. -
DELETE: 지정된 서브스크립션 ID와 연결된 서브스크립션 삭제
-
api/ocloudNotifications/v2/health-
GET:ocloudNotificationsAPI의 상태를 반환합니다.
-
api/ocloudNotifications/v2/publishers-
GET: 클러스터 노드의 PTP 이벤트 게시자 목록을 반환합니다.
-
api/ocloudnotifications/v2/{resource_address}/CurrentState-
GET:{resouce_address}에서 지정한 이벤트 유형의 현재 상태를 반환합니다.
-
5.4.1. PTP 이벤트 REST API v2 끝점
5.4.1.1. api/ocloudNotifications/v2/subscriptions
HTTP 방법
GET api/ocloudNotifications/v2/subscriptions
설명
서브스크립션 목록을 반환합니다. 서브스크립션이 존재하는 경우 200 OK 상태 코드가 서브스크립션 목록과 함께 반환됩니다.
API 응답 예
[
 {
  "ResourceAddress": "/cluster/node/compute-1.example.com/sync/sync-status/os-clock-sync-state",
  "EndpointUri": "http://consumer-events-subscription-service.cloud-events.svc.cluster.local:9043/event",
  "SubscriptionId": "ccedbf08-3f96-4839-a0b6-2eb0401855ed",
  "UriLocation": "http://ptp-event-publisher-service-compute-1.openshift-ptp.svc.cluster.local:9043/api/ocloudNotifications/v2/subscriptions/ccedbf08-3f96-4839-a0b6-2eb0401855ed"
 },
 {
  "ResourceAddress": "/cluster/node/compute-1.example.com/sync/ptp-status/clock-class",
  "EndpointUri": "http://consumer-events-subscription-service.cloud-events.svc.cluster.local:9043/event",
  "SubscriptionId": "a939a656-1b7d-4071-8cf1-f99af6e931f2",
  "UriLocation": "http://ptp-event-publisher-service-compute-1.openshift-ptp.svc.cluster.local:9043/api/ocloudNotifications/v2/subscriptions/a939a656-1b7d-4071-8cf1-f99af6e931f2"
 },
 {
  "ResourceAddress": "/cluster/node/compute-1.example.com/sync/ptp-status/lock-state",
  "EndpointUri": "http://consumer-events-subscription-service.cloud-events.svc.cluster.local:9043/event",
  "SubscriptionId": "ba4564a3-4d9e-46c5-b118-591d3105473c",
  "UriLocation": "http://ptp-event-publisher-service-compute-1.openshift-ptp.svc.cluster.local:9043/api/ocloudNotifications/v2/subscriptions/ba4564a3-4d9e-46c5-b118-591d3105473c"
 },
 {
  "ResourceAddress": "/cluster/node/compute-1.example.com/sync/gnss-status/gnss-sync-status",
  "EndpointUri": "http://consumer-events-subscription-service.cloud-events.svc.cluster.local:9043/event",
  "SubscriptionId": "ea0d772e-f00a-4889-98be-51635559b4fb",
  "UriLocation": "http://ptp-event-publisher-service-compute-1.openshift-ptp.svc.cluster.local:9043/api/ocloudNotifications/v2/subscriptions/ea0d772e-f00a-4889-98be-51635559b4fb"
 },
 {
  "ResourceAddress": "/cluster/node/compute-1.example.com/sync/sync-status/sync-state",
  "EndpointUri": "http://consumer-events-subscription-service.cloud-events.svc.cluster.local:9043/event",
  "SubscriptionId": "762999bf-b4a0-4bad-abe8-66e646b65754",
  "UriLocation": "http://ptp-event-publisher-service-compute-1.openshift-ptp.svc.cluster.local:9043/api/ocloudNotifications/v2/subscriptions/762999bf-b4a0-4bad-abe8-66e646b65754"
 }
]
HTTP 방법
POST api/ocloudNotifications/v2/subscriptions
설명
적절한 페이로드를 전달하여 필요한 이벤트에 대한 새 서브스크립션을 생성합니다.
다음 PTP 이벤트를 구독할 수 있습니다.
-
sync-state이벤트 -
lock-state이벤트 -
GNSS-sync-status 이벤트 -
OS-clock-sync-state이벤트 -
클럭 클래스이벤트
| 매개변수 | 유형 |
|---|---|
| subscription | data |
동기화 상태 서브스크립션 페이로드의 예
{
"EndpointUri": "http://consumer-events-subscription-service.cloud-events.svc.cluster.local:9043/event",
"ResourceAddress": "/cluster/node/{node_name}/sync/sync-status/sync-state"
}
PTP 잠금 이벤트 서브스크립션 페이로드의 예
{
"EndpointUri": "http://consumer-events-subscription-service.cloud-events.svc.cluster.local:9043/event",
"ResourceAddress": "/cluster/node/{node_name}/sync/ptp-status/lock-state"
}
PTP gnss-sync-status 이벤트 서브스크립션 페이로드의 예
{
"EndpointUri": "http://consumer-events-subscription-service.cloud-events.svc.cluster.local:9043/event",
"ResourceAddress": "/cluster/node/{node_name}/sync/gnss-status/gnss-sync-status"
}
PTP os-clock-sync-state 이벤트 서브스크립션 페이로드의 예
{
"EndpointUri": "http://consumer-events-subscription-service.cloud-events.svc.cluster.local:9043/event",
"ResourceAddress": "/cluster/node/{node_name}/sync/sync-status/os-clock-sync-state"
}
PTP 클럭 클래스 이벤트 서브스크립션 페이로드의 예
{
"EndpointUri": "http://consumer-events-subscription-service.cloud-events.svc.cluster.local:9043/event",
"ResourceAddress": "/cluster/node/{node_name}/sync/ptp-status/clock-class"
}
API 응답 예
{
    "ResourceAddress": "/cluster/node/compute-1.example.com/sync/ptp-status/lock-state",
    "EndpointUri": "http://consumer-events-subscription-service.cloud-events.svc.cluster.local:9043/event",
    "SubscriptionId": "620283f3-26cd-4a6d-b80a-bdc4b614a96a",
    "UriLocation": "http://ptp-event-publisher-service-compute-1.openshift-ptp.svc.cluster.local:9043/api/ocloudNotifications/v2/subscriptions/620283f3-26cd-4a6d-b80a-bdc4b614a96a"
}
다음 서브스크립션 상태 이벤트를 사용할 수 있습니다.
| 상태 코드 | 설명 |
|---|---|
|
| 서브스크립션이 생성됨을 나타냅니다. |
|
| 잘못된 형식이 않았거나 유효하지 않기 때문에 서버가 요청을 처리할 수 없음을 나타냅니다. |
|
| 서브스크립션 리소스를 사용할 수 없음을 나타냅니다. |
|
| 서브스크립션이 이미 있음을 나타냅니다. |
HTTP 방법
DELETE api/ocloudNotifications/v2/subscriptions
설명
모든 서브스크립션을 삭제합니다.
API 응답 예
{
"status": "deleted all subscriptions"
}
5.4.1.2. api/ocloudNotifications/v2/subscriptions/{subscription_id}
HTTP 방법
GET api/ocloudNotifications/v2/subscriptions/{subscription_id}
설명
ID subscription_id 가 있는 서브스크립션 세부 정보를 반환합니다.
| 매개변수 | 유형 |
|---|---|
|
| string |
API 응답 예
{
    "ResourceAddress": "/cluster/node/compute-1.example.com/sync/ptp-status/lock-state",
    "EndpointUri": "http://consumer-events-subscription-service.cloud-events.svc.cluster.local:9043/event",
    "SubscriptionId": "620283f3-26cd-4a6d-b80a-bdc4b614a96a",
    "UriLocation": "http://ptp-event-publisher-service-compute-1.openshift-ptp.svc.cluster.local:9043/api/ocloudNotifications/v2/subscriptions/620283f3-26cd-4a6d-b80a-bdc4b614a96a"
}
HTTP 방법
DELETE api/ocloudNotifications/v2/subscriptions/{subscription_id}
설명
ID subscription_id 가 있는 서브스크립션을 삭제합니다.
| 매개변수 | 유형 |
|---|---|
|
| string |
| HTTP 응답 | 설명 |
|---|---|
| 204 콘텐츠 없음 | 성공 |
5.4.1.3. api/ocloudNotifications/v2/health
HTTP 방법
GET api/ocloudNotifications/v2/health/
설명
ocloudNotifications REST API의 상태를 반환합니다.
| HTTP 응답 | 설명 |
|---|---|
| 200 OK | 성공 |
5.4.1.4. api/ocloudNotifications/v2/publishers
HTTP 방법
GET api/ocloudNotifications/v2/publishers
설명
클러스터 노드의 게시자 세부 정보 목록을 반환합니다. 관련 장비 상태가 변경될 때 시스템에서 알림을 생성합니다.
장비 동기화 상태 서브스크립션을 함께 사용하여 시스템의 전체 동기화 상태에 대한 자세한 보기를 제공할 수 있습니다.
API 응답 예
[
  {
    "ResourceAddress": "/cluster/node/compute-1.example.com/sync/sync-status/sync-state",
    "EndpointUri": "http://localhost:9043/api/ocloudNotifications/v2/dummy",
    "SubscriptionId": "4ea72bfa-185c-4703-9694-cdd0434cd570",
    "UriLocation": "http://localhost:9043/api/ocloudNotifications/v2/publishers/4ea72bfa-185c-4703-9694-cdd0434cd570"
  },
  {
    "ResourceAddress": "/cluster/node/compute-1.example.com/sync/sync-status/os-clock-sync-state",
    "EndpointUri": "http://localhost:9043/api/ocloudNotifications/v2/dummy",
    "SubscriptionId": "71fbb38e-a65d-41fc-823b-d76407901087",
    "UriLocation": "http://localhost:9043/api/ocloudNotifications/v2/publishers/71fbb38e-a65d-41fc-823b-d76407901087"
  },
  {
    "ResourceAddress": "/cluster/node/compute-1.example.com/sync/ptp-status/clock-class",
    "EndpointUri": "http://localhost:9043/api/ocloudNotifications/v2/dummy",
    "SubscriptionId": "7bc27cad-03f4-44a9-8060-a029566e7926",
    "UriLocation": "http://localhost:9043/api/ocloudNotifications/v2/publishers/7bc27cad-03f4-44a9-8060-a029566e7926"
  },
  {
    "ResourceAddress": "/cluster/node/compute-1.example.com/sync/ptp-status/lock-state",
    "EndpointUri": "http://localhost:9043/api/ocloudNotifications/v2/dummy",
    "SubscriptionId": "6e7b6736-f359-46b9-991c-fbaed25eb554",
    "UriLocation": "http://localhost:9043/api/ocloudNotifications/v2/publishers/6e7b6736-f359-46b9-991c-fbaed25eb554"
  },
  {
    "ResourceAddress": "/cluster/node/compute-1.example.com/sync/gnss-status/gnss-sync-status",
    "EndpointUri": "http://localhost:9043/api/ocloudNotifications/v2/dummy",
    "SubscriptionId": "31bb0a45-7892-45d4-91dd-13035b13ed18",
    "UriLocation": "http://localhost:9043/api/ocloudNotifications/v2/publishers/31bb0a45-7892-45d4-91dd-13035b13ed18"
  }
]| HTTP 응답 | 설명 |
|---|---|
| 200 OK | 성공 |
5.4.1.5. api/ocloudNotifications/v2/{resource_address}/CurrentState
HTTP 방법
GET api/ocloudNotifications/v2/cluster/node/{node_name}/sync/ptp-status/lock-state/CurrentState
GET api/ocloudNotifications/v2/cluster/node/{node_name}/sync/sync-status/os-clock-sync-state/CurrentState
GET api/ocloudNotifications/v2/cluster/node/{node_name}/sync/ptp-status/clock-class/CurrentState
GET api/ocloudNotifications/v2/cluster/node/{node_name}/sync/sync-status/sync-state/CurrentState
GET api/ocloudNotifications/v2/cluster/node/{node_name}/sync/gnsss-status/gnss-sync-state/CurrentState
설명
클러스터 노드에 대한 os-clock-sync-state,clock-class,lock-state,gnss-sync-status 또는 sync-state 이벤트의 현재 상태를 반환합니다.
-
OS-clock-sync-state알림은 호스트 운영 체제 클럭 동기화 상태를 설명합니다.LOCKED또는 FreeRUN 상태일수 있습니다. -
클럭 클래스알림은 PTP 클럭 클래스의 현재 상태를 설명합니다. -
잠금 상태알림은 PTP 장비 잠금 상태의 현재 상태를 설명합니다.LOCKED,HOLDOVER또는 FreeRUN 상태일수 있습니다. -
sync-state알림은 PTP 클럭lock-state및os-clock-sync-state상태의 현재 상태를 설명합니다. -
GNSS
-sync-status알림은 GNSS 클럭 동기화 상태를 설명합니다.
| 매개변수 | 유형 |
|---|---|
|
| string |
lock-state API 응답의 예
{
  "id": "c1ac3aa5-1195-4786-84f8-da0ea4462921",
  "type": "event.sync.ptp-status.ptp-state-change",
  "source": "/cluster/node/compute-1.example.com/sync/ptp-status/lock-state",
  "dataContentType": "application/json",
  "time": "2023-01-10T02:41:57.094981478Z",
  "data": {
    "version": "1.0",
    "values": [
      {
        "ResourceAddress": "/cluster/node/compute-1.example.com/ens5fx/master",
        "data_type": "notification",
        "value_type": "enumeration",
        "value": "LOCKED"
      },
      {
        "ResourceAddress": "/cluster/node/compute-1.example.com/ens5fx/master",
        "data_type": "metric",
        "value_type": "decimal64.3",
        "value": "29"
      }
    ]
  }
}
os-clock-sync-state API 응답의 예
{
  "specversion": "0.3",
  "id": "4f51fe99-feaa-4e66-9112-66c5c9b9afcb",
  "source": "/cluster/node/compute-1.example.com/sync/sync-status/os-clock-sync-state",
  "type": "event.sync.sync-status.os-clock-sync-state-change",
  "subject": "/cluster/node/compute-1.example.com/sync/sync-status/os-clock-sync-state",
  "datacontenttype": "application/json",
  "time": "2022-11-29T17:44:22.202Z",
  "data": {
    "version": "1.0",
    "values": [
      {
        "ResourceAddress": "/cluster/node/compute-1.example.com/CLOCK_REALTIME",
        "data_type": "notification",
        "value_type": "enumeration",
        "value": "LOCKED"
      },
      {
        "ResourceAddress": "/cluster/node/compute-1.example.com/CLOCK_REALTIME",
        "data_type": "metric",
        "value_type": "decimal64.3",
        "value": "27"
      }
    ]
  }
}
클럭 클래스 API 응답의 예
{
  "id": "064c9e67-5ad4-4afb-98ff-189c6aa9c205",
  "type": "event.sync.ptp-status.ptp-clock-class-change",
  "source": "/cluster/node/compute-1.example.com/sync/ptp-status/clock-class",
  "dataContentType": "application/json",
  "time": "2023-01-10T02:41:56.785673989Z",
  "data": {
    "version": "1.0",
    "values": [
      {
        "ResourceAddress": "/cluster/node/compute-1.example.com/ens5fx/master",
        "data_type": "metric",
        "value_type": "decimal64.3",
        "value": "165"
      }
    ]
  }
}
sync-state API 응답의 예
{
    "specversion": "0.3",
    "id": "8c9d6ecb-ae9f-4106-82c4-0a778a79838d",
    "source": "/sync/sync-status/sync-state",
    "type": "event.sync.sync-status.synchronization-state-change",
    "subject": "/cluster/node/compute-1.example.com/sync/sync-status/sync-state",
    "datacontenttype": "application/json",
    "time": "2024-08-28T14:50:57.327585316Z",
    "data":
    {
        "version": "1.0",
        "values": [
        {
            "ResourceAddress": "/cluster/node/compute-1.example.com/sync/sync-status/sync-state",
            "data_type": "notification",
            "value_type": "enumeration",
            "value": "LOCKED"
        }]
    }
}
gnss-sync-state API 응답의 예
{
  "id": "435e1f2a-6854-4555-8520-767325c087d7",
  "type": "event.sync.gnss-status.gnss-state-change",
  "source": "/cluster/node/compute-1.example.com/sync/gnss-status/gnss-sync-status",
  "dataContentType": "application/json",
  "time": "2023-09-27T19:35:33.42347206Z",
  "data": {
    "version": "1.0",
    "values": [
      {
        "ResourceAddress": "/cluster/node/compute-1.example.com/ens2fx/master",
        "data_type": "notification",
        "value_type": "enumeration",
        "value": "SYNCHRONIZED"
      },
      {
        "ResourceAddress": "/cluster/node/compute-1.example.com/ens2fx/master",
        "data_type": "metric",
        "value_type": "decimal64.3",
        "value": "5"
      }
    ]
  }
}
5.5. REST API v1을 사용하여 PTP 이벤트 소비자 애플리케이션 개발
베어 메탈 클러스터 노드에서 PTP(Precision Time Protocol) 이벤트를 사용하는 소비자 애플리케이션을 개발할 때 별도의 애플리케이션 포드에 소비자 애플리케이션을 배포합니다. 소비자 애플리케이션은 PTP 이벤트 REST API v1을 사용하여 PTP 이벤트를 서브스크립션합니다.
다음 정보는 PTP 이벤트를 사용하는 소비자 애플리케이션을 개발하기 위한 일반적인 지침을 제공합니다. 전체 이벤트 소비자 애플리케이션 예제는 이 정보의 범위를 벗어납니다.
PTP 이벤트 REST API v1 및 이벤트 소비자 애플리케이션 사이드카는 더 이상 사용되지 않는 기능입니다. 더 이상 사용되지 않는 기능은 여전히 OpenShift Container Platform에 포함되어 있으며 계속 지원됩니다. 그러나 이 기능은 향후 릴리스에서 제거될 예정이므로 새로운 배포에는 사용하지 않는 것이 좋습니다.
OpenShift Container Platform에서 더 이상 사용되지 않거나 삭제된 주요 기능의 최신 목록은 OpenShift Container Platform 릴리스 노트에서 더 이상 사용되지 않고 삭제된 기능 섹션을 참조하십시오.
5.5.1. PTP 빠른 이벤트 알림 프레임워크 정보
PTP(Precision Time Protocol) 빠른 이벤트 REST API v2를 사용하여 베어 메탈 클러스터 노드에서 생성하는 PTP 이벤트에 클러스터 애플리케이션을 서브스크립션합니다.
빠른 이벤트 알림 프레임워크는 통신에 REST API를 사용합니다. PTP 이벤트 REST API v1 및 v2는 O-RAN ALLIANCE 사양에서 사용할 수 있는 이벤트 소비자 4.0의 O-RAN O-Cloud 알림 API 사양 을 기반으로 합니다.
PTP 이벤트 REST API v2만 O-RAN v4와 호환됩니다.
5.5.2. PTP 이벤트 REST API v1을 사용하여 PTP 이벤트 검색
애플리케이션은 사이드카 패턴에서 cloud-event-proxy 컨테이너를 실행하여 PTP 이벤트를 구독합니다. cloud-event-proxy 사이드카 컨테이너는 기본 애플리케이션의 리소스를 사용하지 않고 대기 시간 없이 기본 애플리케이션 컨테이너와 동일한 리소스에 액세스할 수 있습니다.
그림 5.7. 소비자 사이드카 및 HTTP 메시지 전송이 포함된 PTP 빠른 이벤트 개요

-
클러스터 호스트에서 이벤트가 생성됩니다.
-
PTP Operator 관리 Pod의
linuxptp-daemon은 KubernetesDaemonSet로 실행되며 다양한linuxptp프로세스(ptp4l,phc2sys, 선택적으로 할 마스터 클록,ts2phc)를 관리합니다.linuxptp-daemon은 이벤트를 UNIX 도메인 소켓에 전달합니다. -
이벤트는 cloud-event-proxy 사이드카에 전달됩니다.
-
PTP 플러그인은 UNIX 도메인 소켓에서 이벤트를 읽고 PTP Operator 관리 Pod의
cloud-event-proxy사이드카에 전달합니다.cloud-event-proxy는 Kubernetes 인프라에서 대기 시간이 짧은 CNF(Cloud-Native Network Functions)로 이벤트를 제공합니다. -
이벤트가 유지됩니다.
-
PTP Operator 관리 Pod의
cloud-event-proxy사이드카는 이벤트를 처리하고 REST API를 사용하여 클라우드 네이티브 이벤트를 게시합니다. -
메시지가 전송됨
-
메시지 전송자는 HTTP를 통해 애플리케이션 Pod의
cloud-event-proxy사이드카로 이벤트를 전송합니다. -
 REST API에서 이벤트 사용 가능
 -
애플리케이션 Pod의
cloud-event-proxy사이드카는 이벤트를 처리하고 REST API를 사용하여 이벤트를 사용할 수 있도록 합니다. -
 소비자 애플리케이션은 서브스크립션을 요청하고 서브스크립션 이벤트를 수신
 -
소비자 애플리케이션은 API 요청을 애플리케이션 Pod의
cloud-event-proxy사이드카로 전송하여 PTP 이벤트 서브스크립션을 생성합니다.cloud-event-proxy사이드카는 서브스크립션에 지정된 리소스에 대한 HTTP 메시징 리스너 프로토콜을 생성합니다.
애플리케이션 Pod의 cloud-event-proxy 사이드카는 PTP Operator 관리 Pod에서 이벤트를 수신하고 클라우드 이벤트 오브젝트를 래핑하여 데이터를 검색하고 이벤트를 소비자 애플리케이션에 게시합니다. 소비자 애플리케이션은 리소스 한정자에 지정된 주소를 수신하고 PTP 이벤트를 수신하고 처리합니다.
5.5.3. PTP 빠른 이벤트 알림 게시자 구성
클러스터에서 네트워크 인터페이스에 PTP 빠른 이벤트 알림을 사용하려면 PTP Operator PtpOperatorConfig CR(사용자 정의 리소스)에서 빠른 이벤트 게시자를 활성화하고 생성한 PtpConfig CR에서 ptpClockThreshold 값을 구성해야 합니다.
사전 요구 사항
-
OpenShift Container Platform CLI(
oc)를 설치했습니다. -
cluster-admin권한이 있는 사용자로 로그인했습니다. - PTP Operator를 설치했습니다.
프로세스
기본 PTP Operator 구성을 수정하여 PTP 빠른 이벤트를 활성화합니다.
다음 YAML을
ptp-operatorconfig.yaml파일에 저장합니다.apiVersion: ptp.openshift.io/v1 kind: PtpOperatorConfig metadata: name: default namespace: openshift-ptp spec: daemonNodeSelector: node-role.kubernetes.io/worker: "" ptpEventConfig: enableEventPublisher: true1 - 1
enableEventPublisher를true로 설정하여 PTP 빠른 이벤트 알림을 활성화합니다.
참고OpenShift Container Platform 4.13 이상에서는 PTP 이벤트에 HTTP 전송을 사용할 때
PtpOperatorConfig리소스에서spec.ptpEventConfig.transportHost필드를 설정할 필요가 없습니다.PtpOperatorConfigCR을 업데이트합니다.$ oc apply -f ptp-operatorconfig.yaml
PTP가 활성화된 인터페이스에 대한
PtpConfigCR(사용자 정의 리소스)을 생성하고ptpClockThreshold및ptp4lOpts에 필요한 값을 설정합니다. 다음 YAML은PtpConfigCR에 설정해야 하는 필수 값을 보여줍니다.spec: profile: - name: "profile1" interface: "enp5s0f0" ptp4lOpts: "-2 -s --summary_interval -4"1 phc2sysOpts: "-a -r -m -n 24 -N 8 -R 16"2 ptp4lConf: ""3 ptpClockThreshold:4 holdOverTimeout: 5 maxOffsetThreshold: 100 minOffsetThreshold: -100- 1
- PTP 빠른 이벤트를 사용하려면
--summary_interval -4를 추가합니다. - 2
- 필수
phc2sysOpts값.-m은 메시지를stdout에 출력합니다.linuxptp-daemonDaemonSet은 로그를 구문 분석하고 Prometheus 지표를 생성합니다. - 3
- 기본
/etc/ptp4l.conf파일을 대체할 구성이 포함된 문자열을 지정합니다. 기본 구성을 사용하려면 필드를 비워 둡니다. - 4
- 선택 사항입니다.
ptpClockThreshold스탠자가 없으면ptpClockThreshold필드에 기본값이 사용됩니다. 스탠자는 기본ptpClockThreshold값을 표시합니다.ptpClockThreshold값은 PTP 이벤트가 트리거되기 전에 PTP 마스터 클록의 연결이 해제된 후의 시간을 구성합니다.holdOverTimeout은 PTP 마스터 클록의 연결이 끊어지면 PTP 클럭 이벤트 상태가 FreeRUN으로 변경되기 전의 시간(초)입니다.maxOffsetThreshold및minOffsetThreshold설정은CLOCK_REALTIME(phc2sys) 또는 master 오프셋(ptp4l)의 값과 비교하는 오프셋 값을 나노초로 구성합니다.ptp4l또는phc2sys오프셋 값이 이 범위를 벗어나는 경우 PTP 클럭 상태가 FreeRUN으로설정됩니다. 오프셋 값이 이 범위 내에 있으면 PTP 클럭 상태가LOCKED로 설정됩니다.
5.5.4. PTP 이벤트 소비자 애플리케이션 참조
PTP 이벤트 소비자 애플리케이션에는 다음 기능이 필요합니다.
-
클라우드 기본 PTP 이벤트 JSON 페이로드를 수신하기 위해
POST처리기로 실행되는 웹 서비스 -
PTP 이벤트 생산자를 구독하는
createSubscription함수 -
PTP 이벤트 생산자의 현재 상태를 폴링하는
getCurrentState함수
다음 예제 Go 스니펫에서는 다음 요구 사항을 보여줍니다.
Go의 PTP 이벤트 소비자 서버 기능의 예
func server() {
  http.HandleFunc("/event", getEvent)
  http.ListenAndServe("localhost:8989", nil)
}

func getEvent(w http.ResponseWriter, req *http.Request) {
  defer req.Body.Close()
  bodyBytes, err := io.ReadAll(req.Body)
  if err != nil {
    log.Errorf("error reading event %v", err)
  }
  e := string(bodyBytes)
  if e != "" {
    processEvent(bodyBytes)
    log.Infof("received event %s", string(bodyBytes))
  } else {
    w.WriteHeader(http.StatusNoContent)
  }
}
Go의 PTP 이벤트 createSubscription 함수의 예
import (
"github.com/redhat-cne/sdk-go/pkg/pubsub"
"github.com/redhat-cne/sdk-go/pkg/types"
v1pubsub "github.com/redhat-cne/sdk-go/v1/pubsub"
)

// Subscribe to PTP events using REST API
s1,_:=createsubscription("/cluster/node/<node_name>/sync/sync-status/os-clock-sync-state")
s2,_:=createsubscription("/cluster/node/<node_name>/sync/ptp-status/class-change")
s3,_:=createsubscription("/cluster/node/<node_name>/sync/ptp-status/lock-state")

// Create PTP event subscriptions POST
func createSubscription(resourceAddress string) (sub pubsub.PubSub, err error) {
  var status int
      apiPath:= "/api/ocloudNotifications/v1/"
      localAPIAddr:=localhost:8989 // vDU service API address
      apiAddr:= "localhost:8089" // event framework API address

  subURL := &types.URI{URL: url.URL{Scheme: "http",
    Host: apiAddr
    Path: fmt.Sprintf("%s%s", apiPath, "subscriptions")}}
  endpointURL := &types.URI{URL: url.URL{Scheme: "http",
    Host: localAPIAddr,
    Path: "event"}}

  sub = v1pubsub.NewPubSub(endpointURL, resourceAddress)
  var subB []byte

  if subB, err = json.Marshal(&sub); err == nil {
    rc := restclient.New()
    if status, subB = rc.PostWithReturn(subURL, subB); status != http.StatusCreated {
      err = fmt.Errorf("error in subscription creation api at %s, returned status %d", subURL, status)
    } else {
      err = json.Unmarshal(subB, &sub)
    }
  } else {
    err = fmt.Errorf("failed to marshal subscription for %s", resourceAddress)
  }
  return
}- 1
- &
lt;node_name>을 PTP 이벤트를 생성하는 노드의 FQDN으로 바꿉니다. 예를 들면compute-1.example.com입니다.
Go에서 PTP 이벤트 소비자 getCurrentState 함수의 예
//Get PTP event state for the resource
func getCurrentState(resource string) {
  //Create publisher
  url := &types.URI{URL: url.URL{Scheme: "http",
    Host: localhost:8989,
    Path: fmt.SPrintf("/api/ocloudNotifications/v1/%s/CurrentState",resource}}
  rc := restclient.New()
  status, event := rc.Get(url)
  if status != http.StatusOK {
    log.Errorf("CurrentState:error %d from url %s, %s", status, url.String(), event)
  } else {
    log.Debugf("Got CurrentState: %s ", event)
  }
}
5.5.5. cloud-event-proxy 배포 및 서비스 CR 참조
PTP 이벤트 소비자 애플리케이션을 배포할 때 다음 예제 cloud-event-proxy 배포 및 구독자 서비스 CR을 참조로 사용합니다.
HTTP 전송을 사용하여 cloud-event-proxy 배포 참조
apiVersion: apps/v1
kind: Deployment
metadata:
  name: event-consumer-deployment
  namespace: <namespace>
  labels:
    app: consumer
spec:
  replicas: 1
  selector:
    matchLabels:
      app: consumer
  template:
    metadata:
      labels:
        app: consumer
    spec:
      serviceAccountName: sidecar-consumer-sa
      containers:
        - name: event-subscriber
          image: event-subscriber-app
        - name: cloud-event-proxy-as-sidecar
          image: openshift4/ose-cloud-event-proxy
          args:
            - "--metrics-addr=127.0.0.1:9091"
            - "--store-path=/store"
            - "--transport-host=consumer-events-subscription-service.cloud-events.svc.cluster.local:9043"
            - "--http-event-publishers=ptp-event-publisher-service-NODE_NAME.openshift-ptp.svc.cluster.local:9043"
            - "--api-port=8089"
          env:
            - name: NODE_NAME
              valueFrom:
                fieldRef:
                  fieldPath: spec.nodeName
          volumeMounts:
            - name: pubsubstore
              mountPath: /store
          ports:
            - name: metrics-port
              containerPort: 9091
            - name: sub-port
              containerPort: 9043
          volumes:
            - name: pubsubstore
              emptyDir: {}
cloud-event-proxy 구독자 서비스 참조
apiVersion: v1
kind: Service
metadata:
  annotations:
    prometheus.io/scrape: "true"
    service.alpha.openshift.io/serving-cert-secret-name: sidecar-consumer-secret
  name: consumer-events-subscription-service
  namespace: cloud-events
  labels:
    app: consumer-service
spec:
  ports:
    - name: sub-port
      port: 9043
  selector:
    app: consumer
  clusterIP: None
  sessionAffinity: None
  type: ClusterIP
5.5.6. REST API v1을 사용하여 PTP 이벤트 구독
별도의 애플리케이션 Pod에 cloud-event-consumer 애플리케이션 컨테이너 및 cloud-event-proxy 사이드카 컨테이너를 배포합니다.
클라우드-event-consumer 애플리케이션을 애플리케이션 Pod의 http://localhost:8089/api/ocloudNotifications/v1/ 에서 cloud-event-proxy 컨테이너에 게시한 PTP 이벤트에 서브스크립션합니다.
9089 는 애플리케이션 Pod에 배포된 cloud-event-consumer 컨테이너의 기본 포트입니다. 필요에 따라 애플리케이션에 대해 다른 포트를 구성할 수 있습니다.
5.5.7. PTP 이벤트 REST API v1 소비자 애플리케이션이 이벤트를 수신하고 있는지 확인
애플리케이션 Pod의 cloud-event-proxy 컨테이너에서 PTP 이벤트를 수신하고 있는지 확인합니다.
사전 요구 사항
-
OpenShift CLI(
oc)가 설치되어 있습니다. -
cluster-admin권한이 있는 사용자로 로그인했습니다. - PTP Operator를 설치하고 구성했습니다.
프로세스
활성
linuxptp-daemonPod 목록을 가져옵니다. 다음 명령을 실행합니다.$ oc get pods -n openshift-ptp출력 예
NAME                    READY   STATUS    RESTARTS   AGE
linuxptp-daemon-2t78p   3/3     Running   0          8h
linuxptp-daemon-k8n88   3/3     Running   0          8h
다음 명령을 실행하여 필요한 consumer-side
cloud-event-proxy컨테이너의 메트릭에 액세스합니다.$ oc exec -it <linuxptp-daemon> -n openshift-ptp -c cloud-event-proxy -- curl 127.0.0.1:9091/metrics다음과 같습니다.
- <linuxptp-daemon>
쿼리할 Pod를 지정합니다(예:
linuxptp-daemon-2t78p).출력 예
# HELP cne_transport_connections_resets Metric to get number of connection resets
# TYPE cne_transport_connections_resets gauge
cne_transport_connection_reset 1
# HELP cne_transport_receiver Metric to get number of receiver created
# TYPE cne_transport_receiver gauge
cne_transport_receiver{address="/cluster/node/compute-1.example.com/ptp",status="active"} 2
cne_transport_receiver{address="/cluster/node/compute-1.example.com/redfish/event",status="active"} 2
# HELP cne_transport_sender Metric to get number of sender created
# TYPE cne_transport_sender gauge
cne_transport_sender{address="/cluster/node/compute-1.example.com/ptp",status="active"} 1
cne_transport_sender{address="/cluster/node/compute-1.example.com/redfish/event",status="active"} 1
# HELP cne_events_ack Metric to get number of events produced
# TYPE cne_events_ack gauge
cne_events_ack{status="success",type="/cluster/node/compute-1.example.com/ptp"} 18
cne_events_ack{status="success",type="/cluster/node/compute-1.example.com/redfish/event"} 18
# HELP cne_events_transport_published Metric to get number of events published by the transport
# TYPE cne_events_transport_published gauge
cne_events_transport_published{address="/cluster/node/compute-1.example.com/ptp",status="failed"} 1
cne_events_transport_published{address="/cluster/node/compute-1.example.com/ptp",status="success"} 18
cne_events_transport_published{address="/cluster/node/compute-1.example.com/redfish/event",status="failed"} 1
cne_events_transport_published{address="/cluster/node/compute-1.example.com/redfish/event",status="success"} 18
# HELP cne_events_transport_received Metric to get number of events received  by the transport
# TYPE cne_events_transport_received gauge
cne_events_transport_received{address="/cluster/node/compute-1.example.com/ptp",status="success"} 18
cne_events_transport_received{address="/cluster/node/compute-1.example.com/redfish/event",status="success"} 18
# HELP cne_events_api_published Metric to get number of events published by the rest api
# TYPE cne_events_api_published gauge
cne_events_api_published{address="/cluster/node/compute-1.example.com/ptp",status="success"} 19
cne_events_api_published{address="/cluster/node/compute-1.example.com/redfish/event",status="success"} 19
# HELP cne_events_received Metric to get number of events received
# TYPE cne_events_received gauge
cne_events_received{status="success",type="/cluster/node/compute-1.example.com/ptp"} 18
cne_events_received{status="success",type="/cluster/node/compute-1.example.com/redfish/event"} 18
# HELP promhttp_metric_handler_requests_in_flight Current number of scrapes being served.
# TYPE promhttp_metric_handler_requests_in_flight gauge
promhttp_metric_handler_requests_in_flight 1
# HELP promhttp_metric_handler_requests_total Total number of scrapes by HTTP status code.
# TYPE promhttp_metric_handler_requests_total counter
promhttp_metric_handler_requests_total{code="200"} 4
promhttp_metric_handler_requests_total{code="500"} 0
promhttp_metric_handler_requests_total{code="503"} 0
5.5.8. PTP 빠른 이벤트 메트릭 모니터링
linuxptp-daemon 이 실행 중인 클러스터 노드에서 PTP 빠른 이벤트 메트릭을 모니터링할 수 있습니다. 사전 구성 및 자체 업데이트 Prometheus 모니터링 스택을 사용하여 OpenShift Container Platform 웹 콘솔에서 PTP 빠른 이벤트 메트릭을 모니터링할 수도 있습니다.
사전 요구 사항
-
OpenShift Container Platform CLI
oc를 설치합니다. -
cluster-admin권한이 있는 사용자로 로그인합니다. - PTP 가능 하드웨어를 사용하여 노드에 PTP Operator를 설치하고 구성합니다.
프로세스
다음 명령을 실행하여 노드의 디버그 Pod를 시작합니다.
$ oc debug node/<node_name>linuxptp-daemon컨테이너에서 노출하는 PTP 메트릭을 확인합니다. 예를 들어 다음 명령을 실행합니다.sh-4.4# curl http://localhost:9091/metrics출력 예
# HELP cne_api_events_published Metric to get number of events published by the rest api
# TYPE cne_api_events_published gauge
cne_api_events_published{address="/cluster/node/compute-1.example.com/sync/gnss-status/gnss-sync-status",status="success"} 1
cne_api_events_published{address="/cluster/node/compute-1.example.com/sync/ptp-status/lock-state",status="success"} 94
cne_api_events_published{address="/cluster/node/compute-1.example.com/sync/ptp-status/class-change",status="success"} 18
cne_api_events_published{address="/cluster/node/compute-1.example.com/sync/sync-status/os-clock-sync-state",status="success"} 27
선택 사항입니다.
cloud-event-proxy컨테이너의 로그에서 PTP 이벤트를 찾을 수도 있습니다. 예를 들어 다음 명령을 실행합니다.$ oc logs -f linuxptp-daemon-cvgr6 -n openshift-ptp -c cloud-event-proxy-
OpenShift Container Platform 웹 콘솔에서 PTP 이벤트를 보려면 쿼리할 PTP 지표의 이름을 복사합니다(예:
openshift_ptp_offset_ns). - OpenShift Container Platform 웹 콘솔에서 모니터링 → 메트릭을 클릭합니다.
- PTP 메트릭 이름을 표현식 필드에 붙여넣고 쿼리 실행을 클릭합니다.
5.5.9. PTP 빠른 이벤트 메트릭 참조
다음 표는 linuxptp-daemon 서비스가 실행 중인 클러스터 노드에서 사용할 수 있는 PTP 빠른 이벤트 메트릭을 설명합니다.
| 지표 | 설명 | 예 |
|---|---|---|
|
|
인터페이스의 PTP 클럭 클래스를 반환합니다. PTP 클럭 클래스에 대한 가능한 값은 6 ( |
|
|
|
인터페이스의 현재 PTP 클럭 상태를 반환합니다. PTP 클럭 상태에 사용 가능한 값은 free |
|
|
| 타이밍 패킷을 전송하는 기본 클록과 타이밍 패킷을 수신하는 보조 클럭 사이의 지연 나노초를 반환합니다. |
|
|
|
다른 NIC에 여러 시간 소스가 있는 경우 고가용성 시스템 클록의 현재 상태를 반환합니다. 가능한 값은 0( |
|
|
|
2 PTP 클록 사이의 나노초 단위로 빈도 조정을 반환합니다. 예를 들어, 시스템 클럭과 NIC 사이의 업스트림 클럭과 NIC 사이 또는 PTP 하드웨어 클록 ( |
|
|
|
인터페이스에 대해 구성된 PTP 클럭 역할을 반환합니다. 가능한 값은 0 ( |
|
|
|
2 클럭 또는 인터페이스 사이의 나노초의 최대 오프셋을 반환합니다. 예를 들어 업스트림 GNSS 클록과 NIC( |
|
|
| DPLL 클록 또는 GNSS 클록 소스와 NIC 하드웨어 클록 사이에 나노초 단위로 오프셋을 반환합니다. |
|
|
|
|
|
|
| PTP 프로세스가 실행 중인지 여부를 나타내는 상태 코드를 반환합니다. |
|
|
|
|
|
5.5.9.1. T-GM이 활성화된 경우에만 PTP 빠른 이벤트 메트릭
다음 표에서는 PTP grandmaster 클럭(T-GM)이 활성화된 경우에만 사용할 수 있는 PTP 빠른 이벤트 메트릭을 설명합니다.
| 지표 | 설명 | 예 |
|---|---|---|
|
|
NIC에 대한 디지털 DPLL( phase-locked loop) 빈도의 현재 상태를 반환합니다. 가능한 값은 -1 ( |
|
|
|
NMEA 연결의 현재 상태를 반환합니다. NMEA는 1PPS NIC 연결에 사용되는 프로토콜입니다. 가능한 값은 0 ( |
|
|
|
NIC의 DPLL 단계 상태를 반환합니다. 가능한 값은 -1 ( |
|
|
|
NIC 1PPS 연결의 현재 상태를 반환합니다. 1PPS 연결을 사용하여 연결된 NIC 간에 타이밍을 동기화합니다. 가능한 값은 0 ( |
|
|
|
글로벌 탐색 Satellite 시스템(GNSS) 연결의 현재 상태를 반환합니다. GNSS는 전 세계적으로 Satellite 기반 위치 지정, 탐색 및 타이밍 서비스를 제공합니다. 가능한 값은 0 ( |
|
5.6. PTP 이벤트 REST API v1 참조
다음 PTP(Precision Time Protocol) 빠른 이벤트 REST API v1 끝점을 사용하여 애플리케이션 Pod의 http://localhost:8089/api/ocloudNotifications/v1/ 에서 cloud-event-proxy 컨테이너에서 게시한 PTP 이벤트에 cloud-event-consumer 애플리케이션을 서브스크립션합니다.
PTP 이벤트 REST API v1 및 이벤트 소비자 애플리케이션 사이드카는 더 이상 사용되지 않는 기능입니다. 더 이상 사용되지 않는 기능은 여전히 OpenShift Container Platform에 포함되어 있으며 계속 지원됩니다. 그러나 이 기능은 향후 릴리스에서 제거될 예정이므로 새로운 배포에는 사용하지 않는 것이 좋습니다.
OpenShift Container Platform에서 더 이상 사용되지 않거나 삭제된 주요 기능의 최신 목록은 OpenShift Container Platform 릴리스 노트에서 더 이상 사용되지 않고 삭제된 기능 섹션을 참조하십시오.
다음 API 끝점을 사용할 수 있습니다.
api/ocloudNotifications/v1/subscriptions-
POST: 새 서브스크립션을 생성합니다. -
GET: 서브스크립션 목록 검색합니다. -
DELETE: 모든 서브스크립션 삭제
-
api/ocloudNotifications/v1/subscriptions/{subscription_id}-
GET: 지정된 서브스크립션 ID에 대한 세부 정보를 반환합니다. -
DELETE: 지정된 서브스크립션 ID와 연결된 서브스크립션 삭제
-
api/ocloudNotifications/v1/health-
GET:ocloudNotificationsAPI의 상태를 반환합니다.
-
api/ocloudNotifications/v1/publishers-
GET: 클러스터 노드의 PTP 이벤트 게시자 목록을 반환합니다.
-
api/ocloudnotifications/v1/{resource_address}/CurrentState-
GET: sync-state ,os-clock-또는sync-state,clock-class,lock-stategnss-sync-status이벤트 중 하나의 현재 상태를 반환합니다.
-
5.6.1. PTP 이벤트 REST API v1 끝점
5.6.1.1. api/ocloudNotifications/v1/subscriptions
HTTP 방법
GET api/ocloudNotifications/v1/subscriptions
설명
서브스크립션 목록을 반환합니다. 서브스크립션이 존재하는 경우 200 OK 상태 코드가 서브스크립션 목록과 함께 반환됩니다.
API 응답 예
[
 {
  "id": "75b1ad8f-c807-4c23-acf5-56f4b7ee3826",
  "endpointUri": "http://localhost:9089/event",
  "uriLocation": "http://localhost:8089/api/ocloudNotifications/v1/subscriptions/75b1ad8f-c807-4c23-acf5-56f4b7ee3826",
  "resource": "/cluster/node/compute-1.example.com/ptp"
 }
]
HTTP 방법
POST api/ocloudNotifications/v1/subscriptions
설명
적절한 페이로드를 전달하여 필요한 이벤트에 대한 새 서브스크립션을 생성합니다. 서브스크립션이 성공적으로 생성되었거나 이미 존재하는 경우 201 Created 상태 코드가 반환됩니다. 다음 PTP 이벤트를 구독할 수 있습니다.
-
lock-state이벤트 -
OS-clock-sync-state이벤트 -
클럭 클래스이벤트 -
GNSS-sync-status이벤트 -
sync-state이벤트
| 매개변수 | 유형 |
|---|---|
| subscription | data |
PTP 이벤트 서브스크립션 페이로드의 예
{
  "endpointUri": "http://localhost:8989/event",
  "resource": "/cluster/node/compute-1.example.com/ptp"
}
PTP 잠금 이벤트 서브스크립션 페이로드의 예
{
"endpointUri": "http://localhost:8989/event",
"resource": "/cluster/node/{node_name}/sync/ptp-status/lock-state"
}
PTP os-clock-sync-state 이벤트 서브스크립션 페이로드의 예
{
"endpointUri": "http://localhost:8989/event",
"resource": "/cluster/node/{node_name}/sync/sync-status/os-clock-sync-state"
}
PTP 클럭 클래스 이벤트 서브스크립션 페이로드의 예
{
"endpointUri": "http://localhost:8989/event",
"resource": "/cluster/node/{node_name}/sync/ptp-status/clock-class"
}
PTP gnss-sync-status 이벤트 서브스크립션 페이로드의 예
{
"endpointUri": "http://localhost:8989/event",
"resource": "/cluster/node/{node_name}/sync/gnss-status/gnss-sync-status"
}
동기화 상태 서브스크립션 페이로드의 예
{
"endpointUri": "http://localhost:8989/event",
"resource": "/cluster/node/{node_name}/sync/sync-status/sync-state"
}
HTTP 방법
DELETE api/ocloudNotifications/v1/subscriptions
설명
모든 서브스크립션을 삭제합니다.
API 응답 예
{
"status": "deleted all subscriptions"
}
5.6.1.2. api/ocloudNotifications/v1/subscriptions/{subscription_id}
HTTP 방법
GET api/ocloudNotifications/v1/subscriptions/{subscription_id}
설명
ID subscription_id 가 있는 서브스크립션 세부 정보를 반환합니다.
| 매개변수 | 유형 |
|---|---|
|
| string |
API 응답 예
{
  "id":"48210fb3-45be-4ce0-aa9b-41a0e58730ab",
  "endpointUri": "http://localhost:9089/event",
  "uriLocation":"http://localhost:8089/api/ocloudNotifications/v1/subscriptions/48210fb3-45be-4ce0-aa9b-41a0e58730ab",
  "resource":"/cluster/node/compute-1.example.com/ptp"
}
HTTP 방법
DELETE api/ocloudNotifications/v1/subscriptions/{subscription_id}
설명
ID subscription_id 가 있는 서브스크립션을 삭제합니다.
| 매개변수 | 유형 |
|---|---|
|
| string |
API 응답 예
{
"status": "OK"
}
5.6.1.3. api/ocloudNotifications/v1/health
HTTP 방법
GET api/ocloudNotifications/v1/health/
설명
ocloudNotifications REST API의 상태를 반환합니다.
API 응답 예
OK5.6.1.4. api/ocloudNotifications/v1/publishers
api/ocloudNotifications/v1/publishers 끝점은 PTP Operator 관리 Pod의 cloud-event-proxy 컨테이너에서만 사용할 수 있습니다. 애플리케이션 Pod의 소비자 애플리케이션에는 사용할 수 없습니다.
HTTP 방법
GET api/ocloudNotifications/v1/publishers
설명
클러스터 노드의 게시자 세부 정보 목록을 반환합니다. 관련 장비 상태가 변경될 때 시스템에서 알림을 생성합니다.
장비 동기화 상태 서브스크립션을 함께 사용하여 시스템의 전체 동기화 상태에 대한 자세한 보기를 제공할 수 있습니다.
API 응답 예
[
  {
    "id": "0fa415ae-a3cf-4299-876a-589438bacf75",
    "endpointUri": "http://localhost:9085/api/ocloudNotifications/v1/dummy",
    "uriLocation": "http://localhost:9085/api/ocloudNotifications/v1/publishers/0fa415ae-a3cf-4299-876a-589438bacf75",
    "resource": "/cluster/node/compute-1.example.com/sync/sync-status/os-clock-sync-state"
  },
  {
    "id": "28cd82df-8436-4f50-bbd9-7a9742828a71",
    "endpointUri": "http://localhost:9085/api/ocloudNotifications/v1/dummy",
    "uriLocation": "http://localhost:9085/api/ocloudNotifications/v1/publishers/28cd82df-8436-4f50-bbd9-7a9742828a71",
    "resource": "/cluster/node/compute-1.example.com/sync/ptp-status/clock-class"
  },
  {
    "id": "44aa480d-7347-48b0-a5b0-e0af01fa9677",
    "endpointUri": "http://localhost:9085/api/ocloudNotifications/v1/dummy",
    "uriLocation": "http://localhost:9085/api/ocloudNotifications/v1/publishers/44aa480d-7347-48b0-a5b0-e0af01fa9677",
    "resource": "/cluster/node/compute-1.example.com/sync/ptp-status/lock-state"
  },
  {
    "id": "778da345d-4567-67b0-a43f0-rty885a456",
    "endpointUri": "http://localhost:9085/api/ocloudNotifications/v1/dummy",
    "uriLocation": "http://localhost:9085/api/ocloudNotifications/v1/publishers/778da345d-4567-67b0-a43f0-rty885a456",
    "resource": "/cluster/node/compute-1.example.com/sync/gnss-status/gnss-sync-status"
  }
]
5.6.1.5. api/ocloudNotifications/v1/{resource_address}/CurrentState
HTTP 방법
GET api/ocloudNotifications/v1/cluster/node/{node_name}/sync/ptp-status/lock-state/CurrentState
GET api/ocloudNotifications/v1/cluster/node/{node_name}/sync/sync-status/os-clock-sync-state/CurrentState
GET api/ocloudNotifications/v1/cluster/node/{node_name}/sync/ptp-status/clock-class/CurrentState
GET api/ocloudNotifications/v1/cluster/node/{node_name}/sync/sync-status/sync-state/CurrentState
GET api/ocloudNotifications/v1/cluster/node/{node_name}/sync/gnsss-status/gnss-sync-state/CurrentState
설명
클러스터 노드에 대한 os-clock-sync-state,clock-class,lock-state,gnss-sync-status 또는 sync-state 이벤트의 현재 상태를 반환합니다.
-
OS-clock-sync-state알림은 호스트 운영 체제 클럭 동기화 상태를 설명합니다.LOCKED또는 FreeRUN 상태일수 있습니다. -
클럭 클래스알림은 PTP 클럭 클래스의 현재 상태를 설명합니다. -
잠금 상태알림은 PTP 장비 잠금 상태의 현재 상태를 설명합니다.LOCKED,HOLDOVER또는 FreeRUN 상태일수 있습니다. -
sync-state알림은ptp-status/lock-state및sync-status/os-clock-sync-state끝점의 현재 상태를 설명합니다. -
GNSS
-sync-status알림은 GNSS 클럭 동기화 상태를 설명합니다.
| 매개변수 | 유형 |
|---|---|
|
| string |
lock-state API 응답의 예
{
  "id": "c1ac3aa5-1195-4786-84f8-da0ea4462921",
  "type": "event.sync.ptp-status.ptp-state-change",
  "source": "/cluster/node/compute-1.example.com/sync/ptp-status/lock-state",
  "dataContentType": "application/json",
  "time": "2023-01-10T02:41:57.094981478Z",
  "data": {
    "version": "1.0",
    "values": [
      {
        "ResourceAddress": "/cluster/node/compute-1.example.com/ens5fx/master",
        "data_type": "notification",
        "value_type": "enumeration",
        "value": "LOCKED"
      },
      {
        "ResourceAddress": "/cluster/node/compute-1.example.com/ens5fx/master",
        "data_type": "metric",
        "value_type": "decimal64.3",
        "value": "29"
      }
    ]
  }
}
os-clock-sync-state API 응답의 예
{
  "specversion": "0.3",
  "id": "4f51fe99-feaa-4e66-9112-66c5c9b9afcb",
  "source": "/cluster/node/compute-1.example.com/sync/sync-status/os-clock-sync-state",
  "type": "event.sync.sync-status.os-clock-sync-state-change",
  "subject": "/cluster/node/compute-1.example.com/sync/sync-status/os-clock-sync-state",
  "datacontenttype": "application/json",
  "time": "2022-11-29T17:44:22.202Z",
  "data": {
    "version": "1.0",
    "values": [
      {
        "ResourceAddress": "/cluster/node/compute-1.example.com/CLOCK_REALTIME",
        "data_type": "notification",
        "value_type": "enumeration",
        "value": "LOCKED"
      },
      {
        "ResourceAddress": "/cluster/node/compute-1.example.com/CLOCK_REALTIME",
        "data_type": "metric",
        "value_type": "decimal64.3",
        "value": "27"
      }
    ]
  }
}
클럭 클래스 API 응답의 예
{
  "id": "064c9e67-5ad4-4afb-98ff-189c6aa9c205",
  "type": "event.sync.ptp-status.ptp-clock-class-change",
  "source": "/cluster/node/compute-1.example.com/sync/ptp-status/clock-class",
  "dataContentType": "application/json",
  "time": "2023-01-10T02:41:56.785673989Z",
  "data": {
    "version": "1.0",
    "values": [
      {
        "ResourceAddress": "/cluster/node/compute-1.example.com/ens5fx/master",
        "data_type": "metric",
        "value_type": "decimal64.3",
        "value": "165"
      }
    ]
  }
}
sync-state API 응답의 예
{
    "specversion": "0.3",
    "id": "8c9d6ecb-ae9f-4106-82c4-0a778a79838d",
    "source": "/sync/sync-status/sync-state",
    "type": "event.sync.sync-status.synchronization-state-change",
    "subject": "/cluster/node/compute-1.example.com/sync/sync-status/sync-state",
    "datacontenttype": "application/json",
    "time": "2024-08-28T14:50:57.327585316Z",
    "data":
    {
        "version": "1.0",
        "values": [
        {
            "ResourceAddress": "/cluster/node/compute-1.example.com/sync/sync-status/sync-state",
            "data_type": "notification",
            "value_type": "enumeration",
            "value": "LOCKED"
        }]
    }
}
gnss-sync-status API 응답의 예
{
  "id": "435e1f2a-6854-4555-8520-767325c087d7",
  "type": "event.sync.gnss-status.gnss-state-change",
  "source": "/cluster/node/compute-1.example.com/sync/gnss-status/gnss-sync-status",
  "dataContentType": "application/json",
  "time": "2023-09-27T19:35:33.42347206Z",
  "data": {
    "version": "1.0",
    "values": [
      {
        "ResourceAddress": "/cluster/node/compute-1.example.com/ens2fx/master",
        "data_type": "notification",
        "value_type": "enumeration",
        "value": "LOCKED"
      },
      {
        "ResourceAddress": "/cluster/node/compute-1.example.com/ens2fx/master",
        "data_type": "metric",
        "value_type": "decimal64.3",
        "value": "5"
      }
    ]
  }
}
Legal Notice
Copyright © Red Hat
OpenShift documentation is licensed under the Apache License 2.0 (https://www.apache.org/licenses/LICENSE-2.0).
Modified versions must remove all Red Hat trademarks.
Portions adapted from https://github.com/kubernetes-incubator/service-catalog/ with modifications by Red Hat.
Red Hat, Red Hat Enterprise Linux, the Red Hat logo, the Shadowman logo, JBoss, OpenShift, Fedora, the Infinity logo, and RHCE are trademarks of Red Hat, Inc., registered in the United States and other countries.
Linux® is the registered trademark of Linus Torvalds in the United States and other countries.
Java® is a registered trademark of Oracle and/or its affiliates.
XFS® is a trademark of Silicon Graphics International Corp. or its subsidiaries in the United States and/or other countries.
MySQL® is a registered trademark of MySQL AB in the United States, the European Union and other countries.
Node.js® is an official trademark of the OpenJS Foundation.
The OpenStack® Word Mark and OpenStack logo are either registered trademarks/service marks or trademarks/service marks of the OpenStack Foundation, in the United States and other countries and are used with the OpenStack Foundation’s permission. We are not affiliated with, endorsed or sponsored by the OpenStack Foundation, or the OpenStack community.
All other trademarks are the property of their respective owners.