이 콘텐츠는 선택한 언어로 제공되지 않습니다.
Chapter 2. Retrieving CodeReady Workspaces logs
This is a catalog of the location and instructions to retrieve application logs (for administrators and for users).
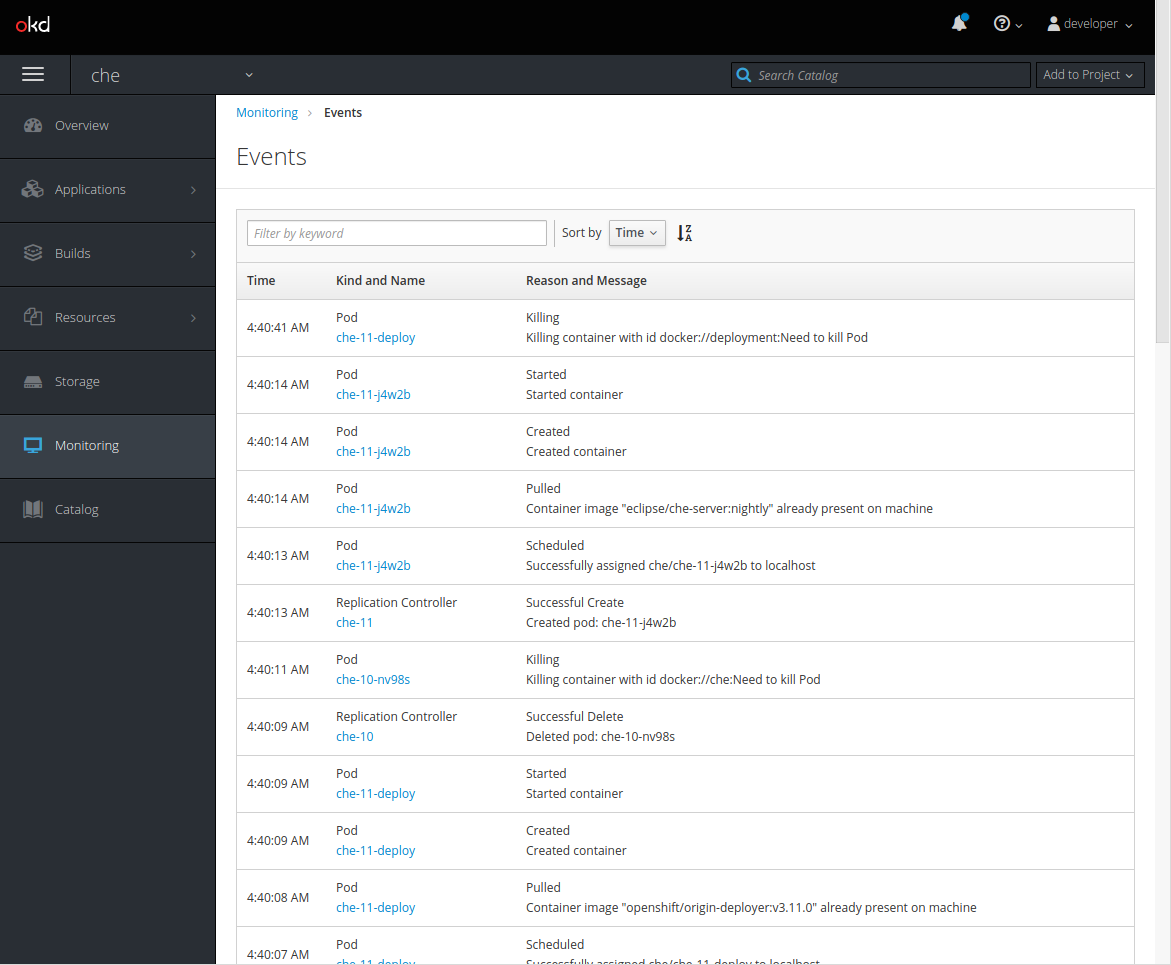
2.1. Viewing OpenShift events
This section describes how to view the Kubenertes events.
Prerequisites
- A running OpenShift Web Console.
Procedure
- In the OpenShift Web Console, click the Monitoring tab in the left panel.
- To view the list of all events, click the View Details button in the top-right corner.
The details of the events will be displayed.
Additional resources
- For a list of OpenShift events, see Comprehensive List of Events in OpenShift documentation.
2.2. Viewing CodeReady Workspaces server logs
This section describes how to view the CodeReady Workspaces server logs on the console and on the command line.
2.2.1. Viewing the CodeReady Workspaces server logs in the web console
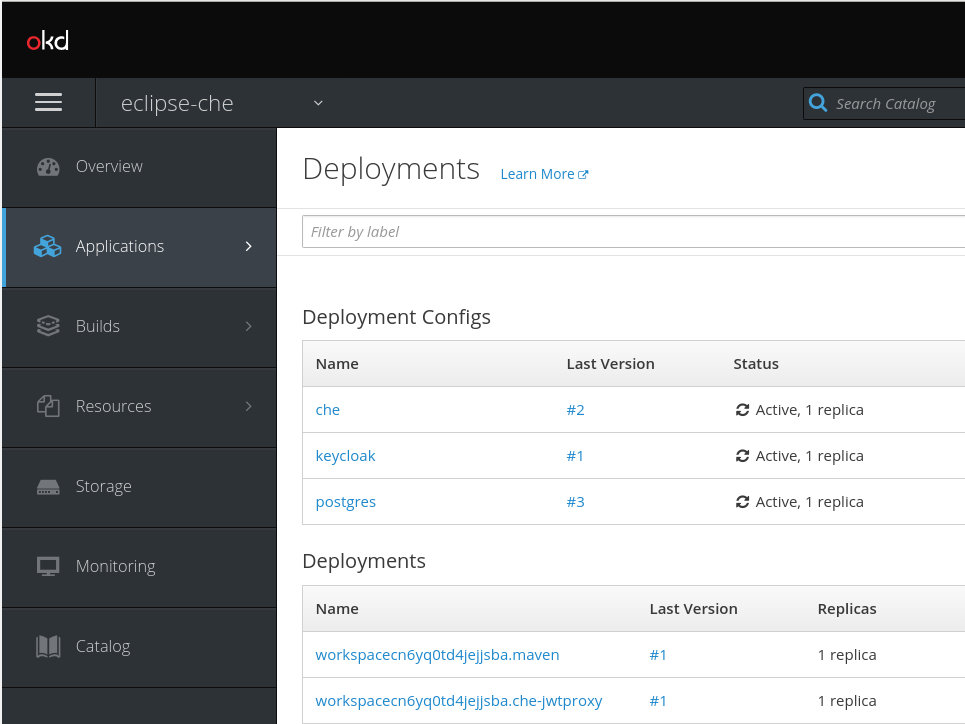
This section describes how to view the CodeReady Workspaces server logs in the OpenShift web console.
Procedure
- In the OpenShift Web Console, click Applications > Deployments.
In the Filter by label search field, type
workspacesto see the CodeReady Workspaces server log.Click the View log link for the active CodeReady Workspaces deployment.
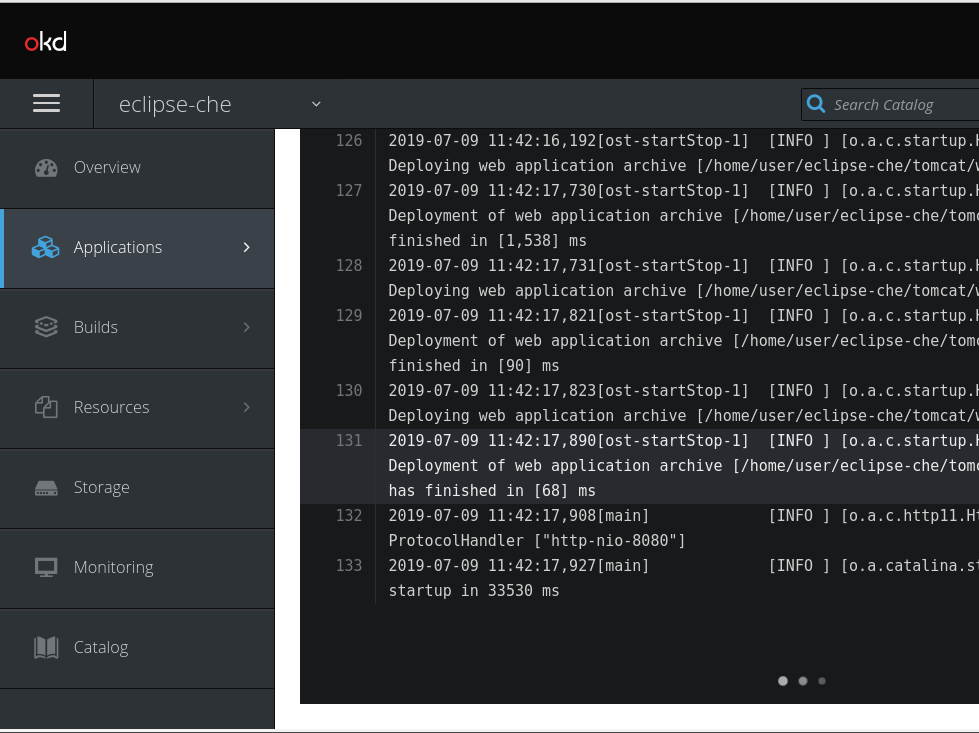
The following log is displayed.
- Search the log for CodeReady Workspaces-server related diagnostics, error information, and information reported by other server components.
2.2.2. Viewing the CodeReady Workspaces server logs on the command line
This section describes how to view the CodeReady Workspaces server logs on the command line.
Procedure
In the terminal, run the following command to get the pods:
oc get pods
$ oc get podsCopy to Clipboard Copied! Toggle word wrap Toggle overflow Exampleoc get pods NAME READY STATUS RESTARTS AGE che-11-j4w2b 1/1 Running 0 3m
$ oc get pods
NAME            READY  STATUS   RESTARTS  AGE
che-11-j4w2b    1/1    Running  0         3m
Copy to Clipboard Copied! Toggle word wrap Toggle overflow To get the logs for a deployment, run the following command:
oc logs <name-of-pod>
$ oc logs <name-of-pod>Copy to Clipboard Copied! Toggle word wrap Toggle overflow Exampleoc logs che-11-j4w2b
$ oc logs che-11-j4w2bCopy to Clipboard Copied! Toggle word wrap Toggle overflow
2.3. Viewing external service logs
This section describes how the view the logs from external services related to CodeReady Workspaces server.
2.3.1. Viewing Keycloak logs
The Keycloak OpenID provider consists of two parts: Server and IDE. It writes its diagnostics or error information to several logs.
2.3.1.1. Viewing the Keycloak server logs
This section describes how to view the Keycloak OpenID provider server logs.
Procedure
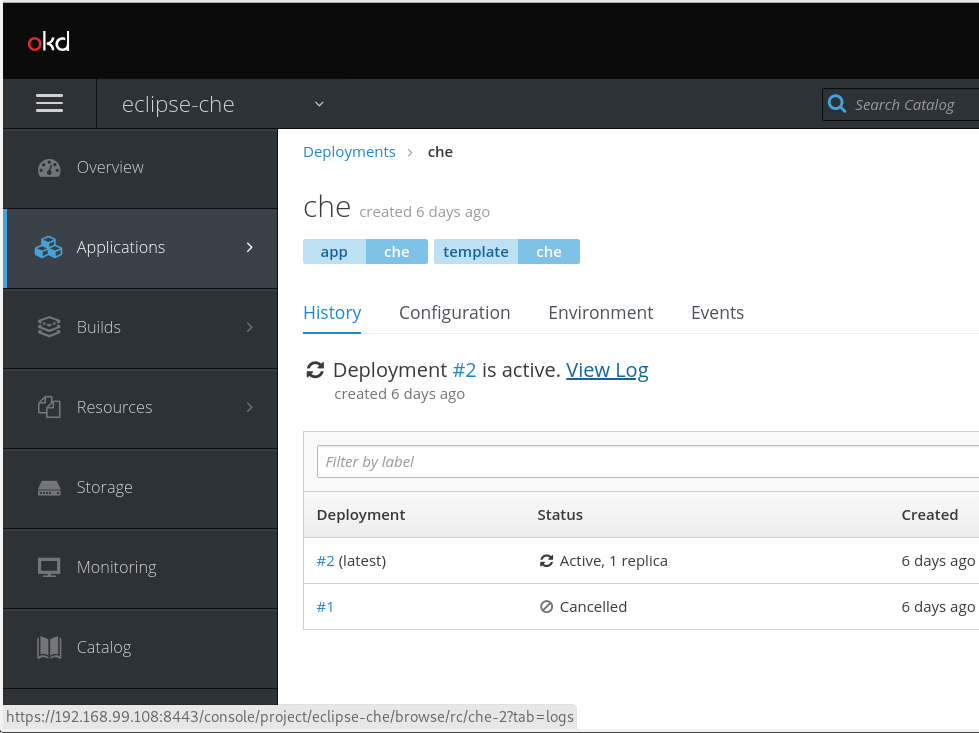
- In the OpenShift Web Console, click Deployments.
-
In the Filter by label search field, type
keycloakto see the Keycloak logs. -
In the Deployment Configs section, click on the
keycloaklink to open it. - In the History tab, click the View log link for the active Keycloak deployment.
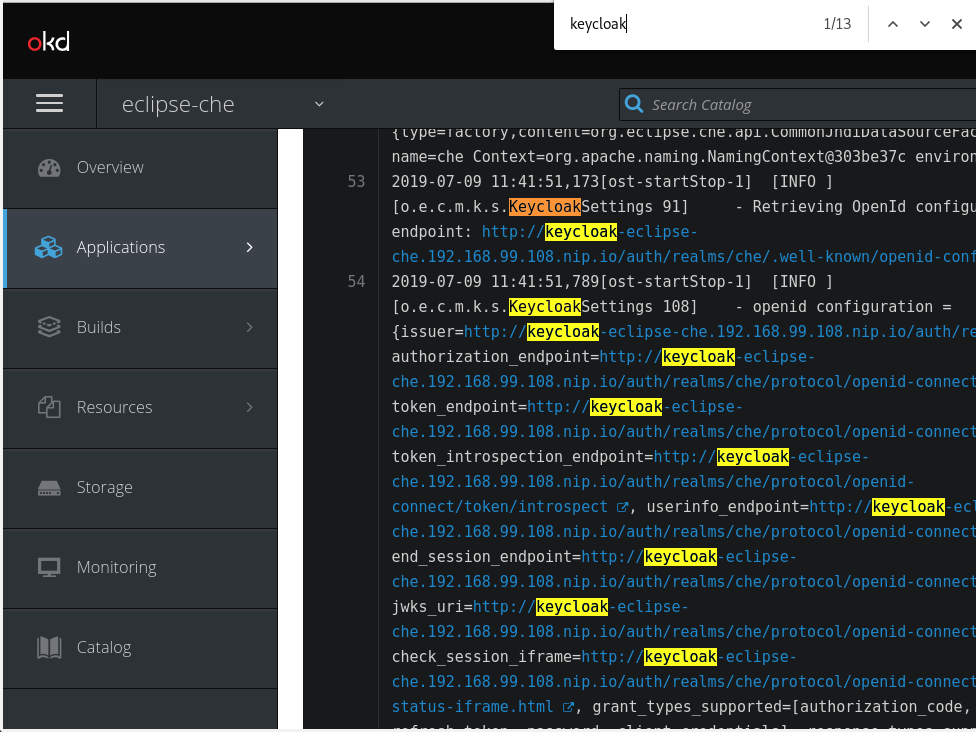
- The Keycloak logs are displayed.
To view the Keycloak IDE server diagnostics or error related messages, search for
keycloakin the log.
Additional resources
- See the Section 2.2, “Viewing CodeReady Workspaces server logs” for diagnostics and error messages related to the Keycloak IDE Server.
2.3.1.2. Viewing the Keycloak client logs on Firefox
This section describes how to view the Keycloak IDE client diagnostics or error information in the Firefox WebConsole.
Procedure
- Click Menu > WebDeveloper > WebConsole.
2.3.1.3. Viewing the Keycloak client logs on Google Chrome
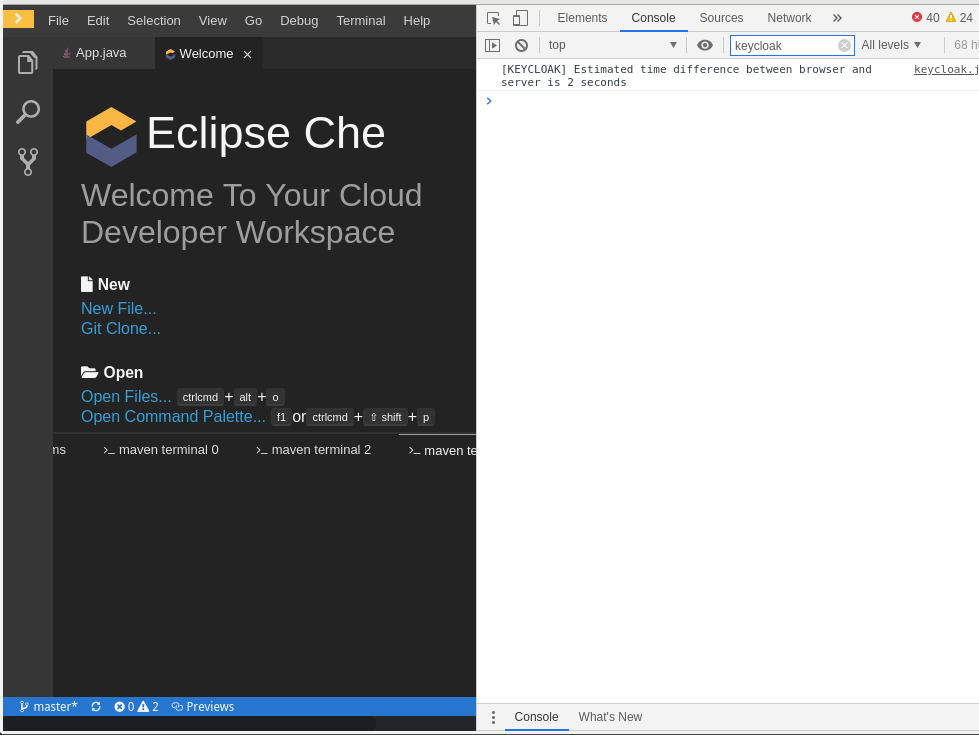
This section describes how to view the Keycloak IDE client diagnostics or error information in the Google Chrome Console tab.
Procedure
- Click on Menu > More Tools > Developer Tools.
Click on the Console tab.
2.3.2. Viewing the PostgreSQL server logs
This section describes how to view the PostgreSQL server logs.
Procedure
- In the OpenShift Web Console, click Deployments.
-
In the Find by label search field, type
postgresto see the PostgreSQL logs. Click postgres deployment to open it. - Click the View log link for the active PostgreSQL deployment.
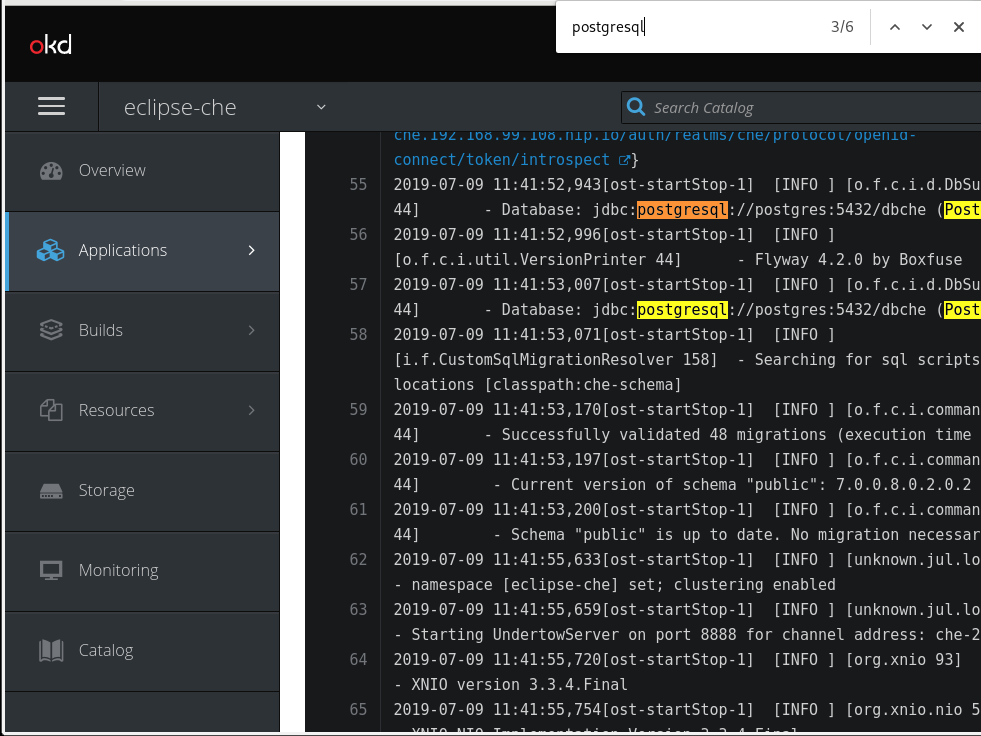
- The logs are displayed.
To see PostgreSQL server diagnostics or error related messages, search
postgresqlthrough the log.
Additional resources
- Some diagnostics or error messages related to the PostgreSQL server can be found in the active CodeReady Workspaces deployment log. For details to access the active CodeReady Workspaces deployments logs, see the Section 2.2, “Viewing CodeReady Workspaces server logs” section.
2.4. Viewing workspaces logs
This section describes how to view workspaces logs.
2.4.1. Viewing Che-Theia IDE logs
This section describes how to view Che-Theia IDE logs, on the command line and in the OpenShift web console.
2.4.1.1. Viewing Che-Theia IDE logs on the command line
This section describes how to view Che-Theia IDE logs on the command line.
Procedure
Run the following command to get the list of all the pods:
oc get pods
$ oc get podsCopy to Clipboard Copied! Toggle word wrap Toggle overflow Exampleoc get pods NAME READY STATUS RESTARTS AGE che-9-xz6g8 1/1 Running 1 15h workspace0zqb2ew3py4srthh.go-cli-549cdcf69-9n4w2 4/4 Running 0 1h
$ oc get pods
NAME                                              READY  STATUS   RESTARTS  AGE
che-9-xz6g8                                       1/1    Running  1         15h
workspace0zqb2ew3py4srthh.go-cli-549cdcf69-9n4w2  4/4    Running  0         1h
Copy to Clipboard Copied! Toggle word wrap Toggle overflow Run the following command to get the list of all the containers in the particular pod:
oc get pods <name-of-pod> -o
$ oc get pods <name-of-pod> -oCopy to Clipboard Copied! Toggle word wrap Toggle overflow Exampleoc get pods workspace0zqb2ew3py4srthh.go-cli-549cdcf69-9n4w2 -o jsonpath='\{.spec.containers[*].name}' go-cli che-machine-exechr7 theia-idexzb vscode-gox3r$ oc get pods workspace0zqb2ew3py4srthh.go-cli-549cdcf69-9n4w2 -o jsonpath='\{.spec.containers[*].name}' > go-cli che-machine-exechr7 theia-idexzb vscode-gox3rCopy to Clipboard Copied! Toggle word wrap Toggle overflow Get logs from the
theia/idecontainer:oc logs -f <name-of-container> -c
$ oc logs -f <name-of-container> -cCopy to Clipboard Copied! Toggle word wrap Toggle overflow Exampleoc logs -f workspace0zqb2ew3py4srthh.go-cli-549cdcf69-9n4w2 -c theia-idexzb
$ oc logs -f workspace0zqb2ew3py4srthh.go-cli-549cdcf69-9n4w2 -c
theia-idexzb
Copy to Clipboard Copied! Toggle word wrap Toggle overflow
2.4.1.2. Viewing Che-Theia IDE logs in the web console
This section describes how to view Che-Theia IDE logs in the OpenShift web console.
Procedure
To view Che-Theia IDE logs on the console:
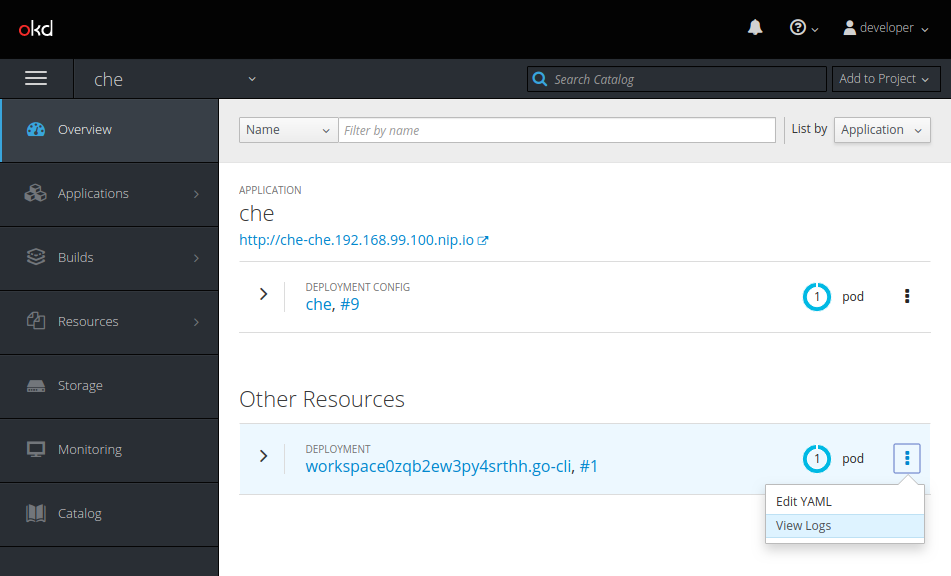
- In the OpenShift Web Console, click Overview.
Search for the particular deployment, click on the context menu on the right side of the deployment, and click View Logs.
In the drop-down list, click theia-ide.

2.4.2. Viewing logs from language servers and debug adapters
2.4.2.1. Checking important logs
This section describes how to check important logs.
Procedure
-
In the OpenShift web console, click Applications
Pods to see a list of all the active workspaces. - Click on the name of the running pod where the workspace is running. The pod screen contains the list of all containers with additional information.
Choose a container and click on the container name.
TipThe most important logs are the
theia-idecontainer and the plug-ins container logs.On the container screen, navigate to the Logs section.
ExampleThe following is an output log of the sidecar container running the Java plug-in.

2.4.2.2. Detecting memory problems
This section describes how to detect memory problems related to a plug-in running out of memory. The following are the two most common problems related to a plug-in running out of memory:
- The plug-in container runs out of memory
-
This can happen during plug-in initialization when the container does not have enough RAM to execute the entrypoint of the image. The user can detect this in the logs of the plug-in container. In this case, the logs should contain
OOMKilled, which implies that the processes in the container requested more memory than is available in the container. - A process inside the container runs out of memory without the container noticing this
For example, the Java language server (Eclipse JDT Language Server, started by the vscode-java extension) throws an OutOfMemoryException. This can happen any time after the container is initialized, for example, when a plug-in starts a language server or when a process runs out of memory because of the size of the project it has to handle.
To detect this problem, check the logs of the main process, which should run in the container. For example, to check the log file of Eclipse JDT Language Server for details, see the relevant plug-in-specific sections.
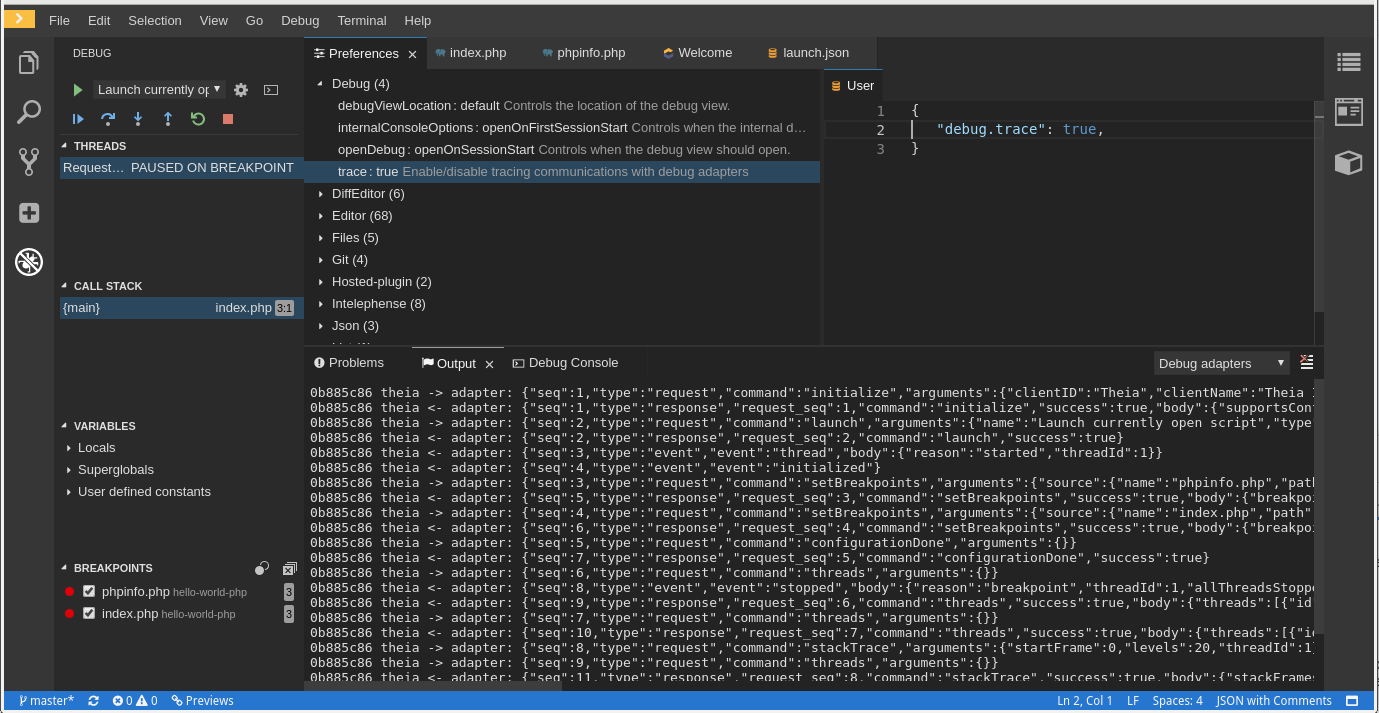
2.4.2.3. Logging the client-server traffic for debug adapters
This section describes how to log the exchange between Che-Theia and a debug adapter into the Output view.
Prerequisites
- A debug session must be started for the Debug adapters option to appear in the list.
Procedure
-
Click File
Settings and then open Preferences. - Expand the Debug section in the Preferences view.
-
Set the trace preference value to
true(default isfalse). - All the communication events are now logged.
To watch these events, click View
Output and select Debug adapters from the drop-down list at the top-right corner of the Output view.
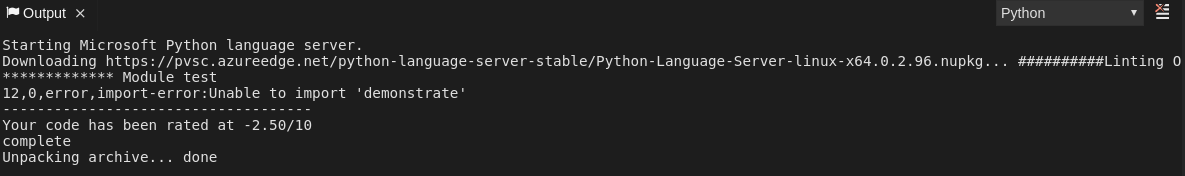
2.4.2.4. Viewing logs for Python
This section describes how to view logs for the Python language server.
Procedure
Navigate to the Output view and select Python in the drop-down list.
2.4.2.5. Viewing logs for Go
This section describes how to view logs for the Go language server.
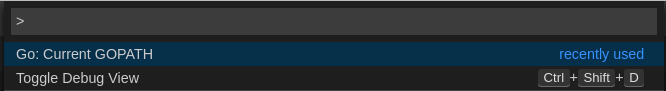
2.4.2.5.1. Finding the gopath
This section describes how to find where the GOPATH variable points to.
Procedure
Execute the
Go: Current GOPATHcommand.

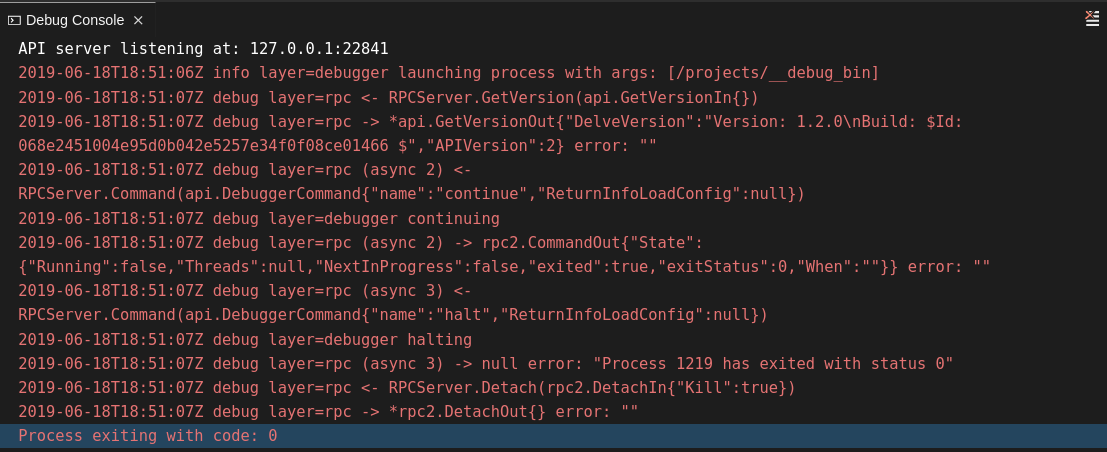
2.4.2.5.2. Viewing the Debug Console log for Go
This section describes how to view the log output from the Go debugger.
Procedure
Set the
showLogattribute totruein the debug configuration.Copy to Clipboard Copied! Toggle word wrap Toggle overflow To enable debugging output for a component, add the package to the comma-separated list value of the
logOutputattribute:Copy to Clipboard Copied! Toggle word wrap Toggle overflow The debug console prints the additional information in the debug console.
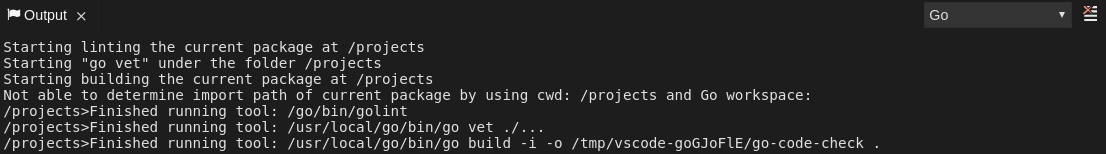
2.4.2.5.3. Viewing the Go logs output in the Output panel
This section describes how to view the Go logs output in the Output panel.
Procedure
- Navigate to the Output view.
Select Go in the drop-down list.
2.4.2.6. Viewing logs for the NodeDebug NodeDebug2 adapter
There are no specific diagnostics other than the general ones.
2.4.2.7. Viewing logs for Typescript
2.4.2.7.1. Enabling the label switched protocol (LSP) tracing
Procedure
-
To enable the tracing of messages sent to the Typescript (TS) server, in the Preferences view, set the
typescript.tsserver.traceattribute toverbose. Use this to diagnose the TS server issues. -
To enable logging of the TS server to a file, set the
typescript.tsserver.logattribute toverbose. Use this log to diagnose the TS server issues. The log contains the file paths.
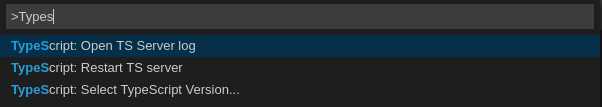
2.4.2.7.2. Viewing the Typescript language server log
This section describes how to view the Typescript language server log.
Procedure
To get the path to the log file, see the Typescript Output console:
To open log file, use the Open TS Server log command.

2.4.2.7.3. Viewing the Typescript logs output in the Output panel
This section describes how to view the Typescript logs output in the Output panel.
Procedure
- Navigate to the Output view
Select TypeScript in the drop-down list.

2.4.2.8. Viewing logs for Java
Other than the general diagnostics, there are Language Support for Java (Eclipse JDT Language Server) plug-in actions that the user can perform.
2.4.2.8.1. Verifying the state of the Eclipse JDT Language Server
Procedure
Check if the container running the Eclipse JDT Language Server plug-in is running the Eclipse JDT Language Server main process.
-
Open a terminal in the container that is running the Eclipse JDT Language Server plug-in (an example name for the container:
vscode-javaxxx). Inside the terminal, run the
ps aux | grep jdtcommand to check if the Eclipse JDT Language Server process is running in the container. If the process is running, the output should be:usr/lib/jvm/default-jvm/bin/java --add-modules=ALL-SYSTEM --add-opens java.base/java.util
usr/lib/jvm/default-jvm/bin/java --add-modules=ALL-SYSTEM --add-opens java.base/java.utilCopy to Clipboard Copied! Toggle word wrap Toggle overflow This message also shows the VSCode java extension used. If it is not running, the language server has not been started inside the container.
- Check all logs described in Section 2.4.2.1, “Checking important logs”
2.4.2.8.2. Verifying the Eclipse JDT Language Server features
Procedure
If the Eclipse JDT Language Server process is running, check if the language server features are working:
- Open a Java file and use the hover or autocomplete functionality. In case of an erroneous file, the user sees Java in the Outline view or in the Problems view.
2.4.2.8.3. Viewing the Java language server log
Procedure
The Eclipse JDT Language Server has its own workspace where it logs errors, information about executed commands, and events.
- To open this log file, open a terminal in the container that is running the Eclipse JDT Language Server plug-in. You can also view the log file by running the Java: Open Java Language Server log file command.
-
Run
cat <PATH_TO_LOG_FILE>wherePATH_TO_LOG_FILEis/home/theia/.theia/workspace-storage/<workspace_name>/redhat.java/jdt_ws/.metadata/.log.
2.4.2.8.4. Logging the Java language server protocol (LSP) messages
Procedure
To log the LSP messages to the VS Code Output view, enable tracing by setting the java.trace.server attribute to verbose.
Additional resources
For troubleshooting instructions, see the VS Code Java Github repository.
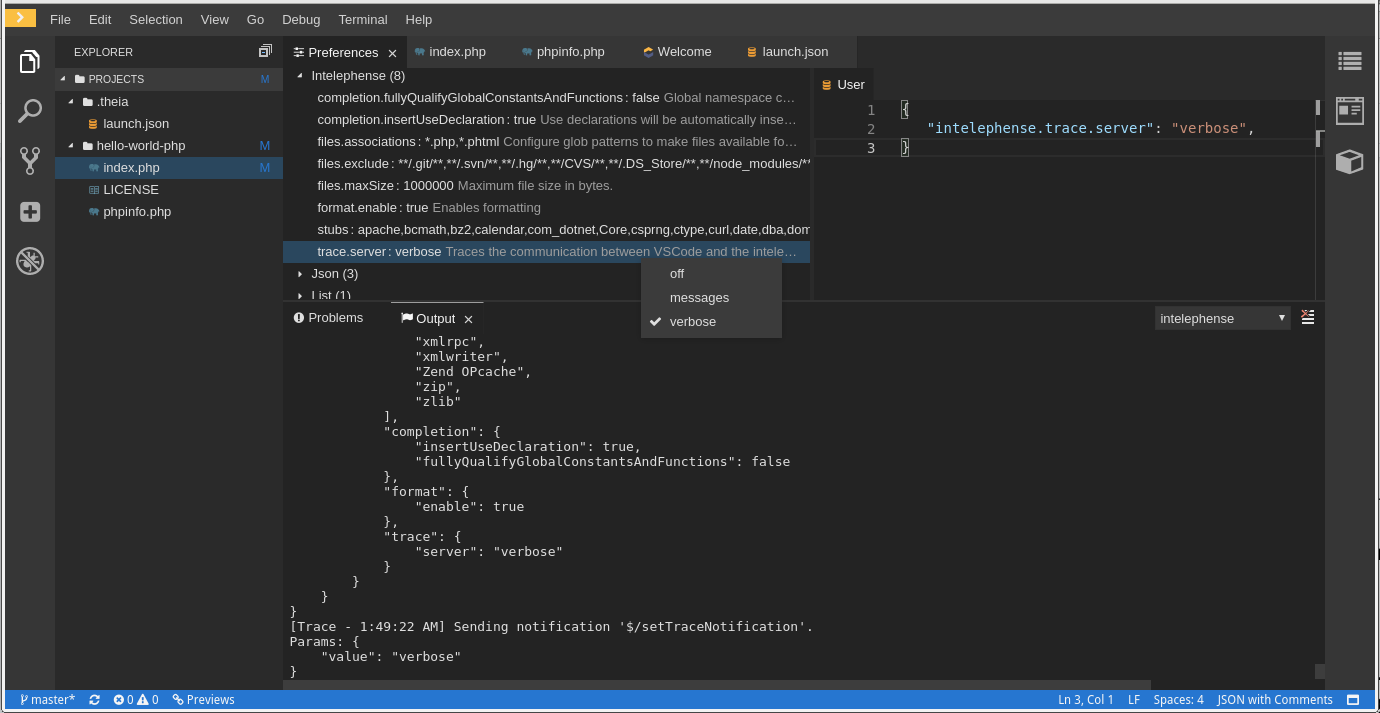
2.4.2.9. Viewing logs for Intelephense
2.4.2.9.1. Logging the Intelephense client-server communication
Procedure
To configure the PHP Intelephense language support to log the client-server interexchange in the Output view:
-
Click File
Settings. - Open the Preferences view.
-
Expand the Intelephense section and set the
trace.server.verbosepreference value toverboseto see all the communication events (the default value isoff).
2.4.2.9.2. Viewing Intelephense events in the Output panel
This procedure describes how to view Intelephense events in the Output panel.
Procedure
-
Click View
Output Select Intelephense in the drop-down list for the Output view.
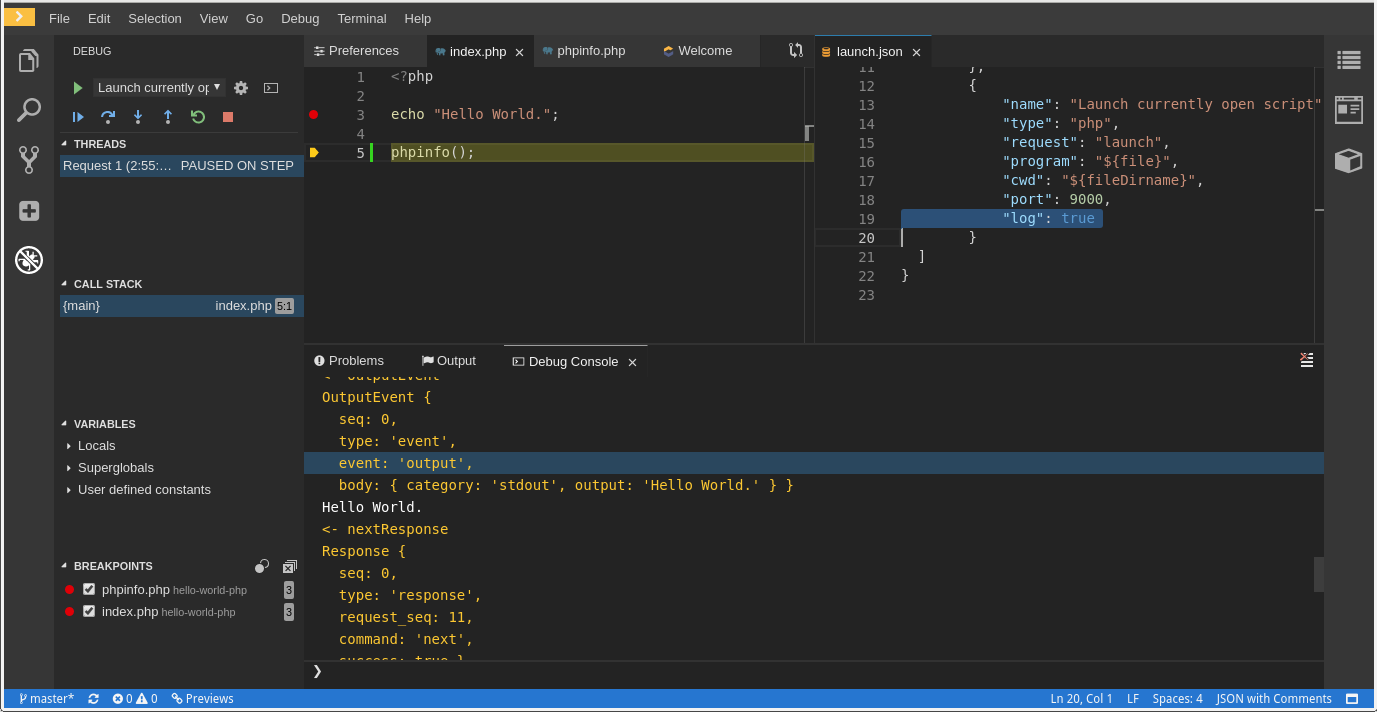
2.4.2.10. Viewing logs for PHP-Debug
This procedure describes how to configure the PHP Debug plug-in to log the PHP Debug plug-in diagnostic messages into the Debug Console view. Configure this before the start of the debug session.
Procedure
-
In the
launch.jsonfile, add the"log": trueattribute to the selected launch configuration. - Start the debug session.
The diagnostic messages are printed into the Debug Console view along with the application output.
2.4.2.11. Viewing logs for XML
Other than the general diagnostics, there are XML plug-in specific actions that the user can perform.
2.4.2.11.1. Verifying the state of the XML language server
Procedure
-
Open a terminal in the container named
vscode-xml-<xxx>. Run
ps aux | grep javato verify that the XML language server has started. The output should be:java ***/org.eclipse.ls4xml-uber.jar`
java ***/org.eclipse.ls4xml-uber.jar`Copy to Clipboard Copied! Toggle word wrap Toggle overflow If not, see Section 2.4.2.1, “Checking important logs”.
2.4.2.11.2. Checking XML language server feature flags
Procedure
Check if the features are enabled. The XML plug-in provides multiple settings that can enable and disable features:
-
xml.format.enabled: Enable the formatter -
xml.validation.enabled: Enable the validation -
xml.documentSymbols.enabled: Enable the document symbols
-
-
To diagnose whether the XML language server is working, create a simple XML element, such as
<hello></hello>, and confirm that it appears in the Outline panel on the right. -
If the document symbols do not show, ensure that the
xml.documentSymbols.enabledattribute is set totrue. If it istrue, and there are no symbols, the language server may not be hooked to the editor. If there are document symbols, then the language server is connected to the editor. -
Ensure that the features that the user needs, are set to
truein the settings (they are set totrueby default). If any of the features are not working, or not working as expected, file an issue against the Language Server.
2.4.2.11.3. Enabling XML Language Server Protocol (LSP) tracing
Procedure
To log LSP messages to the VS Code Output view, enable tracing by setting the xml.trace.server attribute to verbose.
2.4.2.11.4. Viewing the XML language server log
Procedure
The log from the language server can be found in the plug-in sidecar at /home/theia/.theia/workspace-storage/<workspace_name>/redhat.vscode-xml/lsp4xml.log.
2.4.2.12. Viewing logs for YAML
This section describes the YAML plug-in specific actions that the user can perform, in addition to the general diagnostics ones.
2.4.2.12.1. Verifying the state of the YAML language server
This section describes how to verify the state of the YAML language server.
Procedure
Check if the container running the YAML plug-in is running the YAML language server.
-
In the editor, open a terminal in the container that is running the YAML plug-in (an example name of the container:
vscode-yaml-<xxx>). -
In the terminal, run the
ps aux | grep nodecommand. This command searches all the node processes running in the current container. Verify that a command
node **/server.jsis running.
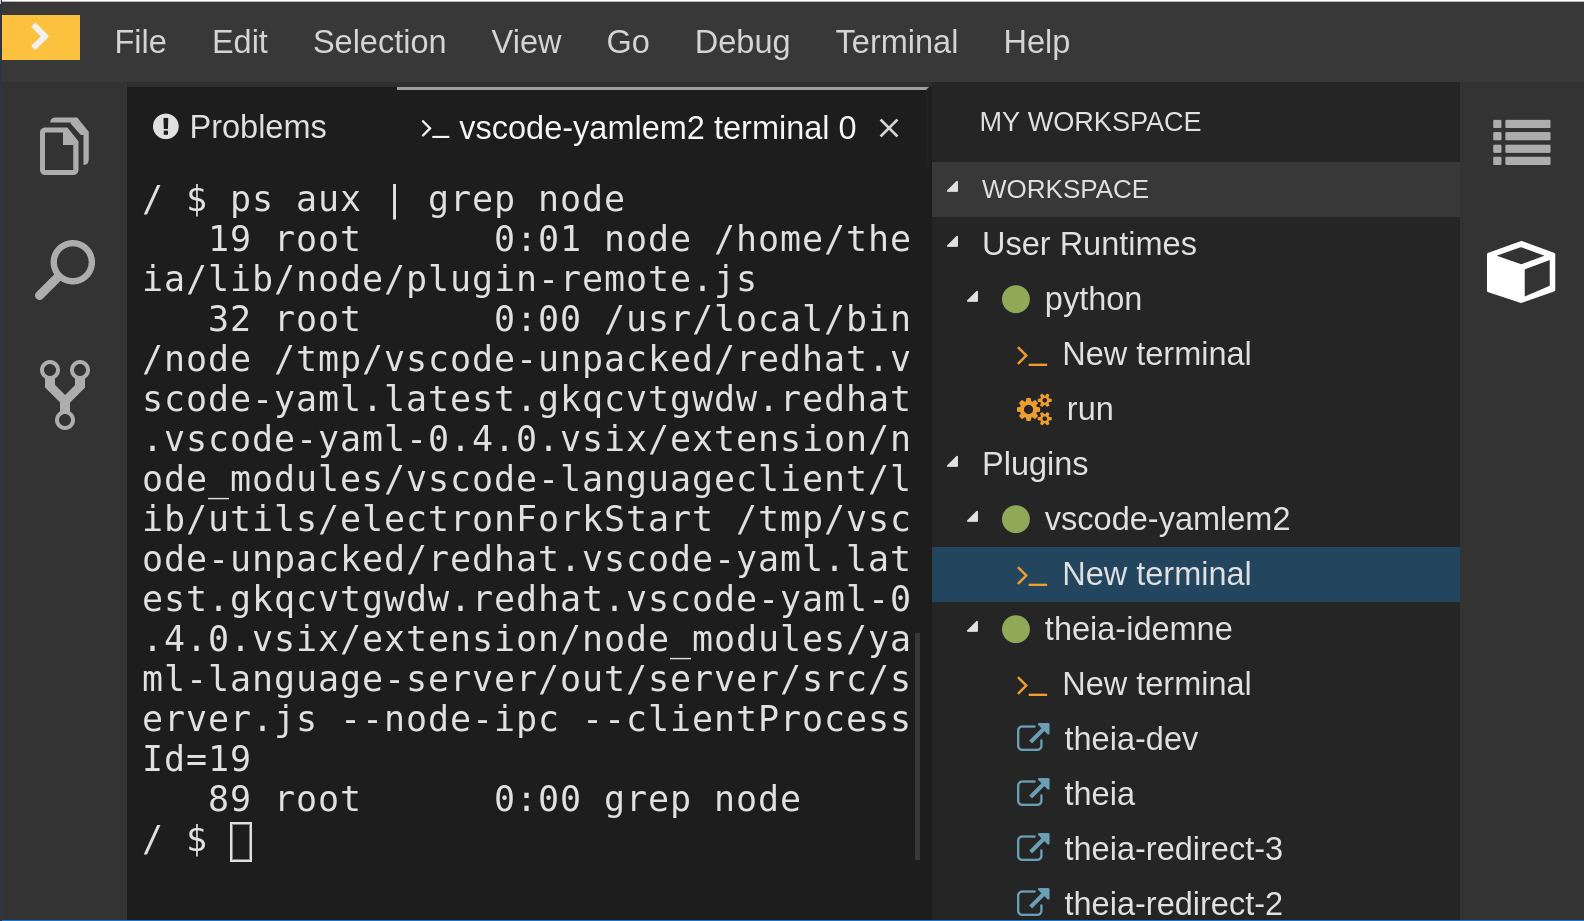
The node **/server.js running in the container indicates that the language server is running. If it is not running, the language server has not started inside the container. In this case, see Section 2.4.2.1, “Checking important logs”.
2.4.2.12.2. Checking the YAML language server feature flags
Procedure
To check the feature flags:
Check if the features are enabled. The YAML plug-in provides multiple settings that can enable and disable features, such as:
-
yaml.format.enable: Enables the formatter -
yaml.validate: Enables validation -
yaml.hover: Enables the hover function -
yaml.completion: Enables the completion function
-
-
To check if the plug-in is working, type the simplest YAML, such as
hello: world, and then open the Outline panel on the right side of the editor. - Verify if there are any document symbols. If yes, the language server is connected to the editor.
-
If any feature is not working, make sure that the settings listed above are set to
true(they are set totrueby default). If a feature is not working, file an issue against the Language Server.
2.4.2.12.3. Enabling YAML Language Server Protocol (LSP) tracing
Procedure
To log LSP messages to the VS Code Output view, enable tracing by setting the yaml.trace.server attribute to verbose.
2.4.2.13. Viewing logs for Dotnet with Omnisharp-Theia plug-in
2.4.2.13.1. Omnisharp-Theia plug-in
CodeReady Workspaces uses the Omnisharp-Theia plug-in as a remote plug-in. It is located at github.com/redhat-developer/omnisharp-theia-plugin. In case of an issue, report it, or contribute your fix in the repository.
This plug-in registers omnisharp-roslyn as a language server and provides project dependencies and language syntax for C# applications.
The language server runs on .Net SDK 2.2.105.
2.4.2.13.2. Verifying the state of the Omnisharp-Theia plug-in language server
Procedure
To check if the container running the Omnisharp-Theia plug-in is running OmniSharp, execute the ps aux | grep OmniSharp.exe command. If the process is running, the following is an example output:
/tmp/theia-unpacked/redhat-developer.che-omnisharp-plugin.0.0.1.zcpaqpczwb.omnisharp_theia_plugin.theia/server/bin/mono
/tmp/theia-unpacked/redhat-developer.che-omnisharp-plugin.0.0.1.zcpaqpczwb.omnisharp_theia_plugin.theia/server/omnisharp/OmniSharp.exe
/tmp/theia-unpacked/redhat-developer.che-omnisharp-plugin.0.0.1.zcpaqpczwb.omnisharp_theia_plugin.theia/server/bin/mono
/tmp/theia-unpacked/redhat-developer.che-omnisharp-plugin.0.0.1.zcpaqpczwb.omnisharp_theia_plugin.theia/server/omnisharp/OmniSharp.exeIf the output is different, the language server has not started inside the container. Check the logs described in Section 2.4.2.1, “Checking important logs”.
2.4.2.13.3. Checking Omnisharp Che-Theia plug-in language server features
Procedure
-
If the OmniSharp.exe process is running, check if the language server features are working by opening a
.csfile and trying the hover or completion features, or opening the Problems or Outline view.
2.4.2.13.4. Viewing Omnisharp-Theia plug-in logs in the Output panel
Procedure
If Omnisharp.exe is running, it logs all information in the Output panel. To view the logs, open the Output view and select C# from the drop-down list.
2.4.2.14. Viewing logs for Dotnet with NetcoredebugOutput plug-in
2.4.2.14.1. NetcoredebugOutput plug-in
The NetcoredebugOutput plug-in provides netcoredbg, which implements the VS Code Debug Adapter protocol and allows users to debug .NET applications under the .NET Core runtime.
Dotnet SDK v.2.2.105 is installed in the container where the Netcoredbg plug-in is running.
2.4.2.14.2. Verifying the state of the NetcoredebugOutput plug-in
Procedure
To test the plug-in initialization:
Check if there is a netcoredbg debug configuration in the
launch.jsonfile. The following is an example debug configuration:Copy to Clipboard Copied! Toggle word wrap Toggle overflow -
To test if it exists, test the autocompletion feature within the braces of the
configurationsection of thelaunch.jsonfile. If you can findnetcoredbg, the Che-Theia plug-in is correctly initialized. If not, see Section 2.4.2.1, “Checking important logs”.
2.4.2.14.3. Viewing NetcoredebugOutput plug-in logs in the Output panel
This section describes how to view NetcoredebugOutput plug-in logs in the Output panel.
Procedure
Open the Debug console.

2.4.2.15. Viewing logs for Camel
2.4.2.15.1. Verifying the state of the Camel language server
Procedure
The user can inspect the log output of the sidecar container running the Camel tooling; the Camel tooling container is named: vscode-apache-camel<xxx>.
To verify the state of the language server:
-
Open a terminal inside the
vscode-apache-camel<xxx>container. Run the
ps aux | grep javacommand. The following is an example language server process:java -jar /tmp/vscode-unpacked/camel-tooling.vscode-apache-camel.latest.euqhbmepxd.camel-tooling.vscode-apache-camel-0.0.14.vsix/extension/jars/language-server.jar
java -jar /tmp/vscode-unpacked/camel-tooling.vscode-apache-camel.latest.euqhbmepxd.camel-tooling.vscode-apache-camel-0.0.14.vsix/extension/jars/language-server.jarCopy to Clipboard Copied! Toggle word wrap Toggle overflow - If you cannot find it, see Section 2.4.2.1, “Checking important logs”.
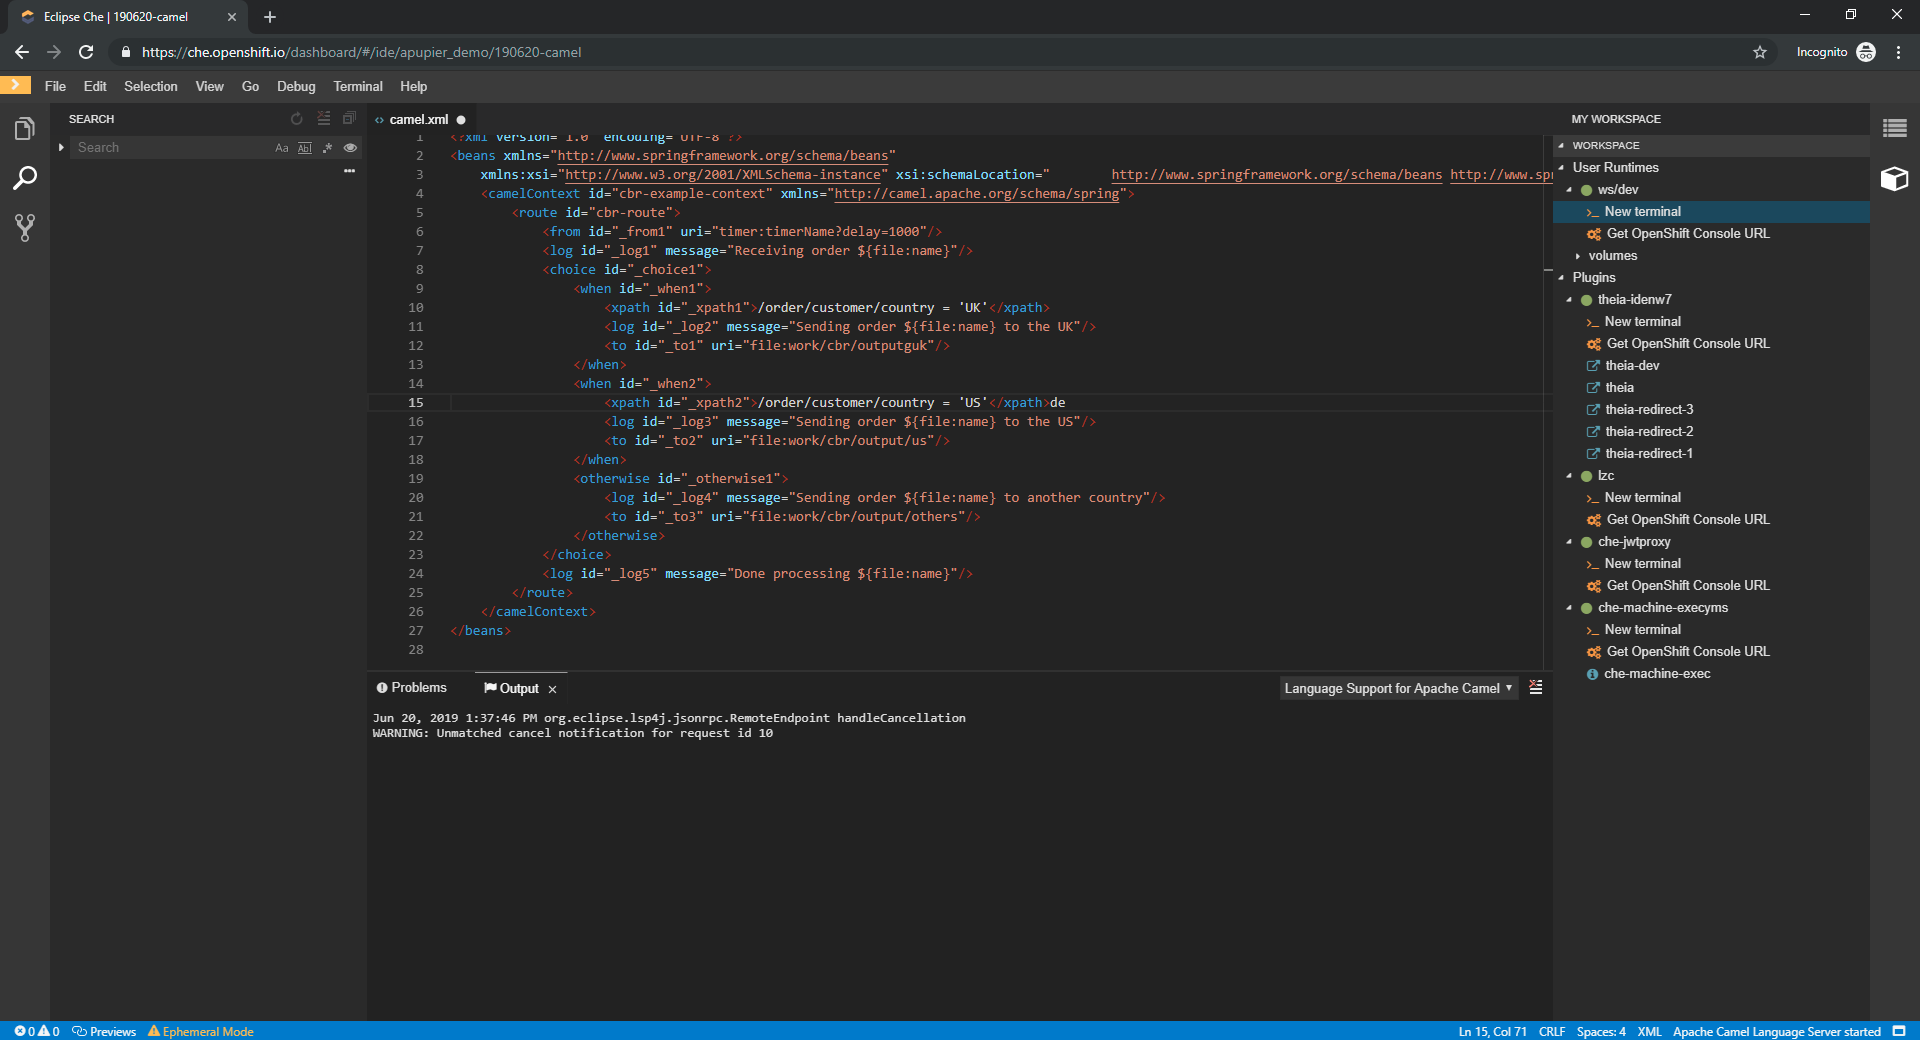
2.4.2.15.2. Viewing Camel logs in the Output panel
The Camel language server is a SpringBoot application that writes its log to the $\{java.io.tmpdir}/log-camel-lsp.out file. Typically, $\{java.io.tmpdir} points to the /tmp directory, so the filename is /tmp/log-camel-lsp.out.
Procedure
The Camel language server logs are printed in the Output channel named Language Support for Apache Camel.
The output channel is created only at the first created log entry on the client side. It may be absent when everything is going well.
2.5. Viewing the plug-in broker logs
This section describes how to view the plug-in broker logs.
The logs from the plug-in broker are not persisted. As the Pod itself is deleted very quickly, events will in most cases be unavailable.
Procedure
- Logs are displayed to the user while the workspace is starting.