This documentation is for a release that is no longer maintained
See documentation for the latest supported version.이 콘텐츠는 선택한 언어로 제공되지 않습니다.
Chapter 1. Enabling observability for Red Hat Developer Hub on OpenShift Container Platform
In OpenShift Container Platform, metrics are exposed through an HTTP service endpoint under the /metrics canonical name. You can create a ServiceMonitor custom resource (CR) to scrape metrics from a service endpoint in a user-defined project.
You can enable and view metrics for an Operator-installed Red Hat Developer Hub instance from the Developer perspective of the OpenShift Container Platform web console.
Prerequisites
- Your OpenShift Container Platform cluster has monitoring for user-defined projects enabled.
- You have installed Red Hat Developer Hub on OpenShift Container Platform using the Red Hat Developer Hub Operator.
-
You have installed the OpenShift CLI (
oc).
Procedure
Currently, the Red Hat Developer Hub Operator does not support creating a ServiceMonitor custom resource (CR) by default. You must complete the following steps to create a ServiceMonitor CR to scrape metrics from the endpoint.
Create the
ServiceMonitorCR as a YAML file:Copy to Clipboard Copied! Toggle word wrap Toggle overflow - 1
- The name of your
ServiceMonitorresource, for example,developer_hub_service_monitor. - 2
- The namespace where your
ServiceMonitorwill live, for example,my-rhdh-project. - 3
- The label name identifying the
ServiceMonitorCR instance, for example,my-rhdh-custom-resource. - 4
- The namespace where your RHDH instance is installed, for example,
my-rhdh-project. - 5
- The name of your RHDH deployment, for example,
developer-hub. - 6
- The name of your RHDH application, for example,
backstage.
Notespec.selector.matchLabelsconfiguration must match the labels of your RHDH installation.Apply the
ServiceMonitorCR by running the following command:oc apply -f <filename>
oc apply -f <filename>Copy to Clipboard Copied! Toggle word wrap Toggle overflow
Verification
- From the Developer perspective in the OpenShift Container Platform web console, select the Observe view.
- Click the Metrics tab to view metrics for Red Hat Developer Hub pods.
-
From the Developer perspective in the OpenShift Container Platform web console, click Project > Services and verify the labels for
backstage-developer-hub.
You can enable and view metrics for a Red Hat Developer Hub Helm deployment from the Developer perspective of the OpenShift Container Platform web console.
Prerequisites
- Your OpenShift Container Platform cluster has monitoring for user-defined projects enabled.
- You have installed Red Hat Developer Hub on OpenShift Container Platform using the Helm chart.
Procedure
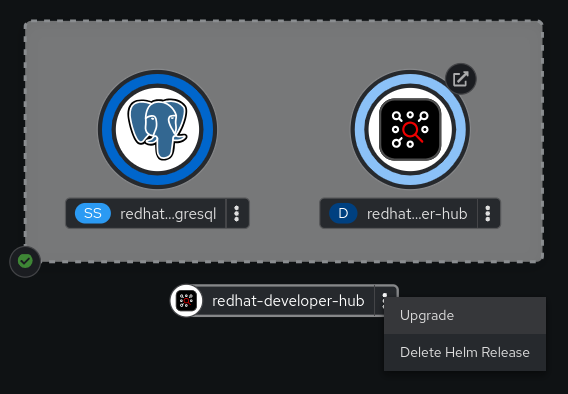
- From the Developer perspective in the OpenShift Container Platform web console, select the Topology view.
Click the overflow menu of the Red Hat Developer Hub Helm chart, and select Upgrade.
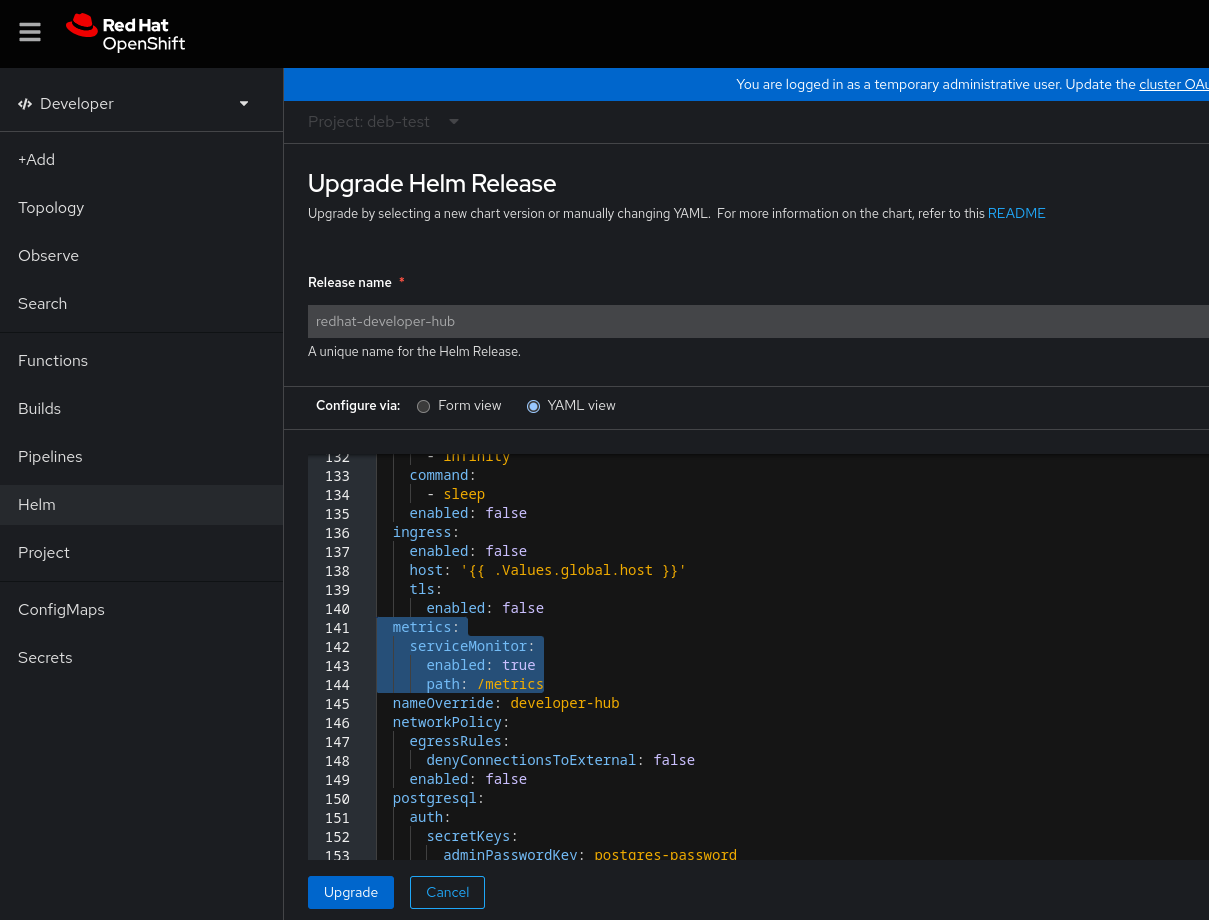
On the Upgrade Helm Release page, select the YAML view option in Configure via, then configure the
metricssection in the YAML, as shown in the following example:Copy to Clipboard Copied! Toggle word wrap Toggle overflow - Click Upgrade.
Verification
- From the Developer perspective in the OpenShift Container Platform web console, select the Observe view.
- Click the Metrics tab to view metrics for Red Hat Developer Hub pods.

