Fuse 6 is no longer supported
As of February 2025, Red Hat Fuse 6 is no longer supported. If you are using Fuse 6, please upgrade to Red Hat build of Apache Camel.이 콘텐츠는 선택한 언어로 제공되지 않습니다.
Chapter 4. To Trace a Message Through a Route
Abstract
This tutorial walks you through the process of tracing a message through a route.
Goals
링크 복사링크가 클립보드에 복사되었습니다!
In this tutorial you will:
- run a route in the Fuse Integration perspective
- enable tracing on your route
- drop messages onto your route and track them through the route's nodes
Prerequisites
링크 복사링크가 클립보드에 복사되었습니다!
To complete this tutorial you will need the
simple-route project you updated in Chapter 3, To Add a Content-Based Router.
Procedure
링크 복사링크가 클립보드에 복사되었습니다!
To trace a message through your route:
- Select
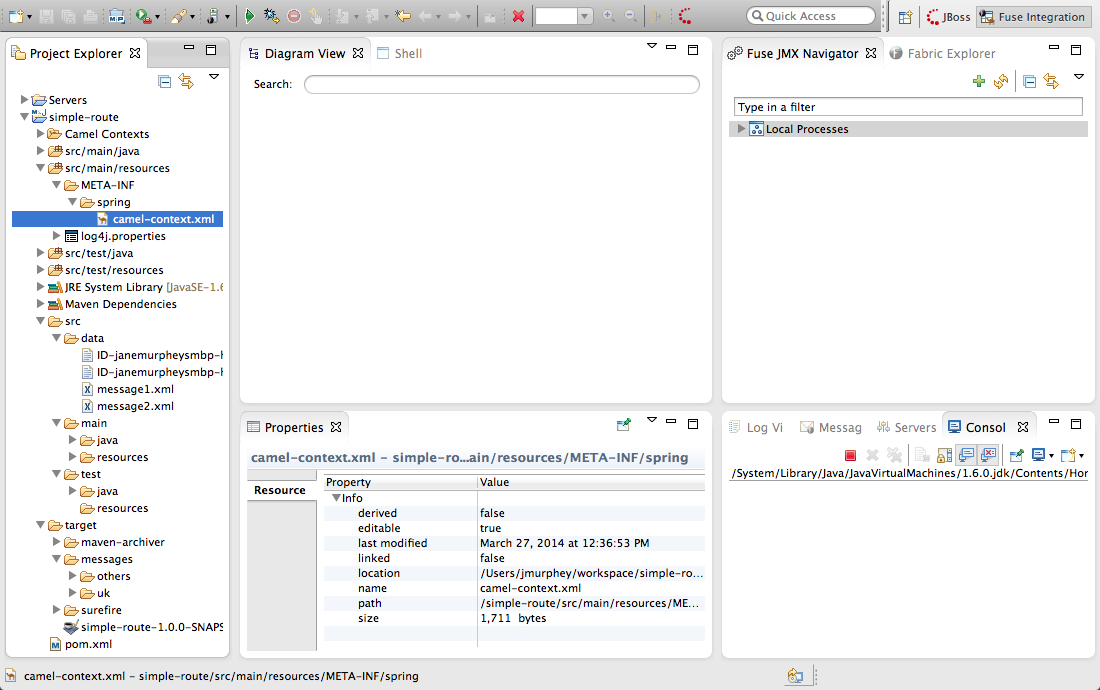
to open the Fuse Integration perspective as shown in Figure 4.1, “Fuse Integration perspective”). Figure 4.1. Fuse Integration perspective
NoteYou can use the Open Perspective icon ( ) in the perspectives tab to access the list of available perspectives.
- In Project Explorer, expand the
simple-routeproject to expose thesrc/main/resources/META-INF/spring/camel-context.xmlfile. - Select
from the camel-context.xmlfile's context menu. - In Fuse JMX Navigator, expand Local Processes.
- Double click to connect to the context and expand the elements of your route as shown in Figure 4.2, “Route elements in Fuse JMX Navigator”).
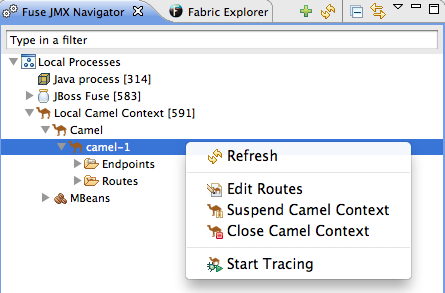
Figure 4.2. Route elements in Fuse JMX Navigator
- In Fuse JMX Navigator, select from the node's context menu.The tooling displays a graphical representation of your route in Diagram View.
- In Diagram View, drag the nodes to rearrange them, so you can clearly see the route's flow paths.NoteYou will have to rearrange the nodes in Diagram View each time you select a different node in Fuse JMX Navigator.
- In Project Explorer, expand
simple-route/src/data, so you can access themessage1.xmlandmessage2.xmlfiles as shown in Figure 4.3, “Message files in simple-route project”.Figure 4.3. Message files in simple-route project
- Drag
message1.xmland drop it on.../camel-1/Endpoints/file/src/data?noop=true.As the message traverses the route, the tooling traces and records its passage at each step and displays the results in Messages View. - Repeat Step 9, but this time drag
message2.xmland drop it on.../camel-1/Endpoints/file/src/data?noop=true. - In the bottom, right panel, switch from Console to Messages View.
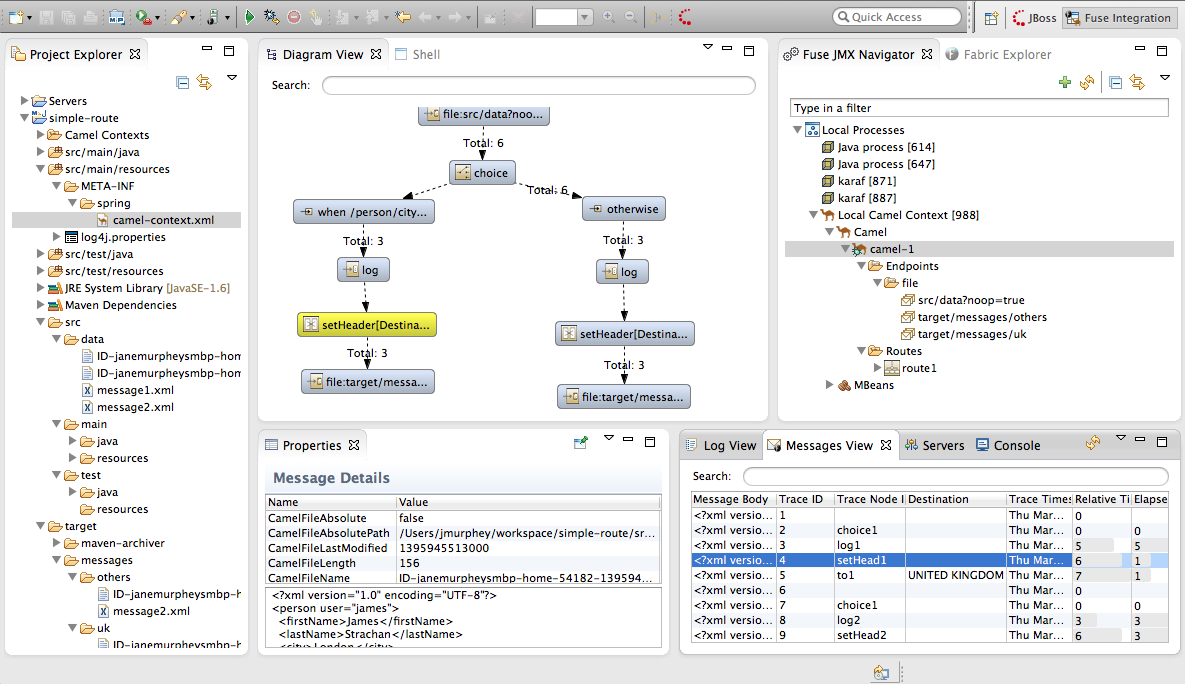
- In Fuse JMX Navigator, click to populate Messages View with the traces of each message.As shown in Figure 4.4, “Fuse Integration perspective's message tracing components”, the tooling draws the route in Diagram View, tagging paths exiting a processing step with timing and performance metrics. Only the metric Total exchanges is displayed in the diagram. Hovering over the displayed metrics reveals additional metrics about message flow:
- mean time the step took to process a message
- maximum time the step took to process a message
- minimum time the step took to process a message
Figure 4.4. Fuse Integration perspective's message tracing components
- In Messages View, click a message instance.The associated step in the route is highlighted in Diagram View. You can step through the message instances to see how a particular message traversed the route and whether it was processed as expected at each step in the route.The tooling displays the details about a message instance in the top half of the Properties panel and the contents of the message instance, including any headers, in the bottom half of the Properties panel. So, if your application sets headers at any step within a route, you can check whether they are set as expected.NoteYou can control columnar layout in all of the tooling's tables. Use the drag method to temporarily rearrange tabular format. For example, drag a column's border rule to expand or contract its width. To hide a column, totally contract its borders. Drag the column header to relocate a column within the table. If you want your arrangement to persist, use the
method instead. To access it, click the  icon on the panel's menu bar.
- When done, switch back to the Console and click the button (
 ) in the upper, right side of its pane.

Next steps
링크 복사링크가 클립보드에 복사되었습니다!
You can run the route with a JUnit test case, as described in Chapter 5, To Test a Route with JUnit.
Further reading
링크 복사링크가 클립보드에 복사되었습니다!
To learn more about message enrichment see:
- the
choice,when, andlogEIPEnterprise Integration Patterns in Red Hat JBoss Fuse: Implementing Enterprise Integration Patterns that comes with Red Hat JBoss Fuse.