이 콘텐츠는 선택한 언어로 제공되지 않습니다.
Chapter 3. Fuse Integration Perspective
Overview
링크 복사링크가 클립보드에 복사되었습니다!
The Fuse Integration perspective, shown in Figure 3.1, provides access to all of the tooling for monitoring and testing your integration application.
Figure 3.1. Fuse Integration perspective
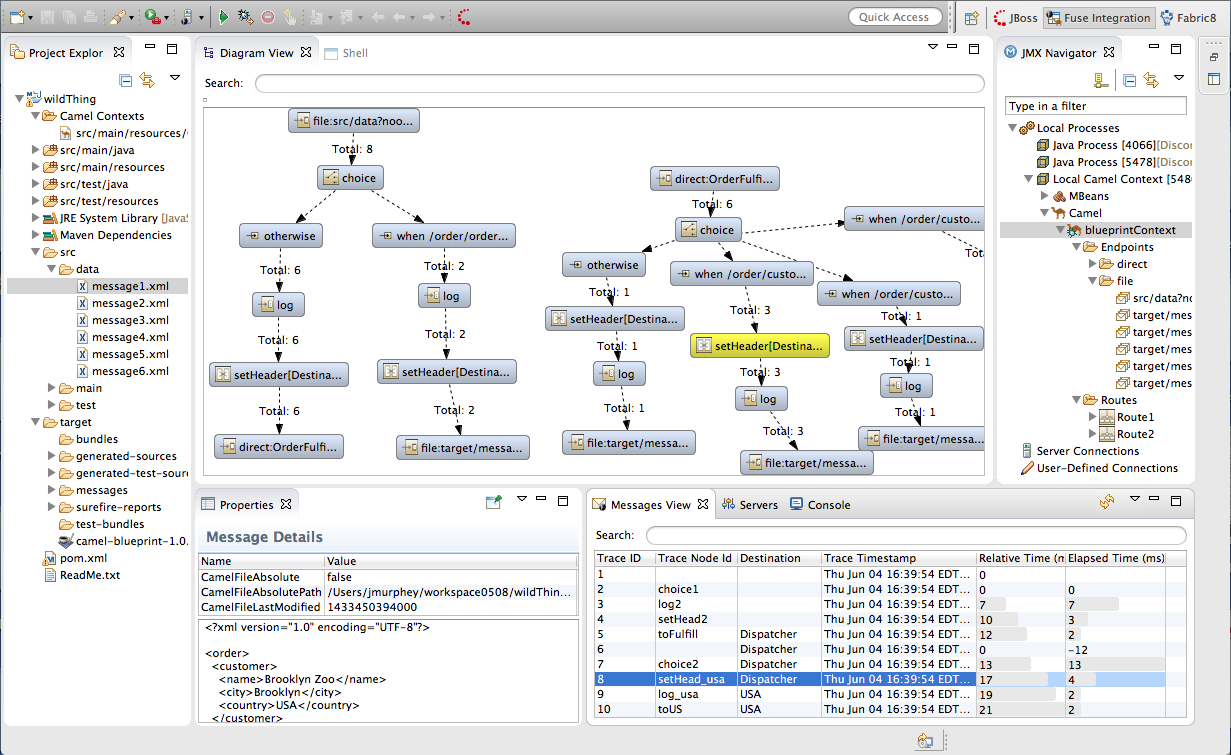
The Fuse Integration perspective consists of eight main areas:
- Project Explorer—displays all of the projects known to the tooling. You can view all of the artifacts that make up each project. Project Explorer also displays all of the routing context
.xml. files for a project under its Camel Contexts node. This makes it easy for you to find and open the routing context file of any route included in a project. - JMX Navigator—lists the JMX servers and the infrastructure they monitor. It allows you to browse JMX servers and the pocesses they are monitoring. It also identifies instances of Red Hat processes.
- Diagram View—displays a graphical tree representing the node selected in JMX Navigator. When you select a process, server, endpoint, or other node, Diagram view shows the selected node as the root and branches down to its children and grandchildren.When you select a broker, Diagram View displays up to three children: connections, topics, and queues. It also shows configured connections and destinations as grandchildren.When you select a route, Diagram view displays all of the nodes in the route and shows the different paths that messages can take through it. It also displays timing metrics for each processing step in the route when route tracing is enabled.
- Shell view—Displays the command console of the connected container. You can control the container by entering commands in Shell view.
- Messages View—lists the messages that have passed through the selected JMS destination or through Apache Camel endpoints when route tracing is enabled.
- Servers view—displays a list of servers (Red Hat JBosss Fuse, Apache Karaf, or Apache ServiceMix) managed by the tooling. It displays their runtime status and provides controls for starting and stopping them and for debugging projects deployed on them.
- Properties view—displays the properties of the selected node.
- Console view— displays the console output for recently executed actions.
JMX Navigator
링크 복사링크가 클립보드에 복사되었습니다!
The JMX Navigator drives all monitoring and testing activities in Fuse Integration perspective. It determines which routes are displayed in Diagram View, the Properties viewer, and Messages View. It is also provides menu commands for activating route tracing, adding and deleting JMS destinations, and starting and suspending routes. It is also the target for dragging and dropping messages onto a route.
By default, JMX Navigator shows all of the Java processes running on your local machine. You can add JMX servers as needed to view infrastructure on other machines.
Messages view
링크 복사링크가 클립보드에 복사되었습니다!
The Messages View is used for browsing JMS destinations and for tracing messages that have passed through a route.
When a JMS destination is selected in JMX Navigator, the view lists all of the messages sitting in the destination.
When route tracing is enabled, Messages View lists all of the messages that passed through the nodes in the route since tracing started. You can configure Messages View to display only the data in which you are interested and in your preferred sequence.
When a message trace in Messages View is selected, its details (message body and all message headers) are displayed in the Properties viewer. In Diagram View, the step in the route associated with the selected message trace is also highlighted.