Fuse 6 is no longer supported
As of February 2025, Red Hat Fuse 6 is no longer supported. If you are using Fuse 6, please upgrade to Red Hat build of Apache Camel.이 콘텐츠는 선택한 언어로 제공되지 않습니다.
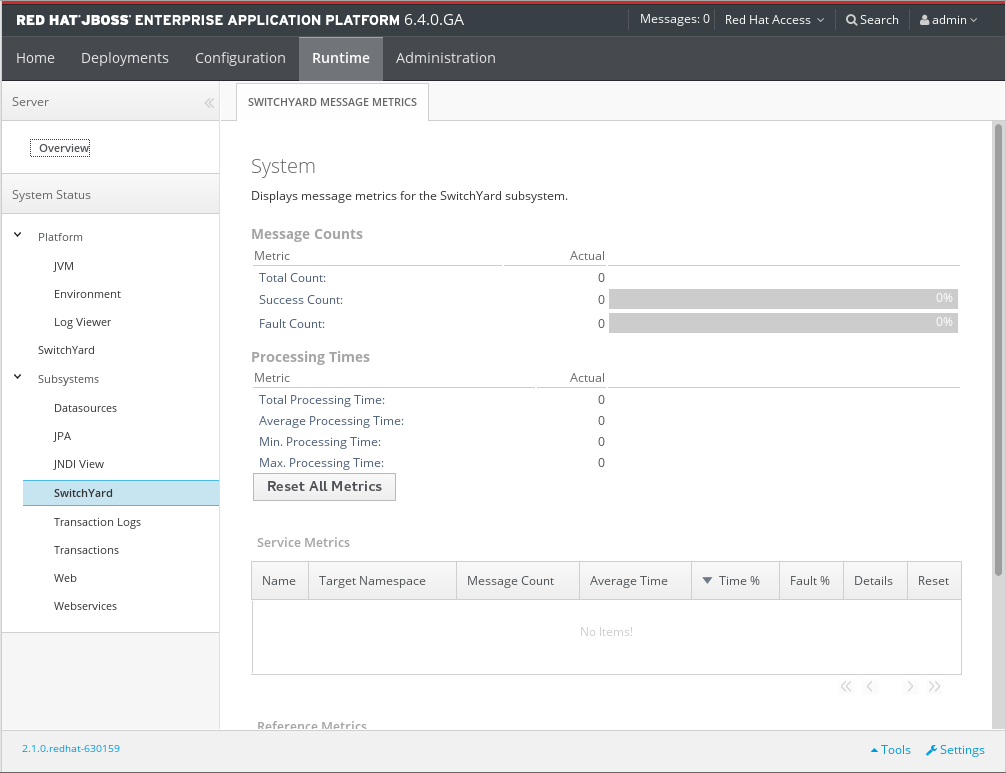
4.2. Metrics Views
SwitchYard Message Metrics can be accessed on the JBoss EAP Management Console via Runtime > Status > Subsystems > SwitchYard . This page provides a view of a comprehensive set of metrics aggregated at specific levels within the system.
Note
These instructions are for Standalone mode. For Domain mode, select the server you want to work on by clicking the Change Server button.
You can view collected metrics at the following levels:
- System : metrics for the entire SwitchYard runtime (all deployed applications)
- Message Counts: This shows the total number of messages, number of successful messages and number of failed messages.
- Processing time: This shows the total, minimum, average and maximum processing times.
- Service : metrics for a composite service in an application. Additional metric details are provided for the following:
- Gateway: metrics for each binding on the service (For example, FTP metrics for service "ABC")
- Operation: metrics for each operation on the service
- Service Reference : metrics for references invoked by the service
- Reference : metrics for a composite reference in an application. Additional metric details are provided for the following:
- Gateway : metrics for each binding on the reference (For example, FTP metrics for reference "ABC")
- Operation : metrics for each operation on the reference
This page also provides the user with the ability to reset metrics.
Figure 4.2. JBoss EAP Management Console SwitchYard Metrics Page