이 콘텐츠는 선택한 언어로 제공되지 않습니다.
Chapter 2. Accessing Prometheus to monitor Fuse applications on OpenShift
2.1. Setting up Prometheus
To set up Prometheus, install the Prometheus operator custom resource definition on the cluster and then add Prometheus to an OpenShift project that includes a Fuse application.
Prerequisites
-
You have
cluster adminaccess to the OpenShift cluster. - You have prepared the OpenShift cluster by installing the Fuse on OpenShift images and templates as described in the Fuse on OpenShift Guide.
- You have created an OpenShift project on the cluster and added a Fuse application to it.
Procedure
Login to OpenShift with administrator permissions:
$ oc login -u system:adminInstall the custom resource definitions necessary for running the Prometheus operator, where
{$templates-base-url}is the location of the Fuse on OpenShift template files:$ oc create -f {$templates-base-url}\fuse-prometheus-crd.ymlThe Prometheus operator is now available to any namespace on the cluster.
Install the Prometheus operator to your namespace by using the following command syntax:
$ oc process -f {$templates-base-url}/fuse-prometheus-operator.yml -p NAMESPACE=<YOUR NAMESPACE> | oc create -f -For example, use this command for a project (namespace) named myproject:
oc process -f {$templates-base-url}/fuse-prometheus-operator.yml -p NAMESPACE=myproject | oc create -f -NoteThe first time that you install the Prometheus operator into a namespace, it might take a few minutes for the Prometheus resource pods to start. Subsequently, if you install it to other namespaces on your cluster, the Prometheus resource pods start much faster.
Instruct the Prometheus operator to monitor the Fuse application in the project by using the following command syntax::
$ oc process -f {$templates-base-url}/fuse-servicemonitor.yml -p NAMESPACE=<YOUR NAMESPACE> -p FUSE_SERVICE_NAME=<YOUR FUSE SERVICE> | oc apply -f -For example, use this command for an OpenShift project (namespace) named myproject that includes a Fuse application named myfuseapp:
oc process -f {$templates-base-url}/fuse-servicemonitor.yml -p NAMESPACE=myproject -p FUSE_SERVICE_NAME=myfuseapp | oc apply -f -To open the Prometheus dashboard:
- Login to the OpenShift console.
- Open the project to which you added Prometheus.
In the left pane, select Applications
Routes. 
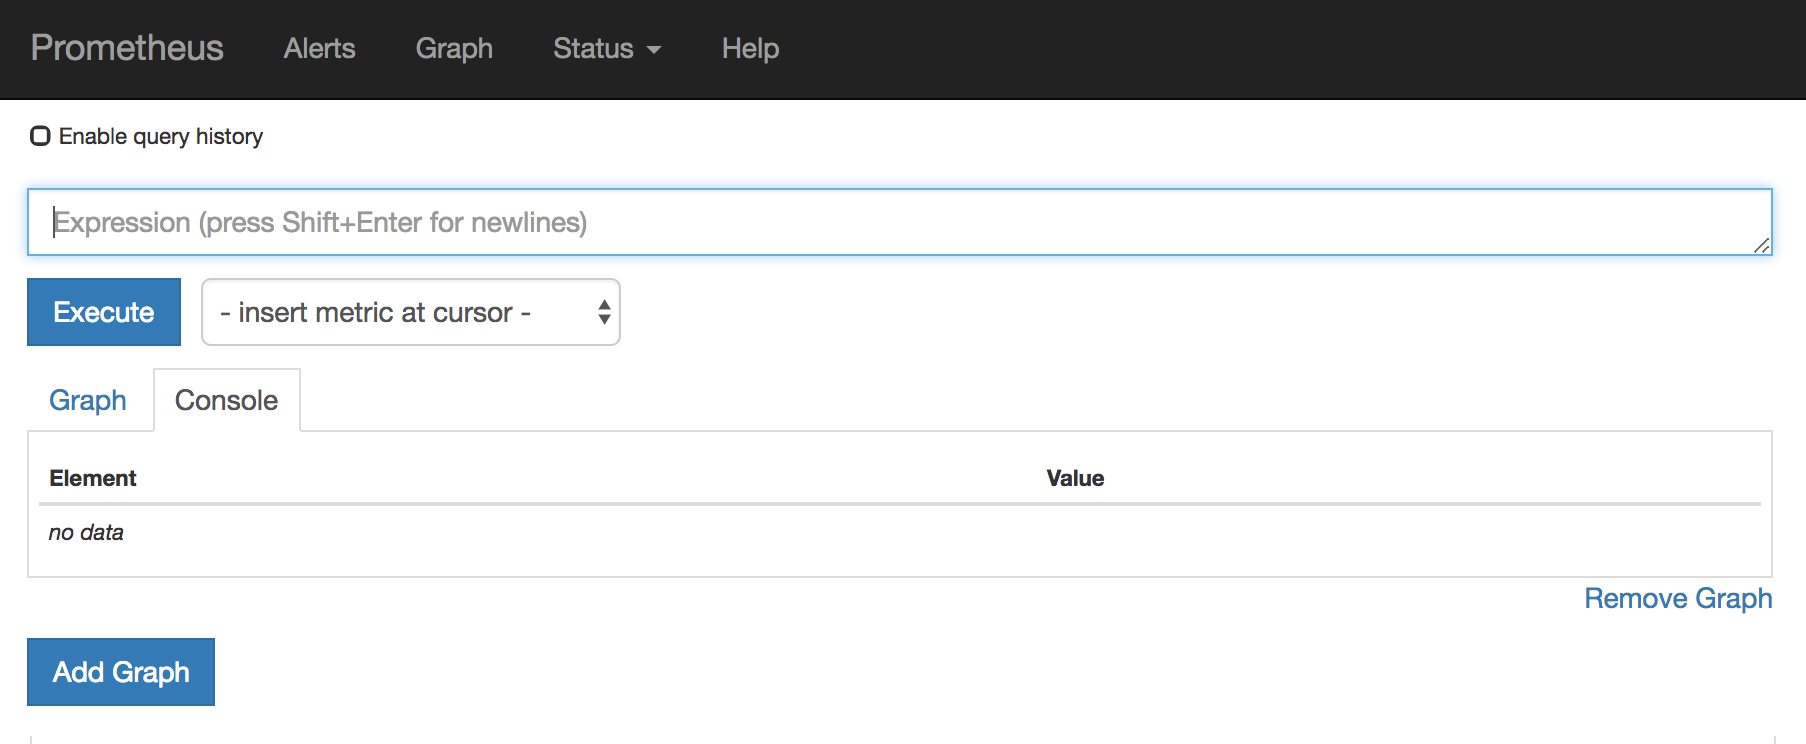
Click the Prometheus Hostname URL to open the Prometheus dashboard in a new browser tab or window.
- For information about getting started with Prometheus, go to: https://prometheus.io/docs/prometheus/latest/getting_started/
2.2. OpenShift environment variables
To configure your application’s Prometheus instance, you can set the OpenShift environment variables listed in Table 2.1, “Prometheus Environment Variables”.
| Environment Variable | Description | Default |
|---|---|---|
|
| The host address to bind. |
|
|
| If set, disables the activation of Prometheus (echoes an empty value). | Prometheus is enabled. |
|
| The Port to use. |
|
|
| Uses the file (including path) as the Prometheus configuration file. | The /opt/prometheus/prometheus-config.yml file with Camel metrics. |
|
| Additional options to append to the JMX exporter configuration. | Not applicable. |
Additional resources
For information on setting environment variables for a pod, see the OpenShift Developer Guide (https://access.redhat.com/documentation/en-us/openshift_container_platform/3.11/html/developer_guide/).
2.3. Controlling the metrics that Prometheus monitors and collects
By default, Prometheus uses a configuration file ( https://raw.githubusercontent.com/jboss-fuse/application-templates/master/prometheus/prometheus-config.yml) that includes all possible metrics exposed by Camel.
If you have custom metrics within your application that you want Prometheus to monitor and collect (for example, the number of orders that your application processes), you can use your own configuration file. Note that the metrics that you can identify are limited to those supplied in JMX.
Procedure
To use a custom configuration file to expose JMX beans that are not covered by the default Prometheus configuration, follow these steps:
Create a custom Prometheus configuration file. You can use the contents of the default file (
prometheus-config.ymlhttps://raw.githubusercontent.com/jboss-fuse/application-templates/master/prometheus/prometheus-config.yml) as a guide for the format.You can use any name for the custom configuration file, for example:
my-prometheus-config.yml.-
Add your prometheus configuration file (for example,
my-prometheus-config.yml) to your application’ssrc/main/fabric8-includesdirectory. Create a
src/main/fabric8/deployment.xmlfile within your application and add an entry for the AB_JMX_EXPORTER_CONFIG environment variable with its value set to your configuration file. For example:spec: template: spec: containers: - resources: requests: cpu: "0.2" limits: cpu: "1.0" env: - name: SPRING_APPLICATION_JSON value: '{"server":{"tomcat":{"max-threads":1}}}' - name: AB_JMX_EXPORTER_CONFIG value: "my-prometheus-config.yml"This environment variable applies to your application at the pod level.
- Rebuild and deploy your application.
2.4. Generating alerts
For an example of using Prometheus for OpenShift to generate alerts, see the Red Hat Cloud Forms Monitoring, Alerts, and Reporting guide: