Este conteúdo não está disponível no idioma selecionado.
Chapter 4. Network Observability Operator in OpenShift Container Platform
Network Observability is an OpenShift operator that deploys a monitoring pipeline to collect and enrich network traffic flows that are produced by the Network Observability eBPF agent.
4.1. Viewing statuses
The Network Observability Operator provides the Flow Collector API. When a Flow Collector resource is created, it deploys pods and services to create and store network flows in the Loki log store, as well as to display dashboards, metrics, and flows in the OpenShift Container Platform web console.
Procedure
Run the following command to view the state of
FlowCollector:$ oc get flowcollector/clusterExample output
NAME      AGENT   SAMPLING (EBPF)   DEPLOYMENT MODEL   STATUS
cluster   EBPF    50                DIRECT             Ready
Check the status of pods running in the
netobservnamespace by entering the following command:$ oc get pods -n netobservExample output
NAME                              READY   STATUS    RESTARTS   AGE
flowlogs-pipeline-56hbp           1/1     Running   0          147m
flowlogs-pipeline-9plvv           1/1     Running   0          147m
flowlogs-pipeline-h5gkb           1/1     Running   0          147m
flowlogs-pipeline-hh6kf           1/1     Running   0          147m
flowlogs-pipeline-w7vv5           1/1     Running   0          147m
netobserv-plugin-cdd7dc6c-j8ggp   1/1     Running   0          147m
flowlogs-pipeline pods collect flows, enriches the collected flows, then send flows to the Loki storage. netobserv-plugin pods create a visualization plugin for the OpenShift Container Platform Console.
Check the status of pods running in the namespace
netobserv-privilegedby entering the following command:$ oc get pods -n netobserv-privilegedExample output
NAME                         READY   STATUS    RESTARTS   AGE
netobserv-ebpf-agent-4lpp6   1/1     Running   0          151m
netobserv-ebpf-agent-6gbrk   1/1     Running   0          151m
netobserv-ebpf-agent-klpl9   1/1     Running   0          151m
netobserv-ebpf-agent-vrcnf   1/1     Running   0          151m
netobserv-ebpf-agent-xf5jh   1/1     Running   0          151m
netobserv-ebpf-agent pods monitor network interfaces of the nodes to get flows and send them to flowlogs-pipeline pods.
If you are using the Loki Operator, check the status of pods running in the
openshift-operators-redhatnamespace by entering the following command:$ oc get pods -n openshift-operators-redhatExample output
NAME                                                READY   STATUS    RESTARTS   AGE
loki-operator-controller-manager-5f6cff4f9d-jq25h   2/2     Running   0          18h
lokistack-compactor-0                               1/1     Running   0          18h
lokistack-distributor-654f87c5bc-qhkhv              1/1     Running   0          18h
lokistack-distributor-654f87c5bc-skxgm              1/1     Running   0          18h
lokistack-gateway-796dc6ff7-c54gz                   2/2     Running   0          18h
lokistack-index-gateway-0                           1/1     Running   0          18h
lokistack-index-gateway-1                           1/1     Running   0          18h
lokistack-ingester-0                                1/1     Running   0          18h
lokistack-ingester-1                                1/1     Running   0          18h
lokistack-ingester-2                                1/1     Running   0          18h
lokistack-querier-66747dc666-6vh5x                  1/1     Running   0          18h
lokistack-querier-66747dc666-cjr45                  1/1     Running   0          18h
lokistack-querier-66747dc666-xh8rq                  1/1     Running   0          18h
lokistack-query-frontend-85c6db4fbd-b2xfb           1/1     Running   0          18h
lokistack-query-frontend-85c6db4fbd-jm94f           1/1     Running   0          18h
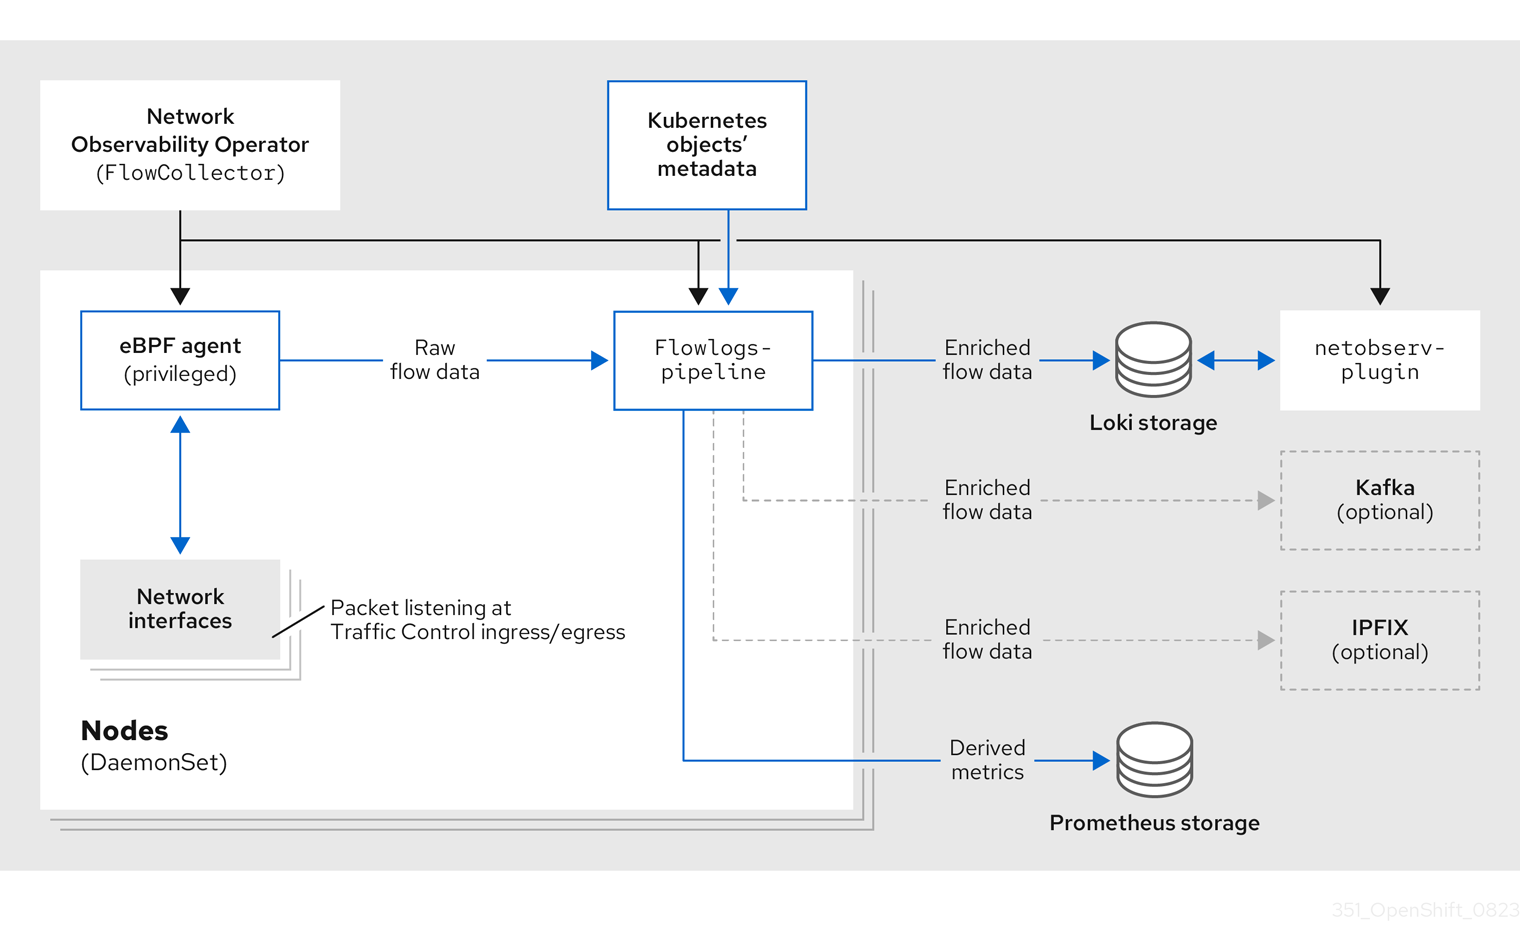
4.2. Network Observablity Operator architecture
The Network Observability Operator provides the FlowCollector API, which is instantiated at installation and configured to reconcile the eBPF agent, the flowlogs-pipeline, and the netobserv-plugin components. Only a single FlowCollector per cluster is supported.
The eBPF agent runs on each cluster node with some privileges to collect network flows. The flowlogs-pipeline receives the network flows data and enriches the data with Kubernetes identifiers. If you are using Loki, the flowlogs-pipeline sends flow logs data to Loki for storing and indexing. The netobserv-plugin, which is a dynamic OpenShift Container Platform web console plugin, queries Loki to fetch network flows data. Cluster-admins can view the data in the web console.
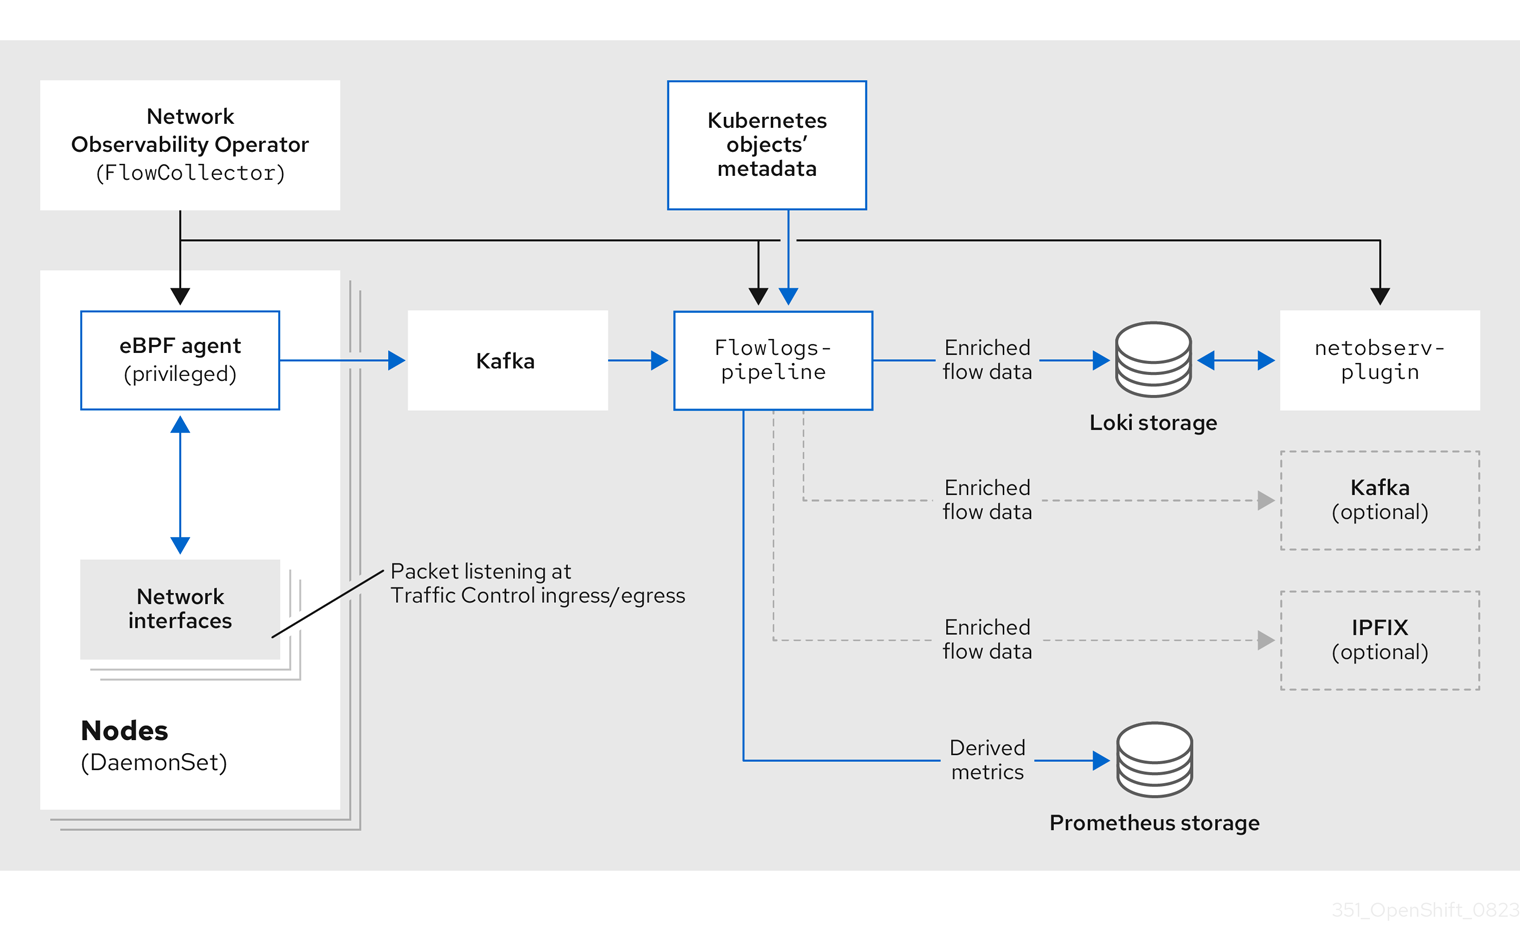
If you are using the Kafka option, the eBPF agent sends the network flow data to Kafka, and the flowlogs-pipeline reads from the Kafka topic before sending to Loki, as shown in the following diagram.
4.3. Viewing Network Observability Operator status and configuration
You can inspect the status and view the details of the FlowCollector using the oc describe command.
Procedure
Run the following command to view the status and configuration of the Network Observability Operator:
$ oc describe flowcollector/cluster