Este conteúdo não está disponível no idioma selecionado.
Chapter 1. About OpenShift Container Platform monitoring
1.1. About OpenShift Container Platform monitoring
OpenShift Container Platform includes a preconfigured, preinstalled, and self-updating monitoring stack that provides monitoring for core platform components. You also have the option to enable monitoring for user-defined projects.
A cluster administrator can configure the monitoring stack with the supported configurations. OpenShift Container Platform delivers monitoring best practices out of the box.
A set of alerts are included by default that immediately notify administrators about issues with a cluster. Default dashboards in the OpenShift Container Platform web console include visual representations of cluster metrics to help you to quickly understand the state of your cluster. With the OpenShift Container Platform web console, you can access metrics and manage alerts.
After installing OpenShift Container Platform, cluster administrators can optionally enable monitoring for user-defined projects. By using this feature, cluster administrators, developers, and other users can specify how services and pods are monitored in their own projects. As a cluster administrator, you can find answers to common problems such as user metrics unavailability and high consumption of disk space by Prometheus in Troubleshooting monitoring issues.
1.2. Monitoring stack architecture
The OpenShift Container Platform monitoring stack is based on the Prometheus open source project and its wider ecosystem. You can learn about the monitoring stack architecture, which includes default monitoring components and components for monitoring user-defined projects.
1.2.1. Understanding the monitoring stack
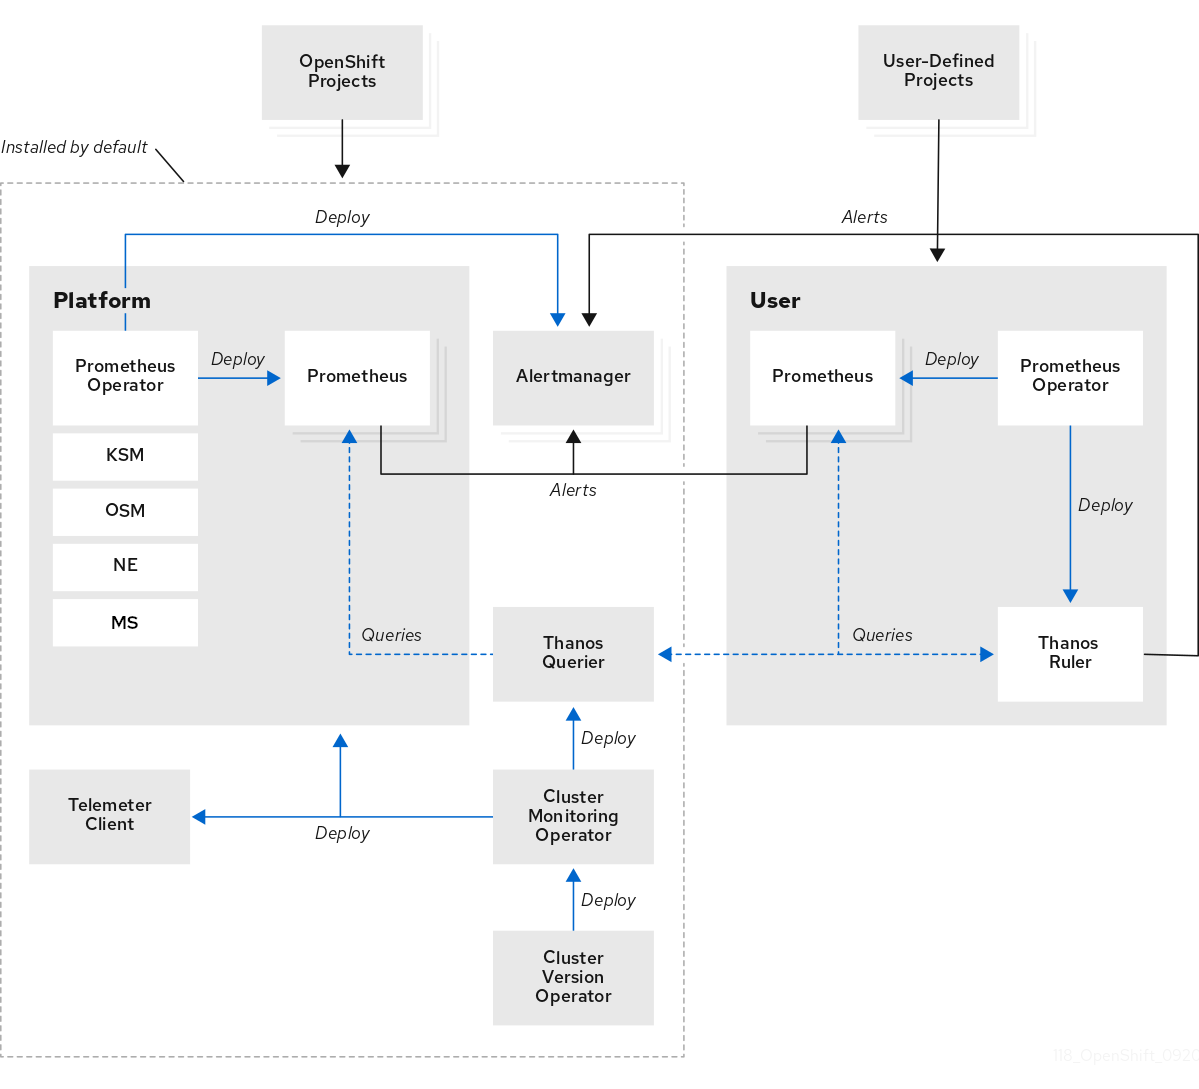
The monitoring stack includes the following components:
- Default platform monitoring components
A set of platform monitoring components are installed in the
openshift-monitoringproject by default during an OpenShift Container Platform installation. This provides monitoring for core cluster components including Kubernetes services. The default monitoring stack also enables remote health monitoring for clusters.You can see these components in the Installed by default section in the following diagram.
- Components for monitoring user-defined projects
If you enable monitoring for user-defined projects, additional monitoring components are installed in the
openshift-user-workload-monitoringproject. This provides optional monitoring for user-defined projects.You can see these components in the User section in the following diagram.
1.2.2. Default monitoring components
By default, the OpenShift Container Platform 4.17 monitoring stack includes the following components:
| Component | Description |
|---|---|
| Cluster Monitoring Operator | The Cluster Monitoring Operator (CMO) is a central component of the monitoring stack. It deploys, manages, and automatically updates Prometheus and Alertmanager instances, Thanos Querier, Telemeter Client, and metrics targets. The CMO is deployed by the Cluster Version Operator (CVO). |
| Prometheus Operator |
The Prometheus Operator in the |
| Prometheus | The OpenShift Container Platform monitoring stack is based on the Prometheus monitoring system. Prometheus is a time-series database and a rule evaluation engine for metrics. Prometheus sends alerts to Alertmanager for processing. |
| Metrics Server |
The Metrics Server component (MS in the preceding diagram) collects resource metrics and exposes them in the |
| Alertmanager | The Alertmanager service handles alerts received from Prometheus. Alertmanager is also responsible for sending the alerts to external notification systems. |
| kube-state-metrics agent | The kube-state-metrics exporter agent (KSM in the preceding diagram) converts Kubernetes objects to metrics that Prometheus can use. |
| monitoring-plugin | The monitoring-plugin dynamic plugin component deploys the monitoring pages in the Observe section of the OpenShift Container Platform web console. You can use Cluster Monitoring Operator config map settings to manage monitoring-plugin resources for the web console pages. |
| openshift-state-metrics agent | The openshift-state-metrics exporter (OSM in the preceding diagram) expands upon kube-state-metrics by adding metrics for OpenShift Container Platform-specific resources. |
| node-exporter agent | The node-exporter agent (NE in the preceding diagram) collects metrics about every node in a cluster. The node-exporter agent is deployed on every node. |
| Thanos Querier | Thanos Querier aggregates and optionally deduplicates core OpenShift Container Platform metrics and metrics for user-defined projects under a single, multi-tenant interface. |
| Telemeter Client | Telemeter Client sends a subsection of the data from platform Prometheus instances to Red Hat to enable remote health monitoring for clusters. |
The monitoring stack monitors all components within the stack. The components are automatically updated when OpenShift Container Platform is updated.
1.2.2.1. Default monitoring targets
In addition to the components of the stack itself, the default monitoring stack monitors additional platform components.
The following are examples of monitoring targets:
- CoreDNS
- etcd
- HAProxy
- Image registry
- Kubelets
- Kubernetes API server
- Kubernetes controller manager
- Kubernetes scheduler
- OpenShift API server
- OpenShift Controller Manager
- Operator Lifecycle Manager (OLM)
- The exact list of targets can vary depending on your cluster capabilities and installed components.
- Each OpenShift Container Platform component is responsible for its monitoring configuration. For problems with the monitoring of an OpenShift Container Platform component, open a Jira issue against that component, not against the general monitoring component.
Other OpenShift Container Platform framework components might be exposing metrics as well. For details, see their respective documentation.
1.2.3. Components for monitoring user-defined projects
OpenShift Container Platform includes an optional enhancement to the monitoring stack that helps you monitor services and pods in user-defined projects. This feature includes the following components:
| Component | Description |
|---|---|
| Prometheus Operator |
The Prometheus Operator in the |
| Prometheus | Prometheus is the monitoring system that provides monitoring for user-defined projects. Prometheus sends alerts to Alertmanager for processing. |
| Thanos Ruler | The Thanos Ruler is a rule evaluation engine for Prometheus that is deployed as a separate process. In OpenShift Container Platform , Thanos Ruler provides rule and alerting evaluation for the monitoring of user-defined projects. |
| Alertmanager | The Alertmanager service handles alerts received from Prometheus and Thanos Ruler. Alertmanager is also responsible for sending user-defined alerts to external notification systems. Deploying this service is optional. |
The components in the preceding table are deployed after you enable monitoring for user-defined projects.
The monitoring stack monitors all components for user-defined projects. The components are automatically updated when OpenShift Container Platform is updated.
1.2.3.1. Monitoring targets for user-defined projects
When monitoring is enabled for user-defined projects, you can monitor:
- Metrics provided through service endpoints in user-defined projects.
- Pods running in user-defined projects.
1.2.4. The monitoring stack in high-availability clusters
By default, in multi-node clusters, the following components run in high-availability (HA) mode to prevent data loss and service interruption:
- Prometheus
- Alertmanager
- Thanos Ruler
- Thanos Querier
- Metrics Server
- Monitoring plugin
The component is replicated across two pods, each running on a separate node. This means that the monitoring stack can tolerate the loss of one pod.
- Prometheus in HA mode
- Both replicas independently scrape the same targets and evaluate the same rules.
- The replicas do not communicate with each other. Therefore, data might differ between the pods.
- Alertmanager in HA mode
- The two replicas synchronize notification and silence states with each other. This ensures that each notification is sent at least once.
- If the replicas fail to communicate or if there is an issue on the receiving side, notifications are still sent, but they might be duplicated.
Prometheus, Alertmanager, and Thanos Ruler are stateful components. To ensure high availability, you must configure them with persistent storage.
1.2.5. TLS security and rotation in the monitoring stack
Learn how TLS profiles and certificate rotation work in the OpenShift Container Platform monitoring stack to keep communication secure.
- TLS security profiles for monitoring components
-
All components of the monitoring stack use the TLS security profile settings that are centrally configured by a cluster administrator. The monitoring stack component uses the TLS security profile settings that already exist in the
tlsSecurityProfilefield in the global OpenShift Container Platformapiservers.config.openshift.io/clusterresource. - TLS certificate rotation and automatic restarts
The Cluster Monitoring Operator manages the internal TLS certificate lifecycle for the monitoring components. These certificates secure the internal communication between the monitoring components.
During certificate rotation, the CMO updates secrets and config maps, which triggers automatic restarts of affected pods. This is an expected behavior, and the pods recover automatically.
The following example shows events that occur during certificate rotation:
Copy to Clipboard Copied! Toggle word wrap Toggle overflow
1.2.6. Glossary of common terms for OpenShift Container Platform monitoring
This glossary defines common terms that are used in OpenShift Container Platform architecture.
- Alertmanager
- Alertmanager handles alerts received from Prometheus. Alertmanager is also responsible for sending the alerts to external notification systems.
- Alerting rules
- Alerting rules contain a set of conditions that outline a particular state within a cluster. Alerts are triggered when those conditions are true. An alerting rule can be assigned a severity that defines how the alerts are routed.
- Cluster Monitoring Operator
- The Cluster Monitoring Operator (CMO) is a central component of the monitoring stack. It deploys and manages Prometheus instances such as, the Thanos Querier, the Telemeter Client, and metrics targets to ensure that they are up to date. The CMO is deployed by the Cluster Version Operator (CVO).
- Cluster Version Operator
- The Cluster Version Operator (CVO) manages the lifecycle of cluster Operators, many of which are installed in OpenShift Container Platform by default.
- config map
-
A config map provides a way to inject configuration data into pods. You can reference the data stored in a config map in a volume of type
ConfigMap. Applications running in a pod can use this data. - Container
- A container is a lightweight and executable image that includes software and all its dependencies. Containers virtualize the operating system. As a result, you can run containers anywhere from a data center to a public or private cloud as well as a developer’s laptop.
- custom resource (CR)
- A CR is an extension of the Kubernetes API. You can create custom resources.
- etcd
- etcd is the key-value store for OpenShift Container Platform, which stores the state of all resource objects.
- Fluentd
Fluentd is a log collector that resides on each OpenShift Container Platform node. It gathers application, infrastructure, and audit logs and forwards them to different outputs.
NoteFluentd is deprecated and is planned to be removed in a future release. Red Hat provides bug fixes and support for this feature during the current release lifecycle, but this feature no longer receives enhancements. As an alternative to Fluentd, you can use Vector instead.
- Kubelets
- Runs on nodes and reads the container manifests. Ensures that the defined containers have started and are running.
- Kubernetes API server
- Kubernetes API server validates and configures data for the API objects.
- Kubernetes controller manager
- Kubernetes controller manager governs the state of the cluster.
- Kubernetes scheduler
- Kubernetes scheduler allocates pods to nodes.
- labels
- Labels are key-value pairs that you can use to organize and select subsets of objects such as a pod.
- Metrics Server
-
The Metrics Server monitoring component collects resource metrics and exposes them in the
metrics.k8s.ioMetrics API service for use by other tools and APIs, which frees the core platform Prometheus stack from handling this functionality. - node
- A compute machine in the OpenShift Container Platform cluster. A node is either a virtual machine (VM) or a physical machine.
- Operator
- The preferred method of packaging, deploying, and managing a Kubernetes application in an OpenShift Container Platform cluster. An Operator takes human operational knowledge and encodes it into software that is packaged and shared with customers.
- Operator Lifecycle Manager (OLM)
- OLM helps you install, update, and manage the lifecycle of Kubernetes native applications. OLM is an open source toolkit designed to manage Operators in an effective, automated, and scalable way.
- Persistent storage
- Stores the data even after the device is shut down. Kubernetes uses persistent volumes to store the application data.
- Persistent volume claim (PVC)
- You can use a PVC to mount a PersistentVolume into a Pod. You can access the storage without knowing the details of the cloud environment.
- pod
- The pod is the smallest logical unit in Kubernetes. A pod is comprised of one or more containers to run in a worker node.
- Prometheus
- Prometheus is the monitoring system on which the OpenShift Container Platform monitoring stack is based. Prometheus is a time-series database and a rule evaluation engine for metrics. Prometheus sends alerts to Alertmanager for processing.
- Prometheus Operator
-
The Prometheus Operator in the
openshift-monitoringproject creates, configures, and manages platform Prometheus and Alertmanager instances. It also automatically generates monitoring target configurations based on Kubernetes label queries. - Silences
- A silence can be applied to an alert to prevent notifications from being sent when the conditions for an alert are true. You can mute an alert after the initial notification, while you work on resolving the underlying issue.
- storage
- OpenShift Container Platform supports many types of storage, both for on-premise and cloud providers. You can manage container storage for persistent and non-persistent data in an OpenShift Container Platform cluster.
- Thanos Ruler
- The Thanos Ruler is a rule evaluation engine for Prometheus that is deployed as a separate process. In OpenShift Container Platform, Thanos Ruler provides rule and alerting evaluation for the monitoring of user-defined projects.
- Vector
- Vector is a log collector that deploys to each OpenShift Container Platform node. It collects log data from each node, transforms the data, and forwards it to configured outputs.
- web console
- A user interface (UI) to manage OpenShift Container Platform.
1.3. Understanding the monitoring stack - key concepts
Get familiar with the OpenShift Container Platform monitoring concepts and terms. Learn about how you can improve performance and scale of your cluster, store and record data, manage metrics and alerts, and more.
1.3.1. About performance and scalability
You can optimize the performance and scale of your clusters. You can configure the default monitoring stack by performing any of the following actions:
Control the placement and distribution of monitoring components:
- Use node selectors to move components to specific nodes.
- Assign tolerations to enable moving components to tainted nodes.
- Use pod topology spread constraints.
- Set the body size limit for metrics scraping.
- Manage CPU and memory resources.
- Use metrics collection profiles.
1.3.1.1. Using node selectors to move monitoring components
By using the nodeSelector constraint with labeled nodes, you can move any of the monitoring stack components to specific nodes. By doing so, you can control the placement and distribution of the monitoring components across a cluster.
By controlling placement and distribution of monitoring components, you can optimize system resource use, improve performance, and separate workloads based on specific requirements or policies.
How node selectors work with other constraints
If you move monitoring components by using node selector constraints, be aware that other constraints to control pod scheduling might exist for a cluster:
- Topology spread constraints might be in place to control pod placement.
- Hard anti-affinity rules are in place for Prometheus, Alertmanager, and other monitoring components to ensure that multiple pods for these components are always spread across different nodes and are therefore always highly available.
When scheduling pods onto nodes, the pod scheduler tries to satisfy all existing constraints when determining pod placement. That is, all constraints compound when the pod scheduler determines which pods will be placed on which nodes.
Therefore, if you configure a node selector constraint but existing constraints cannot all be satisfied, the pod scheduler cannot match all constraints and will not schedule a pod for placement onto a node.
To maintain resilience and high availability for monitoring components, ensure that enough nodes are available and match all constraints when you configure a node selector constraint to move a component.
1.3.1.2. About pod topology spread constraints for monitoring
You can use pod topology spread constraints to control how the monitoring pods are spread across a network topology when OpenShift Container Platform pods are deployed in multiple availability zones.
Pod topology spread constraints are suitable for controlling pod scheduling within hierarchical topologies in which nodes are spread across different infrastructure levels, such as regions and zones within those regions. Additionally, by being able to schedule pods in different zones, you can improve network latency in certain scenarios.
You can configure pod topology spread constraints for all the pods deployed by the Cluster Monitoring Operator to control how pod replicas are scheduled to nodes across zones. This ensures that the pods are highly available and run more efficiently, because workloads are spread across nodes in different data centers or hierarchical infrastructure zones.
1.3.1.3. About specifying limits and requests for monitoring components
You can configure resource limits and requests for the following core platform monitoring components:
- Alertmanager
- kube-state-metrics
- monitoring-plugin
- node-exporter
- openshift-state-metrics
- Prometheus
- Metrics Server
- Prometheus Operator and its admission webhook service
- Telemeter Client
- Thanos Querier
You can configure resource limits and requests for the following components that monitor user-defined projects:
- Alertmanager
- Prometheus
- Thanos Ruler
By defining the resource limits, you limit a container’s resource usage, which prevents the container from exceeding the specified maximum values for CPU and memory resources.
By defining the resource requests, you specify that a container can be scheduled only on a node that has enough CPU and memory resources available to match the requested resources.
1.3.1.4. About metrics collection profiles
Metrics collection profile is a Technology Preview feature only. Technology Preview features are not supported with Red Hat production service level agreements (SLAs) and might not be functionally complete. Red Hat does not recommend using them in production. These features provide early access to upcoming product features, enabling customers to test functionality and provide feedback during the development process.
For more information about the support scope of Red Hat Technology Preview features, see Technology Preview Features Support Scope.
By default, Prometheus collects metrics exposed by all default metrics targets in OpenShift Container Platform components. However, you might want Prometheus to collect fewer metrics from a cluster in certain scenarios:
- If cluster administrators require only alert, telemetry, and console metrics and do not require other metrics to be available.
- If a cluster increases in size, and the increased size of the default metrics data collected now requires a significant increase in CPU and memory resources.
You can use a metrics collection profile to collect either the default amount of metrics data or a minimal amount of metrics data. When you collect minimal metrics data, basic monitoring features such as alerting continue to work. At the same time, the CPU and memory resources required by Prometheus decrease.
You can enable one of two metrics collection profiles:
- full: Prometheus collects metrics data exposed by all platform components. This setting is the default.
- minimal: Prometheus collects only the metrics data required for platform alerts, recording rules, telemetry, and console dashboards.
1.3.2. About storing and recording data
You can store and record data to help you protect the data and use them for troubleshooting. You can configure the default monitoring stack by performing any of the following actions:
Configure persistent storage:
- Protect your metrics and alerting data from data loss by storing them in a persistent volume (PV). As a result, they can survive pods being restarted or recreated.
- Avoid getting duplicate notifications and losing silences for alerts when the Alertmanager pods are restarted.
- Modify the retention time and size for Prometheus and Thanos Ruler metrics data.
Configure logging to help you troubleshoot issues with your cluster:
- Configure audit logs for Metrics Server.
- Set log levels for monitoring.
- Enable the query logging for Prometheus and Thanos Querier.
1.3.2.1. Retention time and size for Prometheus metrics
By default, Prometheus retains metrics data for the following durations:
- Core platform monitoring: 15 days
- Monitoring for user-defined projects: 24 hours
You can modify the retention time for the Prometheus instance to change how soon the data is deleted. You can also set the maximum amount of disk space the retained metrics data uses. If the data reaches this size limit, Prometheus deletes the oldest data first until the disk space used is again below the limit.
Note the following behaviors of these data retention settings:
-
The size-based retention policy applies to all data block directories in the
/prometheusdirectory, including persistent blocks, write-ahead log (WAL) data, and m-mapped chunks. -
Data in the
/waland/head_chunksdirectories counts toward the retention size limit, but Prometheus never purges data from these directories based on size- or time-based retention policies. Thus, if you set a retention size limit lower than the maximum size set for the/waland/head_chunksdirectories, you have configured the system not to retain any data blocks in the/prometheusdata directories. - The size-based retention policy is applied only when Prometheus cuts a new data block, which occurs every two hours after the WAL contains at least three hours of data.
-
If you do not explicitly define values for either
retentionorretentionSize, retention time defaults to 15 days for core platform monitoring and 24 hours for user-defined project monitoring. Retention size is not set. -
If you define values for both
retentionandretentionSize, both values apply. If any data blocks exceed the defined retention time or the defined size limit, Prometheus purges these data blocks. -
If you define a value for
retentionSizeand do not defineretention, only theretentionSizevalue applies. -
If you do not define a value for
retentionSizeand only define a value forretention, only theretentionvalue applies. -
If you set the
retentionSizeorretentionvalue to0, the default settings apply. The default settings set retention time to 15 days for core platform monitoring and 24 hours for user-defined project monitoring. By default, retention size is not set.
Data compaction occurs every two hours. Therefore, a persistent volume (PV) might fill up before compaction, potentially exceeding the retentionSize limit. In such cases, the KubePersistentVolumeFillingUp alert fires until the space on a PV is lower than the retentionSize limit.
1.3.3. Understanding metrics
In OpenShift Container Platform 4.17, cluster components are monitored by scraping metrics exposed through service endpoints. You can also configure metrics collection for user-defined projects. Metrics enable you to monitor how cluster components and your own workloads are performing.
You can define the metrics that you want to provide for your own workloads by using Prometheus client libraries at the application level.
In OpenShift Container Platform, metrics are exposed through an HTTP service endpoint under the /metrics canonical name. You can list all available metrics for a service by running a curl query against http://<endpoint>/metrics. For instance, you can expose a route to the prometheus-example-app example application and then run the following to view all of its available metrics:
curl http://<example_app_endpoint>/metrics
$ curl http://<example_app_endpoint>/metricsExample output
1.3.3.1. Controlling the impact of unbound metrics attributes in user-defined projects
Developers can create labels to define attributes for metrics in the form of key-value pairs. The number of potential key-value pairs corresponds to the number of possible values for an attribute. An attribute that has an unlimited number of potential values is called an unbound attribute. For example, a customer_id attribute is unbound because it has an infinite number of possible values.
Every assigned key-value pair has a unique time series. The use of many unbound attributes in labels can result in an exponential increase in the number of time series created. This can impact Prometheus performance and can consume a lot of disk space.
Cluster administrators can use the following measures to control the impact of unbound metrics attributes in user-defined projects:
- Limit the number of samples that can be accepted per target scrape in user-defined projects
- Limit the number of scraped labels, the length of label names, and the length of label values
- Create alerts that fire when a scrape sample threshold is reached or when the target cannot be scraped
Limiting scrape samples can help prevent the issues caused by adding many unbound attributes to labels. Developers can also prevent the underlying cause by limiting the number of unbound attributes that they define for metrics. Using attributes that are bound to a limited set of possible values reduces the number of potential key-value pair combinations.
1.3.3.2. Adding cluster ID labels to metrics
If you manage multiple OpenShift Container Platform clusters and use the remote write feature to send metrics data from these clusters to an external storage location, you can add cluster ID labels to identify the metrics data coming from different clusters. You can then query these labels to identify the source cluster for a metric and distinguish that data from similar metrics data sent by other clusters.
This way, if you manage many clusters for multiple customers and send metrics data to a single centralized storage system, you can use cluster ID labels to query metrics for a particular cluster or customer.
Creating and using cluster ID labels involves three general steps:
- Configuring the write relabel settings for remote write storage.
- Adding cluster ID labels to the metrics.
- Querying these labels to identify the source cluster or customer for a metric.
1.3.4. About monitoring dashboards
OpenShift Container Platform provides a set of monitoring dashboards that help you understand the state of cluster components and user-defined workloads.
1.3.4.1. Monitoring dashboards in the Administrator perspective
Use the Administrator perspective to access dashboards for the core OpenShift Container Platform components, including the following items:
- API performance
- etcd
- Kubernetes compute resources
- Kubernetes network resources
- Prometheus
- USE method dashboards relating to cluster and node performance
- Node performance metrics
Figure 1.1. Example dashboard in the Administrator perspective

1.3.4.2. Monitoring dashboards in the Developer perspective
In the Developer perspective, you can access only the Kubernetes compute resources dashboards:
Figure 1.2. Example dashboard in the Developer perspective

1.3.5. Managing alerts
In the OpenShift Container Platform, the Alerting UI enables you to manage alerts, silences, and alerting rules.
- Alerting rules. Alerting rules contain a set of conditions that outline a particular state within a cluster. Alerts are triggered when those conditions are true. An alerting rule can be assigned a severity that defines how the alerts are routed.
- Alerts. An alert is fired when the conditions defined in an alerting rule are true. Alerts provide a notification that a set of circumstances are apparent within an OpenShift Container Platform cluster.
- Silences. A silence can be applied to an alert to prevent notifications from being sent when the conditions for an alert are true. You can mute an alert after the initial notification, while you work on resolving the issue.
The alerts, silences, and alerting rules that are available in the Alerting UI relate to the projects that you have access to. For example, if you are logged in as a user with the cluster-admin role, you can access all alerts, silences, and alerting rules.
1.3.5.1. Managing silences
You can create a silence for an alert in the OpenShift Container Platform web console in both the Administrator and Developer perspectives. After you create a silence, you will not receive notifications about an alert when the alert fires.
Creating silences is useful in scenarios where you have received an initial alert notification, and you do not want to receive further notifications during the time in which you resolve the underlying issue causing the alert to fire.
When creating a silence, you must specify whether it becomes active immediately or at a later time. You must also set a duration period after which the silence expires.
After you create silences, you can view, edit, and expire them.
When you create silences, they are replicated across Alertmanager pods. However, if you do not configure persistent storage for Alertmanager, silences might be lost. This can happen, for example, if all Alertmanager pods restart at the same time.
1.3.5.2. Managing alerting rules for core platform monitoring
The OpenShift Container Platform monitoring includes a large set of default alerting rules for platform metrics. As a cluster administrator, you can customize this set of rules in two ways:
-
Modify the settings for existing platform alerting rules by adjusting thresholds or by adding and modifying labels. For example, you can change the
severitylabel for an alert fromwarningtocriticalto help you route and triage issues flagged by an alert. -
Define and add new custom alerting rules by constructing a query expression based on core platform metrics in the
openshift-monitoringnamespace.
Core platform alerting rule considerations
- New alerting rules must be based on the default OpenShift Container Platform monitoring metrics.
-
You must create the
AlertingRuleandAlertRelabelConfigobjects in theopenshift-monitoringnamespace. - You can only add and modify alerting rules. You cannot create new recording rules or modify existing recording rules.
-
If you modify existing platform alerting rules by using an
AlertRelabelConfigobject, your modifications are not reflected in the Prometheus alerts API. Therefore, any dropped alerts still appear in the OpenShift Container Platform web console even though they are no longer forwarded to Alertmanager. Additionally, any modifications to alerts, such as a changedseveritylabel, do not appear in the web console.
1.3.5.3. Tips for optimizing alerting rules for core platform monitoring
If you customize core platform alerting rules to meet your organization’s specific needs, follow these guidelines to help ensure that the customized rules are efficient and effective.
- Minimize the number of new rules. Create only rules that are essential to your specific requirements. By minimizing the number of rules, you create a more manageable and focused alerting system in your monitoring environment.
- Focus on symptoms rather than causes. Create rules that notify users of symptoms instead of underlying causes. This approach ensures that users are promptly notified of a relevant symptom so that they can investigate the root cause after an alert has triggered. This tactic also significantly reduces the overall number of rules you need to create.
- Plan and assess your needs before implementing changes. First, decide what symptoms are important and what actions you want users to take if these symptoms occur. Then, assess existing rules and decide if you can modify any of them to meet your needs instead of creating entirely new rules for each symptom. By modifying existing rules and creating new ones judiciously, you help to streamline your alerting system.
- Provide clear alert messaging. When you create alert messages, describe the symptom, possible causes, and recommended actions. Include unambiguous, concise explanations along with troubleshooting steps or links to more information. Doing so helps users quickly assess the situation and respond appropriately.
- Include severity levels. Assign severity levels to your rules to indicate how a user needs to react when a symptom occurs and triggers an alert. For example, classifying an alert as Critical signals that an individual or a critical response team needs to respond immediately. By defining severity levels, you help users know how to respond to an alert and help ensure that the most urgent issues receive prompt attention.
1.3.5.4. About creating alerting rules for user-defined projects
If you create alerting rules for a user-defined project, consider the following key behaviors and important limitations when you define the new rules:
A user-defined alerting rule can include metrics exposed by its own project in addition to the default metrics from core platform monitoring. You cannot include metrics from another user-defined project.
For example, an alerting rule for the
ns1user-defined project can use metrics exposed by thens1project in addition to core platform metrics, such as CPU and memory metrics. However, the rule cannot include metrics from a differentns2user-defined project.To reduce latency and to minimize the load on core platform monitoring components, you can add the
openshift.io/prometheus-rule-evaluation-scope: leaf-prometheuslabel to a rule. This label forces only the Prometheus instance deployed in theopenshift-user-workload-monitoringproject to evaluate the alerting rule and prevents the Thanos Ruler instance from doing so.ImportantIf an alerting rule has this label, your alerting rule can use only those metrics exposed by your user-defined project. Alerting rules you create based on default platform metrics might not trigger alerts.
1.3.5.5. Managing alerting rules for user-defined projects
In OpenShift Container Platform, you can view, edit, and remove alerting rules in user-defined projects.
Alerting rule considerations
- The default alerting rules are used specifically for the OpenShift Container Platform cluster.
- Some alerting rules intentionally have identical names. They send alerts about the same event with different thresholds, different severity, or both.
- Inhibition rules prevent notifications for lower severity alerts that are firing when a higher severity alert is also firing.
1.3.5.6. Optimizing alerting for user-defined projects
You can optimize alerting for your own projects by considering the following recommendations when creating alerting rules:
- Minimize the number of alerting rules that you create for your project. Create alerting rules that notify you of conditions that impact you. It is more difficult to notice relevant alerts if you generate many alerts for conditions that do not impact you.
- Create alerting rules for symptoms instead of causes. Create alerting rules that notify you of conditions regardless of the underlying cause. The cause can then be investigated. You will need many more alerting rules if each relates only to a specific cause. Some causes are then likely to be missed.
- Plan before you write your alerting rules. Determine what symptoms are important to you and what actions you want to take if they occur. Then build an alerting rule for each symptom.
- Provide clear alert messaging. State the symptom and recommended actions in the alert message.
- Include severity levels in your alerting rules. The severity of an alert depends on how you need to react if the reported symptom occurs. For example, a critical alert should be triggered if a symptom requires immediate attention by an individual or a critical response team.
1.3.5.7. Searching and filtering alerts, silences, and alerting rules
You can filter the alerts, silences, and alerting rules that are displayed in the Alerting UI. This section provides a description of each of the available filtering options.
1.3.5.7.1. Understanding alert filters
In the Administrator perspective, the Alerts page in the Alerting UI provides details about alerts relating to default OpenShift Container Platform and user-defined projects. The page includes a summary of severity, state, and source for each alert. The time at which an alert went into its current state is also shown.
You can filter by alert state, severity, and source. By default, only Platform alerts that are Firing are displayed. The following describes each alert filtering option:
State filters:
-
Firing. The alert is firing because the alert condition is true and the optional
forduration has passed. The alert continues to fire while the condition remains true. - Pending. The alert is active but is waiting for the duration that is specified in the alerting rule before it fires.
- Silenced. The alert is now silenced for a defined time period. Silences temporarily mute alerts based on a set of label selectors that you define. Notifications are not sent for alerts that match all the listed values or regular expressions.
-
Firing. The alert is firing because the alert condition is true and the optional
Severity filters:
- Critical. The condition that triggered the alert could have a critical impact. The alert requires immediate attention when fired and is typically paged to an individual or to a critical response team.
- Warning. The alert provides a warning notification about something that might require attention to prevent a problem from occurring. Warnings are typically routed to a ticketing system for non-immediate review.
- Info. The alert is provided for informational purposes only.
- None. The alert has no defined severity.
- You can also create custom severity definitions for alerts relating to user-defined projects.
Source filters:
- Platform. Platform-level alerts relate only to default OpenShift Container Platform projects. These projects provide core OpenShift Container Platform functionality.
- User. User alerts relate to user-defined projects. These alerts are user-created and are customizable. User-defined workload monitoring can be enabled postinstallation to provide observability into your own workloads.
1.3.5.7.2. Understanding silence filters
In the Administrator perspective, the Silences page in the Alerting UI provides details about silences applied to alerts in default OpenShift Container Platform and user-defined projects. The page includes a summary of the state of each silence and the time at which a silence ends.
You can filter by silence state. By default, only Active and Pending silences are displayed. The following describes each silence state filter option:
State filters:
- Active. The silence is active and the alert will be muted until the silence is expired.
- Pending. The silence has been scheduled and it is not yet active.
- Expired. The silence has expired and notifications will be sent if the conditions for an alert are true.
1.3.5.7.3. Understanding alerting rule filters
In the Administrator perspective, the Alerting rules page in the Alerting UI provides details about alerting rules relating to default OpenShift Container Platform and user-defined projects. The page includes a summary of the state, severity, and source for each alerting rule.
You can filter alerting rules by alert state, severity, and source. By default, only Platform alerting rules are displayed. The following describes each alerting rule filtering option:
Alert state filters:
-
Firing. The alert is firing because the alert condition is true and the optional
forduration has passed. The alert continues to fire while the condition remains true. - Pending. The alert is active but is waiting for the duration that is specified in the alerting rule before it fires.
- Silenced. The alert is now silenced for a defined time period. Silences temporarily mute alerts based on a set of label selectors that you define. Notifications are not sent for alerts that match all the listed values or regular expressions.
- Not Firing. The alert is not firing.
-
Firing. The alert is firing because the alert condition is true and the optional
Severity filters:
- Critical. The conditions defined in the alerting rule could have a critical impact. When true, these conditions require immediate attention. Alerts relating to the rule are typically paged to an individual or to a critical response team.
- Warning. The conditions defined in the alerting rule might require attention to prevent a problem from occurring. Alerts relating to the rule are typically routed to a ticketing system for non-immediate review.
- Info. The alerting rule provides informational alerts only.
- None. The alerting rule has no defined severity.
- You can also create custom severity definitions for alerting rules relating to user-defined projects.
Source filters:
- Platform. Platform-level alerting rules relate only to default OpenShift Container Platform projects. These projects provide core OpenShift Container Platform functionality.
- User. User-defined workload alerting rules relate to user-defined projects. These alerting rules are user-created and are customizable. User-defined workload monitoring can be enabled postinstallation to provide observability into your own workloads.
1.3.5.7.4. Searching and filtering alerts, silences, and alerting rules in the Developer perspective
In the Developer perspective, the Alerts page in the Alerting UI provides a combined view of alerts and silences relating to the selected project. A link to the governing alerting rule is provided for each displayed alert.
In this view, you can filter by alert state and severity. By default, all alerts in the selected project are displayed if you have permission to access the project. These filters are the same as those described for the Administrator perspective.
1.3.6. Understanding alert routing for user-defined projects
As a cluster administrator, you can enable alert routing for user-defined projects. With this feature, you can allow users with the alert-routing-edit cluster role to configure alert notification routing and receivers for user-defined projects. These notifications are routed by the default Alertmanager instance or, if enabled, an optional Alertmanager instance dedicated to user-defined monitoring.
Users can then create and configure user-defined alert routing by creating or editing the AlertmanagerConfig objects for their user-defined projects without the help of an administrator.
After a user has defined alert routing for a user-defined project, user-defined alert notifications are routed as follows:
-
To the
alertmanager-mainpods in theopenshift-monitoringnamespace if using the default platform Alertmanager instance. -
To the
alertmanager-user-workloadpods in theopenshift-user-workload-monitoringnamespace if you have enabled a separate instance of Alertmanager for user-defined projects.
Review the following limitations of alert routing for user-defined projects:
-
For user-defined alerting rules, user-defined routing is scoped to the namespace in which the resource is defined. For example, a routing configuration in namespace
ns1only applies toPrometheusRulesresources in the same namespace. -
When a namespace is excluded from user-defined monitoring,
AlertmanagerConfigresources in the namespace cease to be part of the Alertmanager configuration.
1.3.7. Sending notifications to external systems
In OpenShift Container Platform 4.17, firing alerts can be viewed in the Alerting UI. Alerts are not configured by default to be sent to any notification systems. You can configure OpenShift Container Platform to send alerts to the following receiver types:
- PagerDuty
- Webhook
- Slack
- Microsoft Teams
Routing alerts to receivers enables you to send timely notifications to the appropriate teams when failures occur. For example, critical alerts require immediate attention and are typically paged to an individual or a critical response team. Alerts that provide non-critical warning notifications might instead be routed to a ticketing system for non-immediate review.
Checking that alerting is operational by using the watchdog alert
OpenShift Container Platform monitoring includes a watchdog alert that fires continuously. Alertmanager repeatedly sends watchdog alert notifications to configured notification providers. The provider is usually configured to notify an administrator when it stops receiving the watchdog alert. This mechanism helps you quickly identify any communication issues between Alertmanager and the notification provider.