Este conteúdo não está disponível no idioma selecionado.
Chapter 13. Prometheus metrics monitoring in Red Hat Decision Manager
Prometheus is an open-source systems monitoring toolkit that you can use with Red Hat Decision Manager to collect and store metrics related to the execution of business rules, processes, Decision Model and Notation (DMN) models, and other Red Hat Decision Manager assets. You can access the stored metrics through a REST API call to the Decision Server, through the Prometheus expression browser, or using a data-graphing tool such as Grafana.
You can configure Prometheus metrics monitoring for an on-premise Decision Server instance, for Decision Server on Spring Boot, or for a Decision Server deployment on Red Hat OpenShift Container Platform.
For the list of available metrics that Decision Server exposes with Prometheus, download the Red Hat Decision Manager 7.5.1 Source Distribution from the Red Hat Customer Portal and navigate to ~/rhdm-7.5.1-sources/src/droolsjbpm-integration-$VERSION/kie-server-parent/kie-server-services/kie-server-services-prometheus/src/main/java/org/kie/server/services/prometheus.
Red Hat support for Prometheus is limited to the setup and configuration recommendations provided in Red Hat product documentation.
13.1. Configuring Prometheus metrics monitoring for Decision Server
You can configure your Decision Server instances to use Prometheus to collect and store metrics related to your business asset activity in Red Hat Decision Manager. For the list of available metrics that Decision Server exposes with Prometheus, download the Red Hat Decision Manager 7.5.1 Source Distribution from the Red Hat Customer Portal and navigate to ~/rhdm-7.5.1-sources/src/droolsjbpm-integration-$VERSION/kie-server-parent/kie-server-services/kie-server-services-prometheus/src/main/java/org/kie/server/services/prometheus.
Prerequisites
- Decision Server is installed.
-
You have
kie-serveruser role access to Decision Server. - Prometheus is installed. For information about downloading and using Prometheus, see the Prometheus documentation page.
Procedure
-
In your Decision Server instance, set the
org.kie.prometheus.server.ext.disabledsystem property tofalseto enable the Prometheus extension. You can define this property when you start Decision Server or in thestandalone.xmlorstandalone-full.xmlfile of Red Hat Decision Manager distribution. If you are running Red Hat Decision Manager on Spring Boot, add the following dependencies in the
pom.xmlfile of your Maven project and configure the required key in theapplication.propertiessystem property:Spring Boot pom.xml dependencies for Prometheus
<dependency>
  <groupId>org.kie.server</groupId>
  <artifactId>kie-server-services-prometheus</artifactId>
  <version>${rhdm.version}</version>
</dependency>

<dependency>
  <groupId>org.kie.server</groupId>
  <artifactId>kie-server-rest-prometheus</artifactId>
  <version>${rhdm.version}</version>
</dependency>
Spring Boot application.properties key for Red Hat Decision Manager and Prometheus
kieserver.drools.enabled=true
kieserver.dmn.enabled=true
kieserver.prometheus.enabled=true
In the
prometheus.yamlfile of your Prometheus distribution, add the following settings in thescrape_configssection to configure Prometheus to scrape metrics from Decision Server:Scrape configurations in prometheus.yaml file
scrape_configs:
  - job_name: 'kie-server'
    metrics_path: /SERVER_PATH/services/rest/metrics
    basic_auth:
      username: USER_NAME
      password: PASSWORD
    static_configs:
      - targets: ["HOST:PORT"]
Scrape configurations in prometheus.yaml file for Spring Boot (if applicable)
scrape_configs:
  - job_name: 'kie'
    metrics_path: /rest/metrics
    static_configs:
      - targets: ["HOST:PORT"]
Replace the values according to your Decision Server location and settings.
Start the Decision Server instance.
Example start command for Red Hat Decision Manager on Red Hat JBoss EAP
$ cd ~/EAP_HOME/bin
$ ./standalone.sh --c standalone-full.xml
After you start the configured Decision Server instance, Prometheus begins collecting metrics and Decision Server publishes the metrics to the REST API endpoint
http://HOST:PORT/SERVER/services/rest/metrics(or on Spring Boot, tohttp://HOST:PORT/rest/metrics).In a REST client or curl utility, send a REST API request with the following components to verify that Decision Server is publishing the metrics:
For REST client:
-
Authentication: Enter the user name and password of the Decision Server user with the
kie-serverrole. HTTP Headers: Set the following header:
-
Accept:application/json
-
-
HTTP method: Set to
GET. -
URL: Enter the Decision Server REST API base URL and metrics endpoint, such as
http://localhost:8080/kie-server/services/rest/metrics(or on Spring Boot,http://localhost:8080/rest/metrics).
For curl utility:
-
-u: Enter the user name and password of the Decision Server user with thekie-serverrole. -H: Set the following header:-
accept:application/json
-
-
-X: Set toGET. -
URL: Enter the Decision Server REST API base URL and metrics endpoint, such as
http://localhost:8080/kie-server/services/rest/metrics(or on Spring Boot,http://localhost:8080/rest/metrics).
curl -u 'baAdmin:password@1' -H "accept: application/json" -X GET "http://localhost:8080/kie-server/services/rest/metrics"Example server response
# HELP kie_server_container_started_total Kie Server Started Containers
# TYPE kie_server_container_started_total counter
kie_server_container_started_total{container_id="task-assignment-kjar-1.0",} 1.0
# HELP solvers_running Number of solvers currently running
# TYPE solvers_running gauge
solvers_running 0.0
# HELP dmn_evaluate_decision_nanosecond DMN Evaluation Time
# TYPE dmn_evaluate_decision_nanosecond histogram
# HELP solver_duration_seconds Time in seconds it took solver to solve the constraint problem
# TYPE solver_duration_seconds summary
solver_duration_seconds_count{solver_id="100tasks-5employees.xml",} 1.0
solver_duration_seconds_sum{solver_id="100tasks-5employees.xml",} 179.828255925
solver_duration_seconds_count{solver_id="24tasks-8employees.xml",} 1.0
solver_duration_seconds_sum{solver_id="24tasks-8employees.xml",} 179.995759653
# HELP drl_match_fired_nanosecond Drools Firing Time
# TYPE drl_match_fired_nanosecond histogram
# HELP dmn_evaluate_failed_count DMN Evaluation Failed
# TYPE dmn_evaluate_failed_count counter
# HELP kie_server_start_time Kie Server Start Time
# TYPE kie_server_start_time gauge
kie_server_start_time{name="myapp-kieserver",server_id="myapp-kieserver",location="http://myapp-kieserver-demo-monitoring.127.0.0.1.nip.io:80/services/rest/server",version="7.4.0.redhat-20190428",} 1.557221271502E12
# HELP kie_server_container_running_total Kie Server Running Containers
# TYPE kie_server_container_running_total gauge
kie_server_container_running_total{container_id="task-assignment-kjar-1.0",} 1.0
# HELP solver_score_calculation_speed Number of moves per second for a particular solver solving the constraint problem
# TYPE solver_score_calculation_speed summary
solver_score_calculation_speed_count{solver_id="100tasks-5employees.xml",} 1.0
solver_score_calculation_speed_sum{solver_id="100tasks-5employees.xml",} 6997.0
solver_score_calculation_speed_count{solver_id="24tasks-8employees.xml",} 1.0
solver_score_calculation_speed_sum{solver_id="24tasks-8employees.xml",} 19772.0
If the metrics are not available in Decision Server, review and verify the Decision Server and Prometheus configurations described in this section.
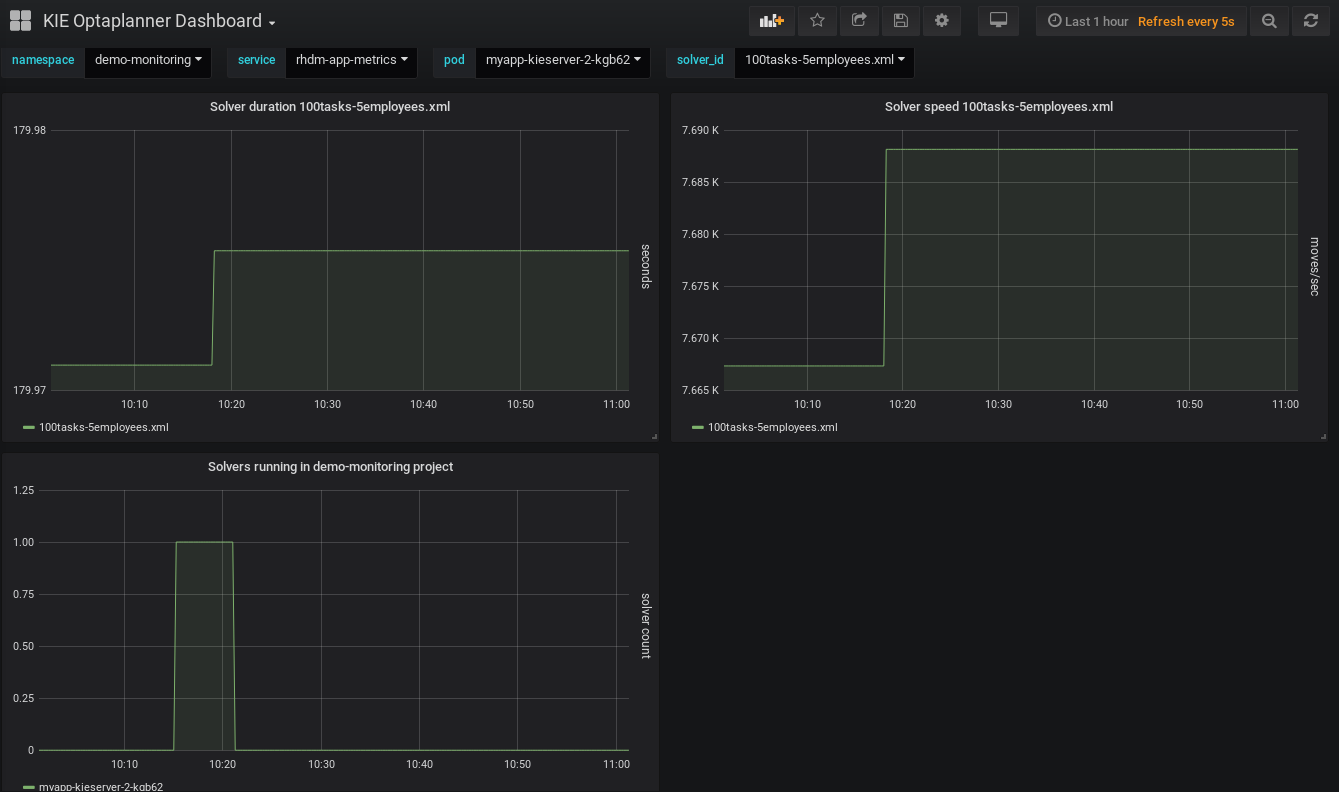
You can also interact with your collected metrics in the Prometheus expression browser at
http://HOST:PORT/graph, or integrate your Prometheus data source with a data-graphing tool such as Grafana:Figure 13.1. Prometheus expression browser with Decision Server metrics
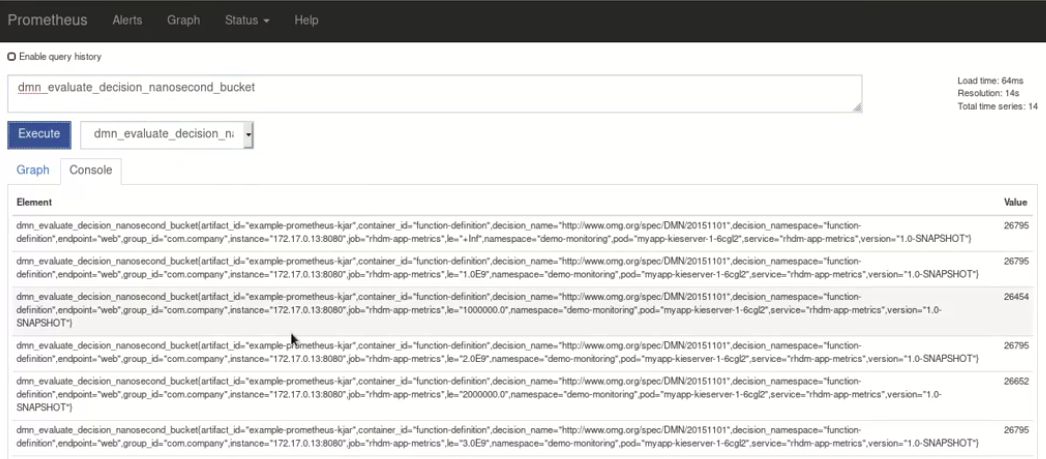
Figure 13.2. Prometheus expression browser with Decision Server target
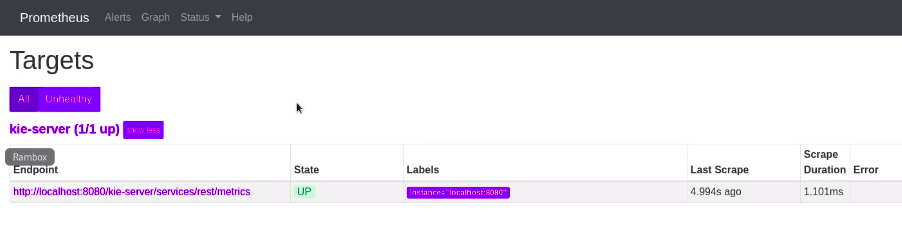
Figure 13.3. Grafana dashboard with Decision Server metrics for DMN models
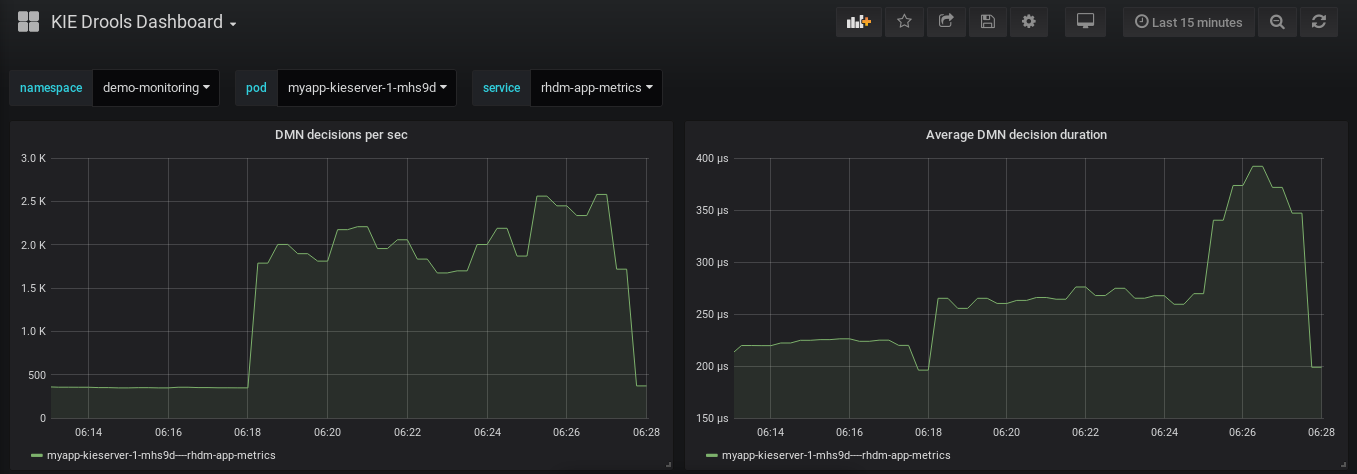
Figure 13.4. Grafana dashboard with Decision Server metrics for solvers
-
Authentication: Enter the user name and password of the Decision Server user with the
Additional resources
13.2. Configuring Prometheus metrics monitoring for Decision Server on Red Hat OpenShift Container Platform
You can configure your Decision Server deployment on Red Hat OpenShift Container Platform to use Prometheus to collect and store metrics related to your business asset activity in Red Hat Decision Manager. For the list of available metrics that Decision Server exposes with Prometheus, download the Red Hat Decision Manager 7.5.1 Source Distribution from the Red Hat Customer Portal and navigate to ~/rhdm-7.5.1-sources/src/droolsjbpm-integration-$VERSION/kie-server-parent/kie-server-services/kie-server-services-prometheus/src/main/java/org/kie/server/services/prometheus.
Prerequisites
- Decision Server is installed and deployed on Red Hat OpenShift Container Platform. For more information about Decision Server on OpenShift, see the relevant OpenShift deployment option in the Product documentation for Red Hat Decision Manager 7.5.
-
You have
kie-serveruser role access to Decision Server. - Prometheus Operator is installed. For information about downloading and using Prometheus Operator, see the Prometheus Operator project on GitHub.
Procedure
In the
DeploymentConfigobject of your Decision Server deployment on OpenShift, set thePROMETHEUS_SERVER_EXT_DISABLEDenvironment variable tofalseto enable the Prometheus extension. You can set this variable in the OpenShift web console or use theoccommand in a command terminal:oc set env dc/<dc_name> PROMETHEUS_SERVER_EXT_DISABLED=false -n <namespace>If you have not yet deployed your Decision Server on OpenShift, then in the OpenShift template that you plan to use for your OpenShift deployment (for example,
rhdm75-prod-immutable-kieserver.yaml), you can set thePROMETHEUS_SERVER_EXT_DISABLEDtemplate parameter tofalseto enable the Prometheus extension.If you are using the OpenShift Operator to deploy Decision Server on OpenShift, then in your Decision Server configuration, set the
PROMETHEUS_SERVER_EXT_DISABLEDenvironment variable tofalseto enable the Prometheus extension:apiVersion: app.kiegroup.org/v1 kind: KieApp metadata: name: enable-prometheus spec: environment: rhpam-trial objects: servers: - env: - name: PROMETHEUS_SERVER_EXT_DISABLED value: "false"Create a
service-metrics.yamlfile to add a service that exposes the metrics from Decision Server to Prometheus:apiVersion: v1 kind: Service metadata: annotations: description: RHDM Prometheus metrics exposed labels: app: myapp-kieserver application: myapp-kieserver template: myapp-kieserver metrics: rhdm name: rhdm-app-metrics spec: ports: - name: web port: 8080 protocol: TCP targetPort: 8080 selector: deploymentConfig: myapp-kieserver sessionAffinity: None type: ClusterIPIn a command terminal, use the
occommand to apply theservice-metrics.yamlfile to your OpenShift deployment:oc apply -f service-metrics.yaml-
Create an OpenShift secret, such as
metrics-secret, to access the Prometheus metrics on Decision Server. The secret must contain the "username" and "password" elements with Decision Server user credentials. For information about OpenShift secrets, see the Secrets chapter in the OpenShift Developer Guide. Create a
service-monitor.yamlfile that defines theServiceMonitorobject. A service monitor enables Prometheus to connect to the Decision Server metrics service.apiVersion: monitoring.coreos.com/v1 kind: ServiceMonitor metadata: name: rhdm-service-monitor labels: team: frontend spec: selector: matchLabels: metrics: rhdm endpoints: - port: web path: /services/rest/metrics basicAuth: password: name: metrics-secret key: password username: name: metrics-secret key: usernameIn a command terminal, use the
occommand to apply theservice-monitor.yamlfile to your OpenShift deployment:oc apply -f service-monitor.yamlAfter you complete these configurations, Prometheus begins collecting metrics and Decision Server publishes the metrics to the REST API endpoint
http://HOST:PORT/kie-server/services/rest/metrics.You can interact with your collected metrics in the Prometheus expression browser at
http://HOST:PORT/graph, or integrate your Prometheus data source with a data-graphing tool such as Grafana.The host and port for the Prometheus expression browser location
http://HOST:PORT/graphwas defined in the route where you exposed the Prometheus web console when you installed the Prometheus Operator. For information about OpenShift routes, see the Routes chapter in the OpenShift Architecture documentation.Figure 13.5. Prometheus expression browser with Decision Server metrics
Figure 13.6. Prometheus expression browser with Decision Server target
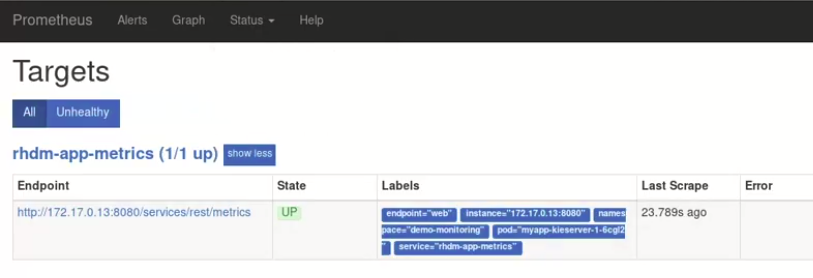
Figure 13.7. Grafana dashboard with Decision Server metrics for DMN models
Figure 13.8. Grafana dashboard with Decision Server metrics for solvers
Additional resources
13.3. Extending Prometheus metrics monitoring in Decision Server with custom metrics
After you configure your Decision Server instance to use Prometheus metrics monitoring, you can extend the Prometheus functionality in Decision Server to use custom metrics according to your business needs. Prometheus then collects and stores your custom metrics along with the default metrics that Decision Server exposes with Prometheus.
As an example, this procedure defines custom Decision Model and Notation (DMN) metrics to be collected and stored by Prometheus.
Prerequisites
- Prometheus metrics monitoring is configured for your Decision Server instance. For information about Prometheus configuration with Decision Server on-premise, see Section 13.1, “Configuring Prometheus metrics monitoring for Decision Server”. For information about Prometheus configuration with Decision Server on Red Hat OpenShift Container Platform, see Section 13.2, “Configuring Prometheus metrics monitoring for Decision Server on Red Hat OpenShift Container Platform”.
Procedure
Create an empty Maven project and define the following packaging type and dependencies in the
pom.xmlfile for the project:Example pom.xml file in the sample project
<packaging>jar</packaging>

<properties>
  <version.org.kie>7.26.0.Final-redhat-00005</version.org.kie>
</properties>

<dependencies>
  <dependency>
    <groupId>org.kie</groupId>
    <artifactId>kie-api</artifactId>
    <version>${version.org.kie}</version>
  </dependency>
  <dependency>
    <groupId>org.kie.server</groupId>
    <artifactId>kie-server-api</artifactId>
    <version>${version.org.kie}</version>
  </dependency>
  <dependency>
    <groupId>org.kie.server</groupId>
    <artifactId>kie-server-services-common</artifactId>
    <version>${version.org.kie}</version>
  </dependency>
  <dependency>
    <groupId>org.kie.server</groupId>
    <artifactId>kie-server-services-drools</artifactId>
    <version>${version.org.kie}</version>
  </dependency>
  <dependency>
    <groupId>org.kie.server</groupId>
    <artifactId>kie-server-services-prometheus</artifactId>
    <version>${version.org.kie}</version>
  </dependency>
  <dependency>
    <groupId>org.kie</groupId>
    <artifactId>kie-dmn-api</artifactId>
    <version>${version.org.kie}</version>
  </dependency>
  <dependency>
    <groupId>org.kie</groupId>
    <artifactId>kie-dmn-core</artifactId>
    <version>${version.org.kie}</version>
  </dependency>
  <dependency>
    <groupId>org.jbpm</groupId>
    <artifactId>jbpm-services-api</artifactId>
    <version>${version.org.kie}</version>
  </dependency>
  <dependency>
    <groupId>org.jbpm</groupId>
    <artifactId>jbpm-executor</artifactId>
    <version>${version.org.kie}</version>
  </dependency>
  <dependency>
    <groupId>org.optaplanner</groupId>
    <artifactId>optaplanner-core</artifactId>
    <version>${version.org.kie}</version>
  </dependency>
  <dependency>
    <groupId>io.prometheus</groupId>
    <artifactId>simpleclient</artifactId>
    <version>0.5.0</version>
  </dependency>
</dependencies>
Implement the relevant listener from the
org.kie.server.services.prometheus.PrometheusMetricsProviderinterface as part of the custom listener class that defines your custom Prometheus metrics, as shown in the following example:Sample implementation of the
DMNRuntimeEventListenerlistener in a custom listener classpackage org.kie.server.ext.prometheus; import io.prometheus.client.Gauge; import org.kie.dmn.api.core.ast.DecisionNode; import org.kie.dmn.api.core.event.AfterEvaluateBKMEvent; import org.kie.dmn.api.core.event.AfterEvaluateContextEntryEvent; import org.kie.dmn.api.core.event.AfterEvaluateDecisionEvent; import org.kie.dmn.api.core.event.AfterEvaluateDecisionServiceEvent; import org.kie.dmn.api.core.event.AfterEvaluateDecisionTableEvent; import org.kie.dmn.api.core.event.BeforeEvaluateBKMEvent; import org.kie.dmn.api.core.event.BeforeEvaluateContextEntryEvent; import org.kie.dmn.api.core.event.BeforeEvaluateDecisionEvent; import org.kie.dmn.api.core.event.BeforeEvaluateDecisionServiceEvent; import org.kie.dmn.api.core.event.BeforeEvaluateDecisionTableEvent; import org.kie.dmn.api.core.event.DMNRuntimeEventListener; import org.kie.server.api.model.ReleaseId; import org.kie.server.services.api.KieContainerInstance; public class ExampleCustomPrometheusMetricListener implements DMNRuntimeEventListener { private final KieContainerInstance kieContainer; private final Gauge randomGauge = Gauge.build() .name("random_gauge_nanosecond") .help("Random gauge as an example of custom KIE Prometheus metric") .labelNames("container_id", "group_id", "artifact_id", "version", "decision_namespace", "decision_name") .register(); public ExampleCustomPrometheusMetricListener(KieContainerInstance containerInstance) { kieContainer = containerInstance; } public void beforeEvaluateDecision(BeforeEvaluateDecisionEvent e) { } public void afterEvaluateDecision(AfterEvaluateDecisionEvent e) { DecisionNode decisionNode = e.getDecision(); ReleaseId releaseId = kieContainer.getResource().getReleaseId(); randomGauge.labels(kieContainer.getContainerId(), releaseId.getGroupId(), releaseId.getArtifactId(), releaseId.getVersion(), decisionNode.getModelName(), decisionNode.getModelNamespace()) .set((int) (Math.random() * 100)); } public void beforeEvaluateBKM(BeforeEvaluateBKMEvent event) { } public void afterEvaluateBKM(AfterEvaluateBKMEvent event) { } public void beforeEvaluateContextEntry(BeforeEvaluateContextEntryEvent event) { } public void afterEvaluateContextEntry(AfterEvaluateContextEntryEvent event) { } public void beforeEvaluateDecisionTable(BeforeEvaluateDecisionTableEvent event) { } public void afterEvaluateDecisionTable(AfterEvaluateDecisionTableEvent event) { } public void beforeEvaluateDecisionService(BeforeEvaluateDecisionServiceEvent event) { } public void afterEvaluateDecisionService(AfterEvaluateDecisionServiceEvent event) { } }The
PrometheusMetricsProviderinterface contains the required listeners for collecting Prometheus metrics. The interface is incorporated by thekie-server-services-prometheusdependency that you declared in your projectpom.xmlfile.In this example, the
ExampleCustomPrometheusMetricListenerclass implements theDMNRuntimeEventListenerlistener (from thePrometheusMetricsProviderinterface) and defines the custom DMN metrics to be collected and stored by Prometheus.Implement the
PrometheusMetricsProviderinterface as part of a custom metrics provider class that associates your custom listener with thePrometheusMetricsProviderinterface, as shown in the following example:Sample implementation of the
PrometheusMetricsProviderinterface in a custom metrics provider classpackage org.kie.server.ext.prometheus; import org.jbpm.executor.AsynchronousJobListener; import org.jbpm.services.api.DeploymentEventListener; import org.kie.api.event.rule.AgendaEventListener; import org.kie.api.event.rule.DefaultAgendaEventListener; import org.kie.dmn.api.core.event.DMNRuntimeEventListener; import org.kie.server.services.api.KieContainerInstance; import org.kie.server.services.prometheus.PrometheusMetricsProvider; import org.optaplanner.core.impl.phase.event.PhaseLifecycleListener; import org.optaplanner.core.impl.phase.event.PhaseLifecycleListenerAdapter; public class MyPrometheusMetricsProvider implements PrometheusMetricsProvider { public DMNRuntimeEventListener createDMNRuntimeEventListener(KieContainerInstance kContainer) { return new ExampleCustomPrometheusMetricListener(kContainer); } public AgendaEventListener createAgendaEventListener(String kieSessionId, KieContainerInstance kContainer) { return new DefaultAgendaEventListener(); } public PhaseLifecycleListener createPhaseLifecycleListener(String solverId) { return new PhaseLifecycleListenerAdapter() { }; } public AsynchronousJobListener createAsynchronousJobListener() { return null; } public DeploymentEventListener createDeploymentEventListener() { return null; } }In this example, the
MyPrometheusMetricsProviderclass implements thePrometheusMetricsProviderinterface and includes your customExampleCustomPrometheusMetricListenerlistener class.-
To make the new metrics provider discoverable for Decision Server, create a
META-INF/services/org.kie.server.services.prometheus.PrometheusMetricsProviderfile in your Maven project and add the fully qualified class name of thePrometheusMetricsProviderimplementation class within the file. For this example, the file contains the single lineorg.kie.server.ext.prometheus.MyPrometheusMetricsProvider. -
Build your project and copy the resulting JAR file into the
~/kie-server.war/WEB-INF/libdirectory of your project. For example, on Red Hat JBoss EAP, the path to this directory isEAP_HOME/standalone/deployments/kie-server.war/WEB-INF/lib. Start the Decision Server and deploy the built project to the running Decision Server. You can deploy the project using the Business Central interface or the Decision Server REST API (a
PUTrequest tohttp://SERVER:PORT/kie-server/services/rest/server/containers/{containerId}).After your project is deployed on a running Decision Server, Prometheus begins collecting metrics and Decision Server publishes the metrics to the REST API endpoint
http://HOST:PORT/SERVER/services/rest/metrics(or on Spring Boot, tohttp://HOST:PORT/rest/metrics).