Este conteúdo não está disponível no idioma selecionado.
8.3. Gadgets
- Response Time
- The Response Time gadget shows average, minimum and maximum summary metrics from the service operations invoked over a period of time. The gadget configuration can be used to select a particular service to display. It is also possible to customize the gadget further to display only the metrics from a particular operation on that service.
Figure 8.1. Response Time
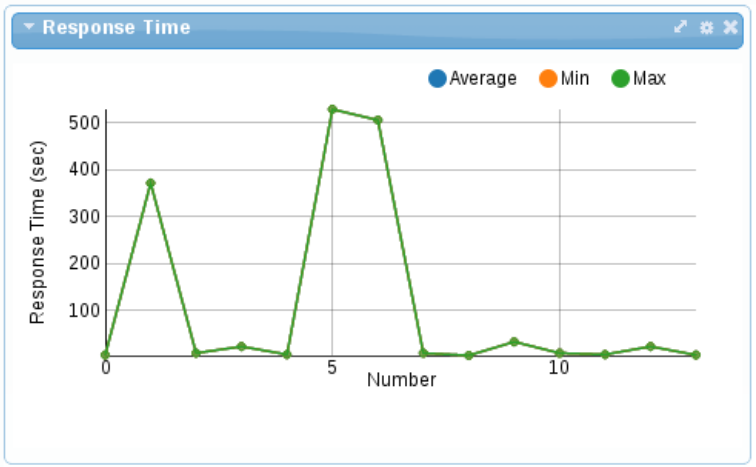 The X-axis represents the number of response time metrics captured for the particular services or operation. Note that it is not related to time. The collection of metrics in the underlying active collection displayed has a maximum size, hence it only discards the metrics when it reaches that maximum threshold.
 - Situations
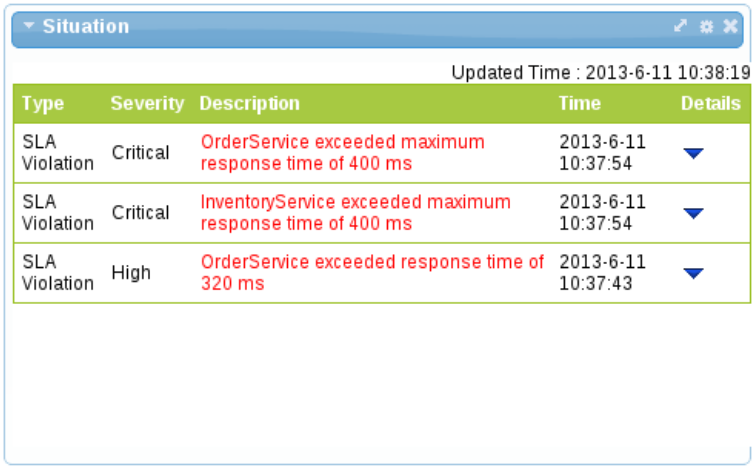
- Situations are created by event processors when they detect a "situation of interest". For example, an error or service level agreement violation. These situations are captured in a predefined active collection that is configured to only show the latest situations. They are automatically removed from the collection after a specified time period. This ensures that the gadget displaying the situations only shows the latest problems that are occurring. However, situations can also be reported via JMX for more long term management.
Figure 8.2. Situations
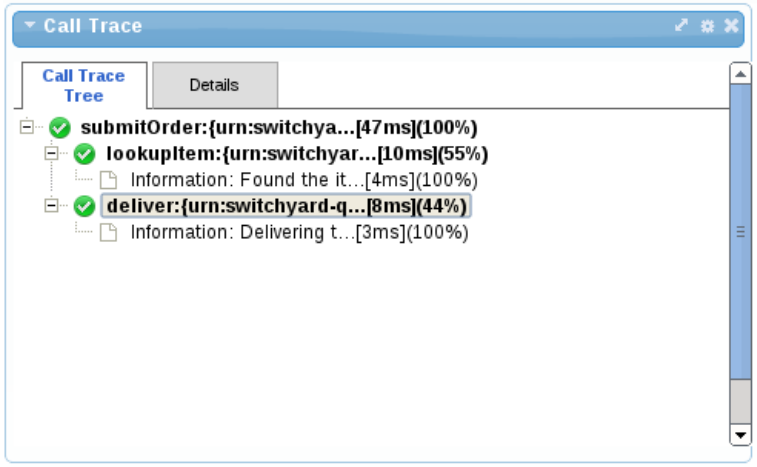
- Call Trace
- The Call Trace gadget provides the means to display the invocation history of a particular business transaction instance. The business transaction is identified by entering its globally unique identifier in the gadget’s configuration.The business transaction id is specific to the messages being monitored. For example, a purchasing business transaction may have a purchase order number that is carried with the various business messages. This information can be extracted from the message contents using an "information processor", and the extract value specified in the call trace gadget's configuration.
Figure 8.3. Call Trace
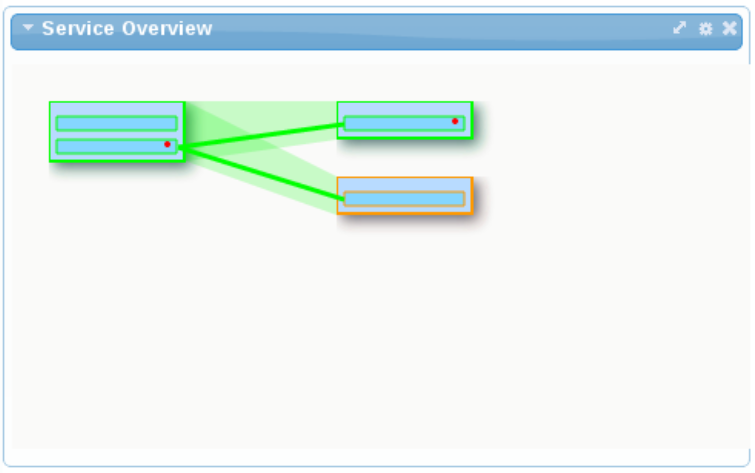
- Service Overview
- The Service Overview gadget provides a graphical representation of the dependencies (invocation/usage) between services. When displayed as part of a group of gadgets, the representation shows the status of each service and link as a color (green being normal). If the gadget is enlarged, further details are included, such as the service and operation names. Metrics are visible by hovering over an object. When a situation is reported, a red dot will be displayed on that component.
Figure 8.4. Service Overview