Este conteúdo não está disponível no idioma selecionado.
Chapter 5. Debugging
5.1. Locate the logs
5.1.1. Access OpenDaylight logs
OpenDaylight stores logs in containers in the /var/log/containers/opendaylight directory. The most recent log is named karaf.log. OpenDaylight appends incremental numbering to previous logs, for example, karaf.log.1, karaf.log.2.
5.1.2. Access OpenStack Networking logs
When OpenStack networking commands fail, first examine the neutron logs. You can find the neutron logs in the server.log file on each neutron node in the /var/log/containers/neutron directory.
The server.log file also includes errors about the communication with OpenDaylight. If the neutron error originates from interacting with OpenDaylight, you must also examine the OpenDaylight logs to locate the cause of the failure.
5.2. Debug networking errors
If you experience a network error such as loss of instance connectivity, but no errors are reported when issuing OpenStack commands or in the neutron logs, then it might be useful to inspect the OVS nodes for network traffic and OpenFlow flows:
-
Log in as
superuserto the node where the network error occurs. Display the information about the br-int switch.
ovs-ofctl -O openflow13 show br-int
# ovs-ofctl -O openflow13 show br-intCopy to Clipboard Copied! Toggle word wrap Toggle overflow Examine the output. It must be similar to this example:
Copy to Clipboard Copied! Toggle word wrap Toggle overflow List the statistics for the br-int switch.
ovs-ofctl -O openflow13 dump-ports br-int
# ovs-ofctl -O openflow13 dump-ports br-intCopy to Clipboard Copied! Toggle word wrap Toggle overflow Examine the output. It must be similar to this example:
Copy to Clipboard Copied! Toggle word wrap Toggle overflow
More information
- In Step 3, note that there are three ports on this OVS node. The first port is a patch port going to the bridge br-ex, which is an External network connectivity port in this scenario. The second port is a tap port, which connects to a DHCP agent instance. We know this because the host is a controller, otherwise on a Compute role it would be an instance. The third port is a VXLAN tunnel port created for the tenant traffic.
- When you understand what each port is, you can examine the port statistics to verify that the port is receiving/sending traffic (see Step 4).
- From the output in Step 5, note that each port is receiving (rx pkts) and sending packets (tx pkts).
5.2.1. Advanced debugging using OpenFlow flows
For advanced users who are familiar with OpenFlow, you can examine the flows on the switch to detect where the traffic drops.
To list the flows, and to see how many packets have hit them, enter the following command:
ovs-ofctl -O openflow13 dump-flows br-int
# ovs-ofctl -O openflow13 dump-flows br-intCopy to Clipboard Copied! Toggle word wrap Toggle overflow Examine the output of the command to get the necessary information:
Copy to Clipboard Copied! Toggle word wrap Toggle overflow
This output has been edited for length.
5.2.2. Packet traverse in OpenFlow
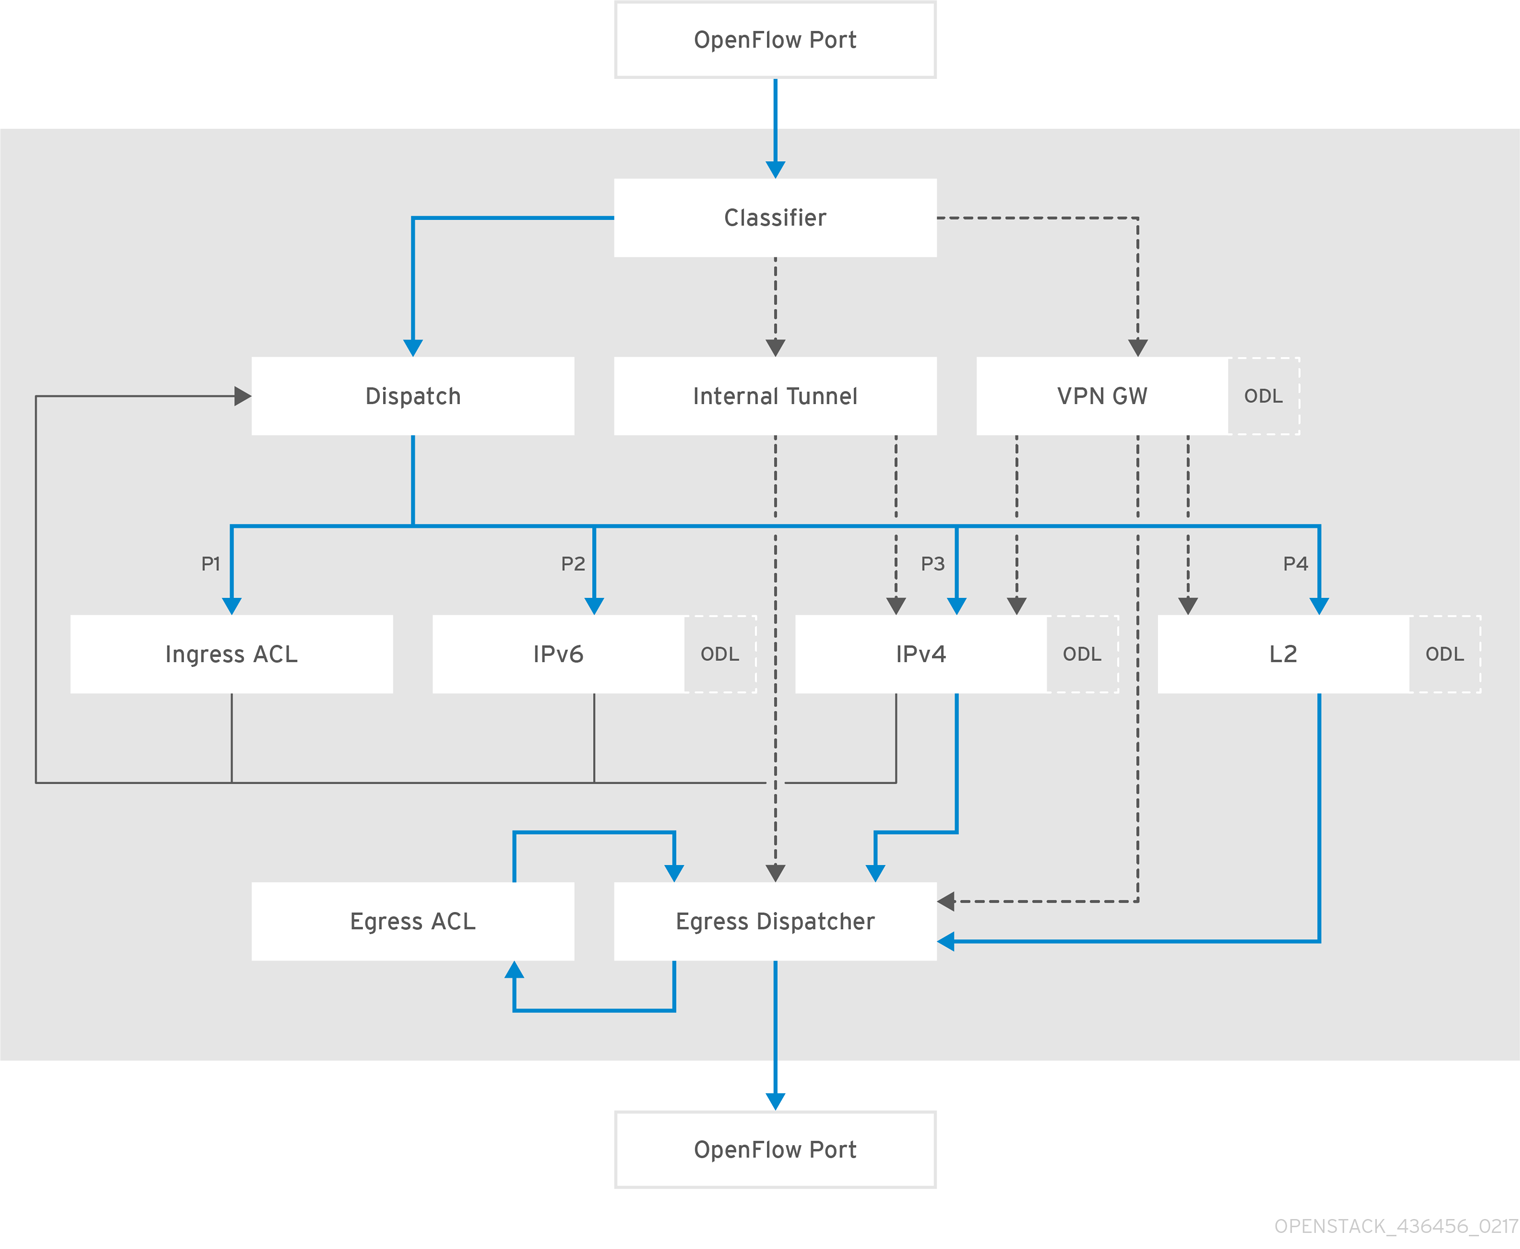
The important things to understand are that the network functions performed on a packet are broken into different OpenFlow tables, and packets traverse those tables in order, starting from zero. An incoming packet lands in table 0, and then progresses through the OpenFlow Pipeline until it is sent out of a port, to the OpenDaylight Controller, or dropped. A packet may skip one or more tables depending on which network function it may need to go to. The full diagram of tables and how they correspond to network functions is shown below:
Figure 5.1. OpenDaylight NetVirt OpenFlow Pipeline