Este conteúdo não está disponível no idioma selecionado.
Chapter 17. Prometheus metrics monitoring in Red Hat Process Automation Manager
Prometheus is an open-source systems monitoring toolkit that you can use with Red Hat Process Automation Manager to collect and store metrics related to the execution of business rules, processes, Decision Model and Notation (DMN) models, and other Red Hat Process Automation Manager assets. You can access the stored metrics through a REST API call to the Process Server, through the Prometheus expression browser, or using a data-graphing tool such as Grafana.
You can configure Prometheus metrics monitoring for an on-premise Process Server instance, for Process Server on Spring Boot, or for a Process Server deployment on Red Hat OpenShift Container Platform.
For the list of available metrics that Process Server exposes with Prometheus, download the Red Hat Process Automation Manager 7.4.0 Source Distribution from the Red Hat Customer Portal and navigate to ~/rhpam-7.4.0-sources/src/droolsjbpm-integration-$VERSION/kie-server-parent/kie-server-services/kie-server-services-prometheus/src/main/java/org/kie/server/services/prometheus.
17.1. Configuring Prometheus metrics monitoring for Process Server
You can configure your Process Server instances to use Prometheus to collect and store metrics related to your business asset activity in Red Hat Process Automation Manager. For the list of available metrics that Process Server exposes with Prometheus, download the Red Hat Process Automation Manager 7.4.0 Source Distribution from the Red Hat Customer Portal and navigate to ~/rhpam-7.4.0-sources/src/droolsjbpm-integration-$VERSION/kie-server-parent/kie-server-services/kie-server-services-prometheus/src/main/java/org/kie/server/services/prometheus.
Prerequisites
- Process Server is installed.
-
You have
kie-serveruser role access to Process Server. - Prometheus is installed. For information about downloading and using Prometheus, see the Prometheus documentation page.
Procedure
-
In your Process Server instance, set the
org.kie.prometheus.server.ext.disabledsystem property tofalseto enable the Prometheus extension. You can define this property when you start Process Server or in thestandalone.xmlorstandalone-full.xmlfile of Red Hat Process Automation Manager distribution. If you are running Red Hat Process Automation Manager on Spring Boot, add the following dependencies in the
pom.xmlfile of your Maven project and configure the required key in theapplication.propertiessystem property:Spring Boot pom.xml dependencies for Prometheus
<dependency>
  <groupId>org.kie.server</groupId>
  <artifactId>kie-server-services-prometheus</artifactId>
  <version>${rhpam.version}</version>
</dependency>

<dependency>
  <groupId>org.kie.server</groupId>
  <artifactId>kie-server-rest-prometheus</artifactId>
  <version>${rhpam.version}</version>
</dependency>
Spring Boot application.properties key for Red Hat Process Automation Manager and Prometheus
kieserver.jbpm.enabled=true
kieserver.drools.enabled=true
kieserver.dmn.enabled=true
kieserver.prometheus.enabled=true
In the
prometheus.yamlfile of your Prometheus distribution, add the following settings in thescrape_configssection to configure Prometheus to scrape metrics from Process Server:Scrape configurations in prometheus.yaml file
scrape_configs:
  job_name: 'kie-server'
metrics_path: /SERVER_PATH/services/rest/metrics
Basic_auth:
username: USER_NAME
password: PASSWORD
static_configs:
  - targets: ["HOST:PORT"]
Scrape configurations in prometheus.yaml file for Spring Boot (if applicable)
scrape_configs:
  job_name: 'kie'
metrics_path: /rest/metrics
static_configs:
- targets: ["HOST:PORT"]
Replace the values according to your Process Server location and settings.
Start the Process Server instance.
Example start command for Red Hat Process Automation Manager on Red Hat JBoss EAP
$ cd ~/EAP_HOME/bin
$ ./standalone.sh --c standalone-full.xml
After you start the configured Process Server instance, Prometheus begins collecting metrics and Process Server publishes the metrics to the REST API endpoint
http://HOST:PORT/SERVER/services/rest/metrics(or on Spring Boot, tohttp://HOST:PORT/rest/metrics).In a REST client or curl utility, send a REST API request with the following components to verify that Process Server is publishing the metrics:
For REST client:
-
Authentication: Enter the user name and password of the Process Server user with the
kie-serverrole. HTTP Headers: Set the following header:
-
Accept:application/json
-
-
HTTP method: Set to
GET. -
URL: Enter the Process Server REST API base URL and metrics endpoint, such as
http://localhost:8080/kie-server/services/rest/metrics(or on Spring Boot,http://localhost:8080/rest/metrics).
For curl utility:
-
-u: Enter the user name and password of the Process Server user with thekie-serverrole. -H: Set the following header:-
accept:application/json
-
-
-X: Set toGET. -
URL: Enter the Process Server REST API base URL and metrics endpoint, such as
http://localhost:8080/kie-server/services/rest/metrics(or on Spring Boot,http://localhost:8080/rest/metrics).
curl -u 'baAdmin:password@1' -H "accept: application/json" -X GET "http://localhost:8080/kie-server/services/rest/metrics"Example server response
# HELP kie_server_container_started_total Kie Server Started Containers
# TYPE kie_server_container_started_total counter
kie_server_container_started_total{container_id="task-assignment-kjar-1.0",} 1.0
# HELP solvers_running Number of solvers currently running
# TYPE solvers_running gauge
solvers_running 0.0
# HELP dmn_evaluate_decision_nanosecond DMN Evaluation Time
# TYPE dmn_evaluate_decision_nanosecond histogram
# HELP solver_duration_seconds Time in seconds it took solver to solve the constraint problem
# TYPE solver_duration_seconds summary
solver_duration_seconds_count{solver_id="100tasks-5employees.xml",} 1.0
solver_duration_seconds_sum{solver_id="100tasks-5employees.xml",} 179.828255925
solver_duration_seconds_count{solver_id="24tasks-8employees.xml",} 1.0
solver_duration_seconds_sum{solver_id="24tasks-8employees.xml",} 179.995759653
# HELP drl_match_fired_nanosecond Drools Firing Time
# TYPE drl_match_fired_nanosecond histogram
# HELP dmn_evaluate_failed_count DMN Evaluation Failed
# TYPE dmn_evaluate_failed_count counter
# HELP kie_server_start_time Kie Server Start Time
# TYPE kie_server_start_time gauge
kie_server_start_time{name="myapp-kieserver",server_id="myapp-kieserver",location="http://myapp-kieserver-demo-monitoring.127.0.0.1.nip.io:80/services/rest/server",version="7.4.0.redhat-20190428",} 1.557221271502E12
# HELP kie_server_container_running_total Kie Server Running Containers
# TYPE kie_server_container_running_total gauge
kie_server_container_running_total{container_id="task-assignment-kjar-1.0",} 1.0
# HELP solver_score_calculation_speed Number of moves per second for a particular solver solving the constraint problem
# TYPE solver_score_calculation_speed summary
solver_score_calculation_speed_count{solver_id="100tasks-5employees.xml",} 1.0
solver_score_calculation_speed_sum{solver_id="100tasks-5employees.xml",} 6997.0
solver_score_calculation_speed_count{solver_id="24tasks-8employees.xml",} 1.0
solver_score_calculation_speed_sum{solver_id="24tasks-8employees.xml",} 19772.0
# HELP kie_server_case_started_total Kie Server Started Cases
# TYPE kie_server_case_started_total counter
kie_server_case_started_total{case_definition_id="itorders.orderhardware",} 1.0
# HELP kie_server_case_running_total Kie Server Running Cases
# TYPE kie_server_case_running_total gauge
kie_server_case_running_total{case_definition_id="itorders.orderhardware",} 2.0
# HELP kie_server_data_set_registered_total Kie Server Data Set Registered
# TYPE kie_server_data_set_registered_total gauge
kie_server_data_set_registered_total{name="jbpmProcessInstanceLogs::CUSTOM",uuid="jbpmProcessInstanceLogs",} 1.0
kie_server_data_set_registered_total{name="jbpmRequestList::CUSTOM",uuid="jbpmRequestList",} 1.0
kie_server_data_set_registered_total{name="tasksMonitoring::CUSTOM",uuid="tasksMonitoring",} 1.0
kie_server_data_set_registered_total{name="jbpmHumanTasks::CUSTOM",uuid="jbpmHumanTasks",} 1.0
kie_server_data_set_registered_total{name="jbpmHumanTasksWithUser::FILTERED_PO_TASK",uuid="jbpmHumanTasksWithUser",} 1.0
kie_server_data_set_registered_total{name="jbpmHumanTasksWithVariables::CUSTOM",uuid="jbpmHumanTasksWithVariables",} 1.0
kie_server_data_set_registered_total{name="jbpmProcessInstancesWithVariables::CUSTOM",uuid="jbpmProcessInstancesWithVariables",} 1.0
kie_server_data_set_registered_total{name="jbpmProcessInstances::CUSTOM",uuid="jbpmProcessInstances",} 1.0
kie_server_data_set_registered_total{name="jbpmExecutionErrorList::CUSTOM",uuid="jbpmExecutionErrorList",} 1.0
kie_server_data_set_registered_total{name="processesMonitoring::CUSTOM",uuid="processesMonitoring",} 1.0
kie_server_data_set_registered_total{name="jbpmHumanTasksWithAdmin::FILTERED_BA_TASK",uuid="jbpmHumanTasksWithAdmin",} 1.0
# HELP kie_server_execution_error_total Kie Server Execution Errors
# TYPE kie_server_execution_error_total counter
# HELP kie_server_task_completed_total Kie Server Completed Tasks
# TYPE kie_server_task_completed_total counter
# HELP kie_server_container_running_total Kie Server Running Containers
# TYPE kie_server_container_running_total gauge
kie_server_container_running_total{container_id="itorders_1.0.0-SNAPSHOT",} 1.0
# HELP kie_server_job_cancelled_total Kie Server Cancelled Jobs
# TYPE kie_server_job_cancelled_total counter
# HELP kie_server_process_instance_started_total Kie Server Started Process Instances
# TYPE kie_server_process_instance_started_total counter
kie_server_process_instance_started_total{container_id="itorders_1.0.0-SNAPSHOT",process_id="itorders.orderhardware",} 1.0
# HELP solver_duration_seconds Time in seconds it took solver to solve the constraint problem
# TYPE solver_duration_seconds summary
# HELP kie_server_task_skipped_total Kie Server Skipped Tasks
# TYPE kie_server_task_skipped_total counter
# HELP kie_server_data_set_execution_time_seconds Kie Server Data Set Execution Time
# TYPE kie_server_data_set_execution_time_seconds summary
kie_server_data_set_execution_time_seconds_count{uuid="jbpmProcessInstances",} 8.0
kie_server_data_set_execution_time_seconds_sum{uuid="jbpmProcessInstances",} 0.05600000000000001
# HELP kie_server_job_scheduled_total Kie Server Started Jobs
# TYPE kie_server_job_scheduled_total counter
# HELP kie_server_data_set_execution_total Kie Server Data Set Execution
# TYPE kie_server_data_set_execution_total counter
kie_server_data_set_execution_total{uuid="jbpmProcessInstances",} 8.0
# HELP kie_server_process_instance_completed_total Kie Server Completed Process Instances
# TYPE kie_server_process_instance_completed_total counter
# HELP kie_server_job_running_total Kie Server Running Jobs
# TYPE kie_server_job_running_total gauge
# HELP kie_server_task_failed_total Kie Server Failed Tasks
# TYPE kie_server_task_failed_total counter
# HELP kie_server_task_exited_total Kie Server Exited Tasks
# TYPE kie_server_task_exited_total counter
# HELP dmn_evaluate_decision_nanosecond DMN Evaluation Time
# TYPE dmn_evaluate_decision_nanosecond histogram
# HELP kie_server_data_set_lookups_total Kie Server Data Set Running Lookups
# TYPE kie_server_data_set_lookups_total gauge
kie_server_data_set_lookups_total{uuid="jbpmProcessInstances",} 0.0
# HELP kie_server_process_instance_duration_seconds Kie Server Process Instances Duration
# TYPE kie_server_process_instance_duration_seconds summary
# HELP kie_server_case_duration_seconds Kie Server Case Duration
# TYPE kie_server_case_duration_seconds summary
# HELP dmn_evaluate_failed_count DMN Evaluation Failed
# TYPE dmn_evaluate_failed_count counter
# HELP kie_server_task_added_total Kie Server Added Tasks
# TYPE kie_server_task_added_total counter
kie_server_task_added_total{deployment_id="itorders_1.0.0-SNAPSHOT",process_id="itorders.orderhardware",task_name="Prepare hardware spec",} 1.0
# HELP drl_match_fired_nanosecond Drools Firing Time
# TYPE drl_match_fired_nanosecond histogram
# HELP kie_server_container_started_total Kie Server Started Containers
# TYPE kie_server_container_started_total counter
kie_server_container_started_total{container_id="itorders_1.0.0-SNAPSHOT",} 1.0
# HELP kie_server_process_instance_sla_violated_total Kie Server Process Instances SLA Violated
# TYPE kie_server_process_instance_sla_violated_total counter
# HELP kie_server_task_duration_seconds Kie Server Task Duration
# TYPE kie_server_task_duration_seconds summary
# HELP kie_server_job_executed_total Kie Server Executed Jobs
# TYPE kie_server_job_executed_total counter
# HELP kie_server_deployments_active_total Kie Server Active Deployments
# TYPE kie_server_deployments_active_total gauge
kie_server_deployments_active_total{deployment_id="itorders_1.0.0-SNAPSHOT",} 1.0
# HELP kie_server_process_instance_running_total Kie Server Running Process Instances
# TYPE kie_server_process_instance_running_total gauge
kie_server_process_instance_running_total{container_id="itorders_1.0.0-SNAPSHOT",process_id="itorders.orderhardware",} 2.0
# HELP solvers_running Number of solvers currently running
# TYPE solvers_running gauge
solvers_running 0.0
# HELP kie_server_work_item_duration_seconds Kie Server Work Items Duration
# TYPE kie_server_work_item_duration_seconds summary
# HELP kie_server_job_duration_seconds Kie Server Job Duration
# TYPE kie_server_job_duration_seconds summary
# HELP solver_score_calculation_speed Number of moves per second for a particular solver solving the constraint problem
# TYPE solver_score_calculation_speed summary
# HELP kie_server_start_time Kie Server Start Time
# TYPE kie_server_start_time gauge
kie_server_start_time{name="sample-server",server_id="sample-server",location="http://localhost:8080/kie-server/services/rest/server",version="7.22.0-SNAPSHOT",} 1.557285486469E12
If the metrics are not available in Process Server, review and verify the Process Server and Prometheus configurations described in this section.
You can also interact with your collected metrics in the Prometheus expression browser at
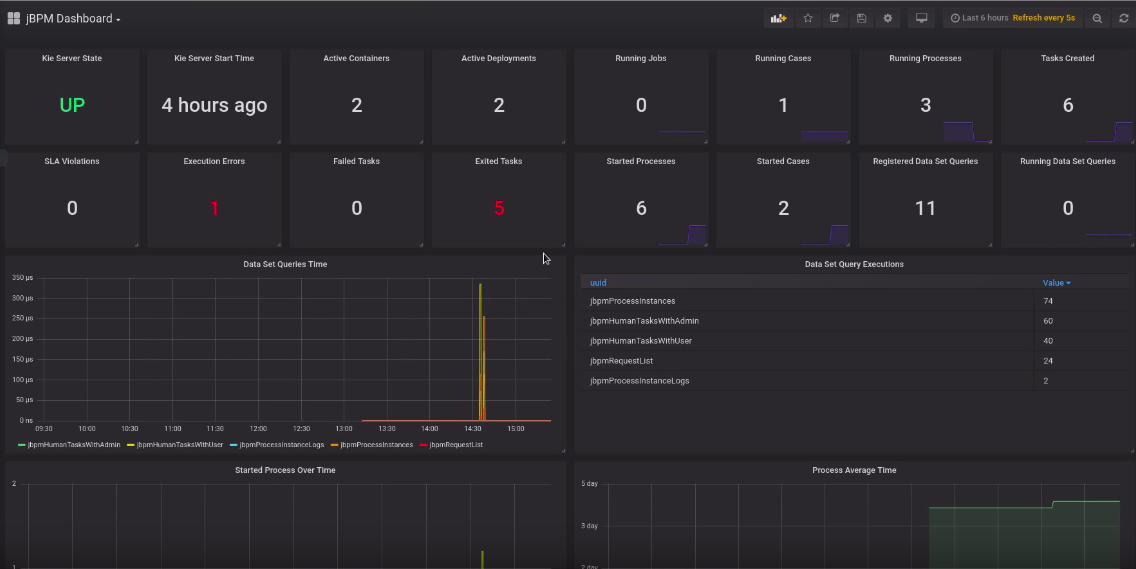
http://HOST:PORT/graph, or integrate your Prometheus data source with a data-graphing tool such as Grafana:Figure 17.1. Prometheus expression browser with Process Server metrics
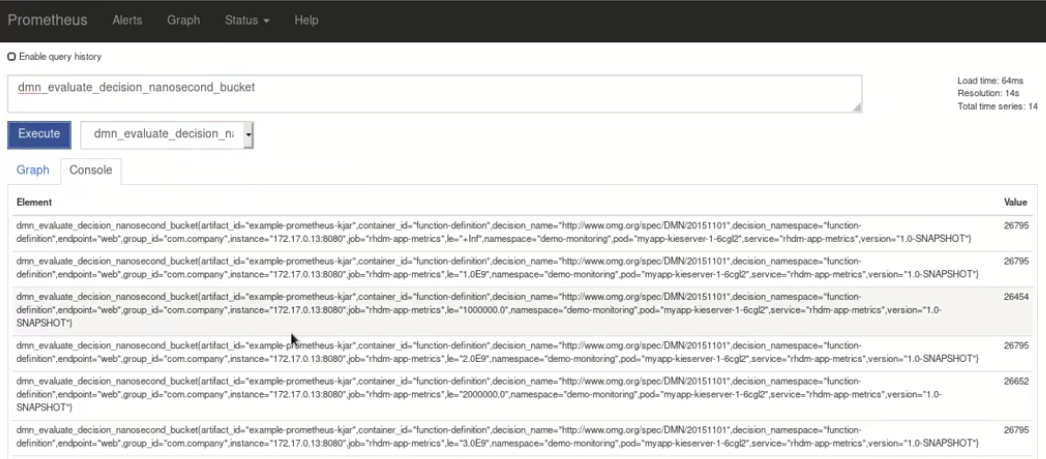
Figure 17.2. Prometheus expression browser with Process Server target
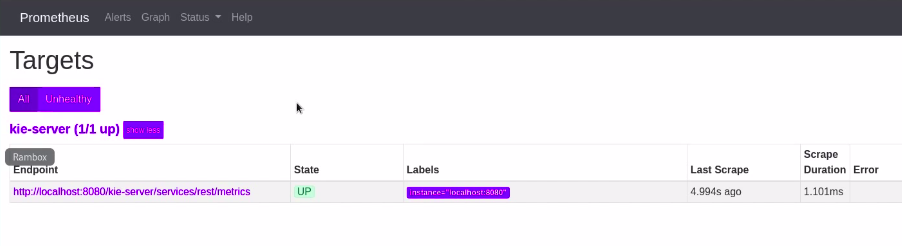
Figure 17.3. Grafana dashboard with Process Server metrics for DMN models
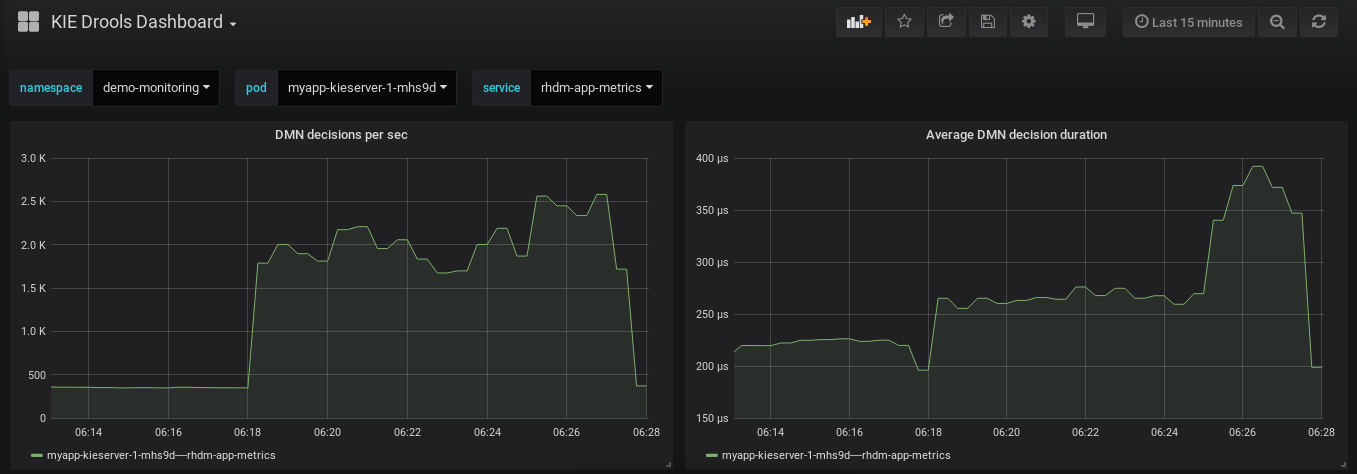
Figure 17.4. Grafana dashboard with Process Server metrics for solvers
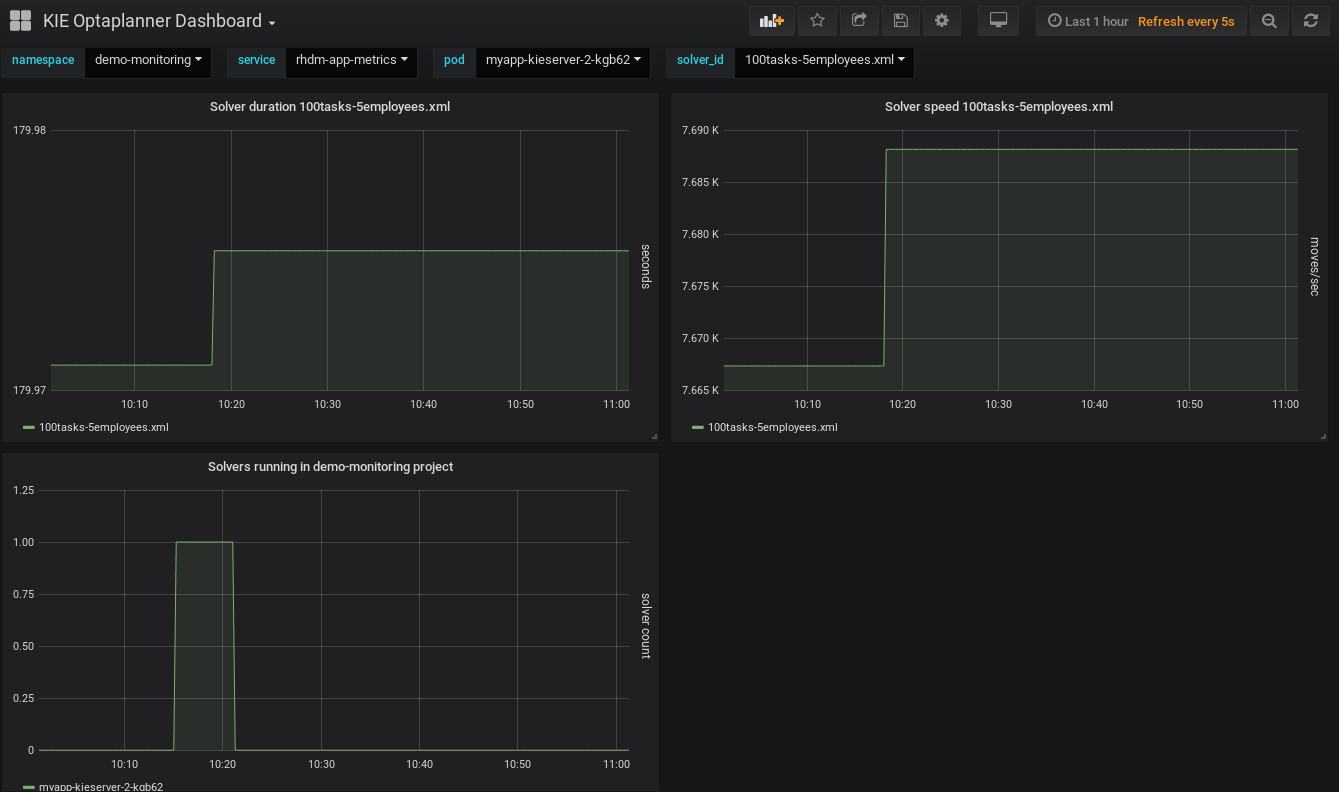
Figure 17.5. Grafana dashboard with Process Server metrics for processes, cases, and tasks
-
Authentication: Enter the user name and password of the Process Server user with the
Additional resources
17.2. Configuring Prometheus metrics monitoring for Process Server on Red Hat OpenShift Container Platform
You can configure your Process Server deployment on Red Hat OpenShift Container Platform to use Prometheus to collect and store metrics related to your business asset activity in Red Hat Process Automation Manager. For the list of available metrics that Process Server exposes with Prometheus, download the Red Hat Process Automation Manager 7.4.0 Source Distribution from the Red Hat Customer Portal and navigate to ~/rhpam-7.4.0-sources/src/droolsjbpm-integration-$VERSION/kie-server-parent/kie-server-services/kie-server-services-prometheus/src/main/java/org/kie/server/services/prometheus.
Prerequisites
- Process Server is installed and deployed on Red Hat OpenShift Container Platform. For more information about Process Server on OpenShift, see the relevant OpenShift deployment option in the Product documentation for Red Hat Process Automation Manager 7.4.
-
You have
kie-serveruser role access to Process Server. - Prometheus Operator is installed. For information about downloading and using Prometheus Operator, see the Prometheus Operator project on GitHub.
Procedure
In the
DeploymentConfigobject of your Process Server deployment on OpenShift, set thePROMETHEUS_SERVER_EXT_DISABLEDenvironment variable tofalseto enable the Prometheus extension. You can set this variable in the OpenShift web console or use theoccommand in a command terminal:oc set env dc/<dc_name> PROMETHEUS_SERVER_EXT_DISABLED=false -n <namespace>If you have not yet deployed your Process Server on OpenShift, then in the OpenShift template that you plan to use for your OpenShift deployment (for example,
rhpam74-prod-immutable-kieserver.yaml), you can set thePROMETHEUS_SERVER_EXT_DISABLEDtemplate parameter tofalseto enable the Prometheus extension.If you are using the OpenShift Operator to deploy Process Server on OpenShift, then in your Process Server configuration, set the
PROMETHEUS_SERVER_EXT_DISABLEDenvironment variable tofalseto enable the Prometheus extension:apiVersion: app.kiegroup.org/v1 kind: KieApp metadata: name: enable-prometheus spec: environment: rhpam-trial objects: servers: - env: - name: PROMETHEUS_SERVER_EXT_DISABLED value: "false"Create a
service-metrics.yamlfile to add a service that exposes the metrics from Process Server to Prometheus:apiVersion: v1 kind: Service metadata: annotations: description: RHPAM Prometheus metrics exposed labels: app: myapp-kieserver application: myapp-kieserver template: myapp-kieserver metrics: rhpam name: rhpam-app-metrics spec: ports: - name: web port: 8080 protocol: TCP targetPort: 8080 selector: deploymentConfig: myapp-kieserver sessionAffinity: None type: ClusterIPIn a command terminal, use the
occommand to apply theservice-metrics.yamlfile to your OpenShift deployment:oc apply -f service-metrics.yaml-
Create an OpenShift secret, such as
metrics-secret, to access the Prometheus metrics on Process Server. The secret must contain the "username" and "password" elements with Process Server user credentials. For information about OpenShift secrets, see the Secrets chapter in the OpenShift Developer Guide. Create a
service-monitor.yamlfile that defines theServiceMonitorobject. A service monitor enables Prometheus to connect to the Process Server metrics service.apiVersion: monitoring.coreos.com/v1 kind: ServiceMonitor metadata: name: rhpam-service-monitor labels: team: frontend spec: selector: matchLabels: metrics: rhpam endpoints: - port: web path: /services/rest/metrics basicAuth: password: name: metrics-secret key: password username: name: metrics-secret key: usernameIn a command terminal, use the
occommand to apply theservice-monitor.yamlfile to your OpenShift deployment:oc apply -f service-monitor.yamlAfter you complete these configurations, Prometheus begins collecting metrics and Process Server publishes the metrics to the REST API endpoint
http://HOST:PORT/kie-server/services/rest/metrics.You can interact with your collected metrics in the Prometheus expression browser at
http://HOST:PORT/graph, or integrate your Prometheus data source with a data-graphing tool such as Grafana.The host and port for the Prometheus expression browser location
http://HOST:PORT/graphwas defined in the route where you exposed the Prometheus web console when you installed the Prometheus Operator. For information about OpenShift routes, see the Routes chapter in the OpenShift Architecture documentation.Figure 17.6. Prometheus expression browser with Process Server metrics
Figure 17.7. Prometheus expression browser with Process Server target
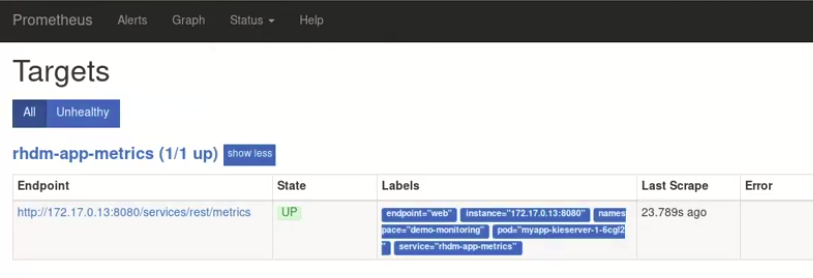
Figure 17.8. Grafana dashboard with Process Server metrics for DMN models
Figure 17.9. Grafana dashboard with Process Server metrics for solvers
Figure 17.10. Grafana dashboard with Process Server metrics for processes, cases, and tasks
Additional resources