Este conteúdo não está disponível no idioma selecionado.
Chapter 5. Retrieving Metrics
You can retrieve metrics from PCP using the CLI or the web UI interfaces. A number of CLI tools are provided with PCP, which can either output live data, or data from archived sources. The web UI interfaces are provided by the Grafana and Vector web applications. Vector connects directly to the PCP daemon, and can only display live data. Grafana reads from PCP archive files and can display data to up to 1 year old.
5.1. Retrieving Metrics via the CLI
Using the CLI tools provided with PCP, you can retrieve metrics either live, or from an archive file.
5.1.1. Retrieving Live Metrics using CLI
To output metrics on disk partition write instances, enter the following command:
pmval -f 1 disk.partitions.write
# pmval -f 1 disk.partitions.write
In this example, PCP converts the number of writes to disk partitions from a counter value, to a rate value. The -f 1 specifies that the value be abbreviated to one decimal place.
Example output
To monitor system metrics with a two second interval:
pmstat -t 2sec
# pmstat -t 2sec5.1.2. Retrieving Archived Metrics using CLI
You can use the PCP CLI tools to retrieve metrics from an archive file. To do that, add the --archive parameter and specify the archive file.
To list all metrics which were enabled when the archive file was created, enter the following command:
pminfo --archive archive_file
pminfo --archive archive_fileCopy to Clipboard Copied! Toggle word wrap Toggle overflow To confirm the host and time period covered by an archive file, enter the following command:
pmdumplog -l archive_file
# pmdumplog -l archive_fileCopy to Clipboard Copied! Toggle word wrap Toggle overflow
Examples
To list disk writes for each partition, over the time period covered by the archive file:
pmval --archive /var/log/pcp/pmlogger/satellite.example.com/20180816.00.10 \
  -f 1 disk.partitions.write
# pmval --archive /var/log/pcp/pmlogger/satellite.example.com/20180816.00.10 \
  -f 1 disk.partitions.write
Copy to Clipboard Copied! Toggle word wrap Toggle overflow To list disk write operations per partition, with a two second interval, between the time period 14:00 and 14:15:
pmval --archive /var/log/pcp/pmlogger/satellite.example.com/20180816.00.10 \
  -d -t 2sec \
  -f 3 disk.partitions.write \
  -S @14:00 -T @14:15
# pmval --archive /var/log/pcp/pmlogger/satellite.example.com/20180816.00.10 \
  -d -t 2sec \
  -f 3 disk.partitions.write \
  -S @14:00 -T @14:15
Copy to Clipboard Copied! Toggle word wrap Toggle overflow To list average values of all performance metrics, including the time of minimum/maximum value and the actual minimum/maximum value, between the time period 14:00 and 14:30. To output the values in tabular formatting:
Copy to Clipboard Copied! Toggle word wrap Toggle overflow To list system metrics stored in an archive, starting from 14:00. The metrics are displayed in a format similar to the
toptool.pcp --archive /var/log/pcp/pmlogger/satellite.example.com/20180816.00.10 \ -S @14:00 \ atop
# pcp --archive /var/log/pcp/pmlogger/satellite.example.com/20180816.00.10 \
  -S @14:00 \
  atop
Copy to Clipboard Copied! Toggle word wrap Toggle overflow
5.2. Retrieving Metrics via the Web UI
To access the web UI interfaces to PCP metrics, open the URL of either the following web applications:
- Vector
- http://satellite.example.com:44323/vector
- Grafana
- http://satellite.example.com:44323/grafana
Both applications provide a dashboard-style view, with default widgets displaying the values of metrics. You can add and remove metrics to suit your requirements. Also, you can select the time span shown for each widget. Only Grafana provides the option of selecting a custom time range from the archived metrics.
For more details on using Grafana, see the Grafana Labs web site. For more details on using Vector, see the Vector web site.
Figure 5.1. Example Grafana dashboard
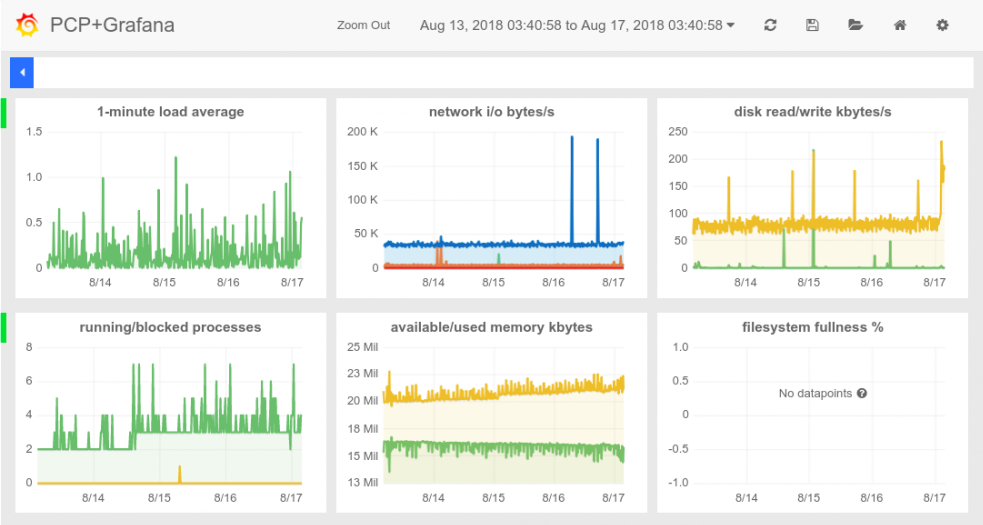
Figure 5.2. Example Vector dashboard
