此内容没有您所选择的语言版本。
Chapter 3. Monitoring CodeReady Workspaces
This chapter describes how to configure CodeReady Workspaces to expose metrics and how to build an example monitoring stack with external tools to process data exposed as metrics by CodeReady Workspaces.
3.1. Enabling and exposing CodeReady Workspaces metrics
This section describes how to enable and expose CodeReady Workspaces metrics.
Procedure
-
Set the
CHE_METRICS_ENABLED=trueenvironment variable, which will expose the8087port as a service on the che-master host.
When Red Hat CodeReady Workspaces is installed from the OperatorHub, the environment variable is set automatically if the default CheCluster CR is used:
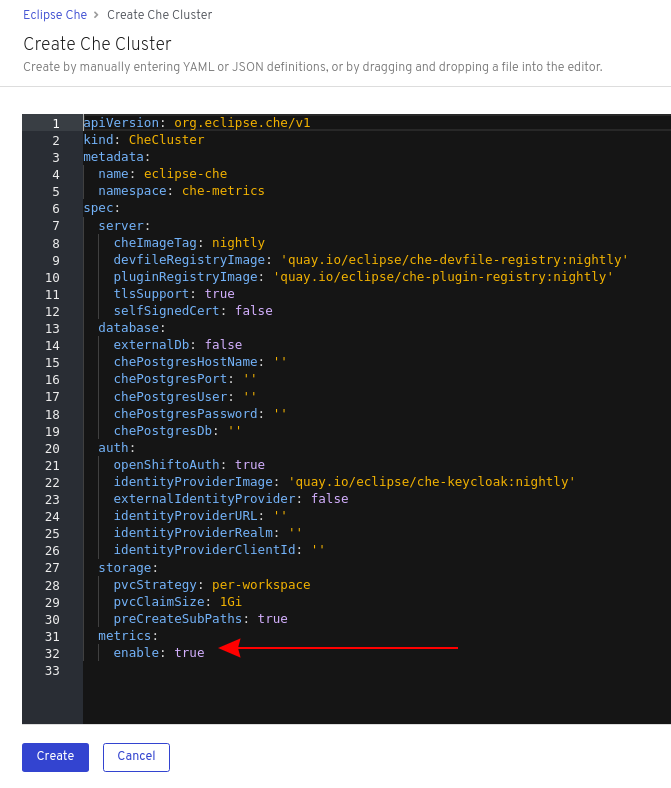
spec:
  metrics:
    enable: true
spec:
  metrics:
enable: trueThis section describes how to use the Prometheus monitoring system to collect, store and query metrics about CodeReady Workspaces.
Prerequisites
-
CodeReady Workspaces is exposing metrics on port
8087. See Enabling and exposing codeready-workspaces metrics. -
Prometheus 2.9.1 or higher is running. The Prometheus console is running on port
9090with a corresponding service and route. See First steps with Prometheus.
Procedure
Configure Prometheus to scrape metrics from the
8087port:Prometheus configuration example
Copy to Clipboard Copied! Toggle word wrap Toggle overflow - 1
- Rate, at which a target is scraped.
- 2
- Rate, at which recording and alerting rules are re-checked (not used in the system at the moment).
- 3
- Resources Prometheus monitors. In the default configuration, there is a single job called
che-host, which scrapes the time series data exposed by the CodeReady Workspaces server. - 4
- Scrape metrics from the
8087port.
Verification steps
Use the Prometheus console to query and view metrics.
Metrics are available at:
http://<che-server-url>:9090/metrics.For more information, see Using the expression browser in the Prometheus documentation.
Additional resources
3.3. Extending CodeReady Workspaces monitoring metrics
This section describes how to create a metric or a group of metrics to extend the monitoring metrics that CodeReady Workspaces is exposing.
There are two major modules for metrics:
-
che-core-metrics-core— contains core metrics module -
che-core-api-metrics— contains metrics that are dependent on core CodeReady Workspaces components, such as workspace or user managers
Procedure
Create a class that extends the
MeterBinderclass. This allows to register the created metric in the overriddenbindTo(MeterRegistry registry)method.The following is an example of a metric that has a function that supplies the value for it:
Example metric
Copy to Clipboard Copied! Toggle word wrap Toggle overflow Alternatively, the metric can be stored with a reference and updated manually in some other place in the code.
Additional resources