此内容没有您所选择的语言版本。
Chapter 12. Coverage reports for test scenarios
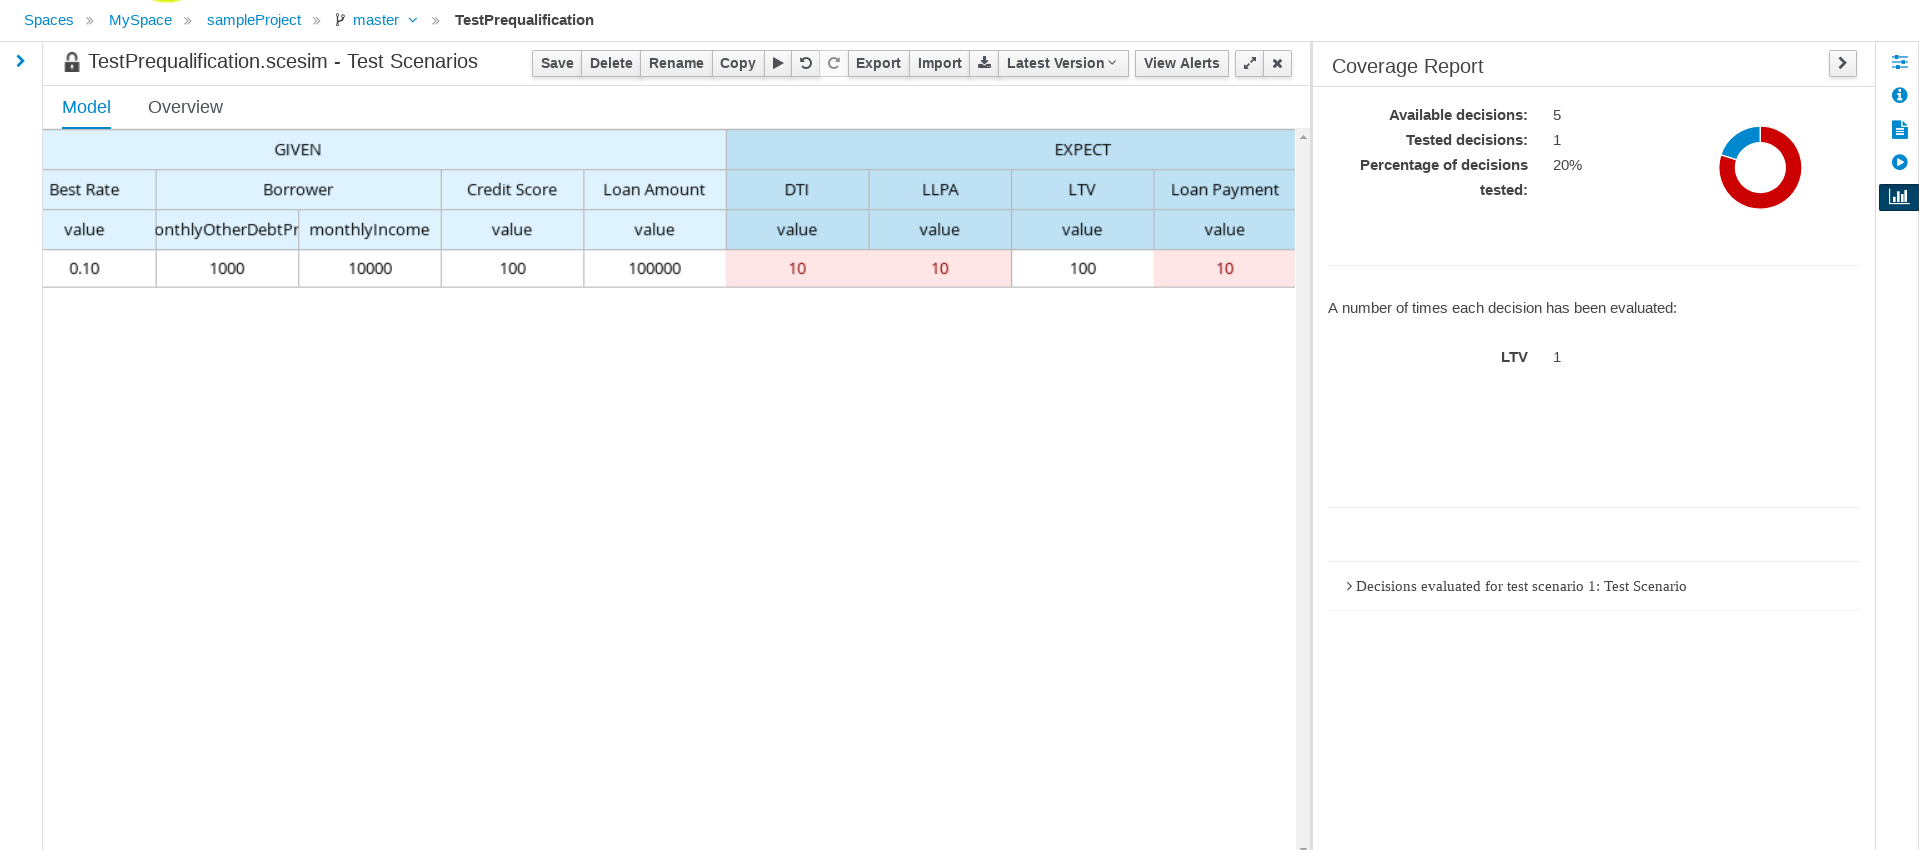
The test scenario designer provides a clear and coherent way of displaying the test coverage statistics using the Coverage Report tab from the right side of the test scenario designer.
In DMN-based test scenarios, the Coverage Report tab contains the detailed information about the number of available decisions, number of executed decisions, percentage of executed decisions, how many times each decision has been evaluated, and which decisions are evaluated for each defined test scenario in the table. The percentage of the executed decisions is also represented as a pie chart in the same Coverage Report tab.
The coverage report is currently not supported for rule-based test scenario.
Coverage report for test scenarios
Follow the procedure below to generate a coverage report for DMN-based test scenarios.
Prerequisites
- The DMN-based test scenario template has been created for the selected test scenario. For more information about creating DMN-based test scenarios, see Section 5.1, “Creating a test scenario template for DMN-based test scenarios”.
- The individual test scenarios have been defined. For more information about defining a test scenario, see Chapter 6, Defining a test scenario.
Procedure
- Open the DMN-based test scenarios in the test scenario designer.
- Run the defined test scenarios.
- Click Coverage Report on the right of the test scenario designer to display the test coverage statistics.