此内容没有您所选择的语言版本。
4.3. CONTROL/MONITORING
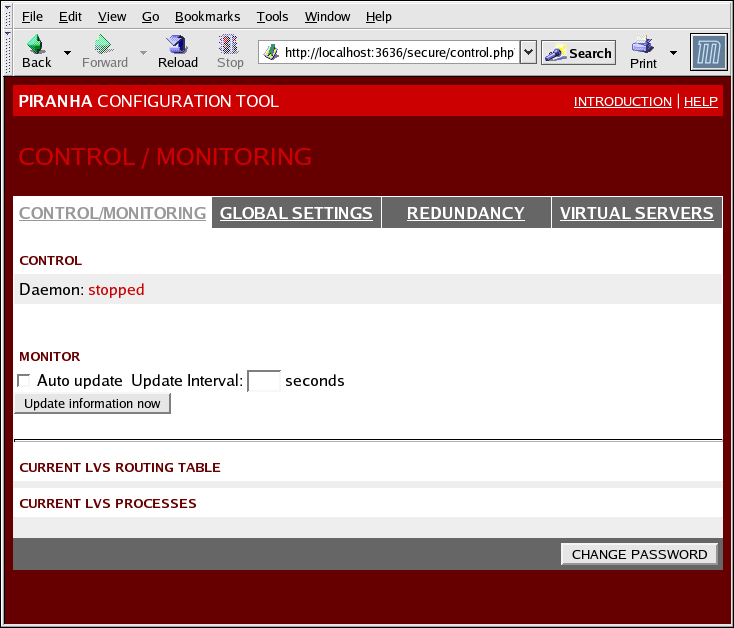
The CONTROL/MONITORING Panel presents the a limited runtime status of the Load Balancer Add-On. It displays the status of the
pulse daemon, the LVS routing table, and the LVS-spawned nanny processes.
Note
The fields for CURRENT LVS ROUTING TABLE and CURRENT LVS PROCESSES remain blank until you actually start the Load Balancer Add-On, as shown in Section 4.8, “Starting the Load Balancer Add-On”.

Figure 4.2. The CONTROL/MONITORING Panel
- Auto update
- The status display on this page can be updated automatically at a user configurable interval. To enable this feature, click on the Auto update check box and set the desired update frequency in the Update frequency in seconds text box (the default value is 10 seconds).It is not recommended that you set the automatic update to an interval less than 10 seconds. Doing so may make it difficult to reconfigure the Auto update interval because the page will update too frequently. If you encounter this issue, simply click on another panel and then back on CONTROL/MONITORING.The Auto update feature does not work with all browsers, such as Mozilla.
- You can manually update the status information manually by clicking this button.
- Clicking this button takes you to a help screen with information on how to change the administrative password for the Piranha Configuration Tool.