此内容没有您所选择的语言版本。
Chapter 6. To Debug a Routing Context
This tutorial shows how to use the Camel debugger for only a locally running routing context. The routing context and each node with a breakpoint set must have a unique ID. The tooling automatically assigns a unique ID to the camelContext element and to components and patterns dropped on the canvas, but you can change these IDs to customize your project.
Goals
In this tutorial you will:
- In the Design tab, set breakpoints on the nodes of interest in Route1
- Switch to Route2, and set breakpoints on the nodes of interest
- Invoke the Camel debugger
- Step through the route, examining route and message variables as they change
- Step through the route again, changing the value of message variables and observing the effects
Prerequisites
To complete this tutorial you will need the CBRroute project you updated in Chapter 5, To Add Another Route to the CBR Routing Context.
If you skipped any tutorial after Chapter 2, To Create a New Route you can use the prefabricated blueprintContext6.xml file to work through this tutorial (for details, see Chapter 1, Using the Fuse Tooling Resource Files).
Setting breakpoints
You can set both conditional and unconditional breakpoints, but in this tutorial, you will set unconditional breakpoints only.
-
If necessary, open your
CBRroute/src/main/resources/OSGI-INF/blueprint/blueprint.xmlin the route editor. -
In Project Explorer, expand
Camel Contexts/src/main/resources/OSGI-INF/blueprintto expose both route entries. -
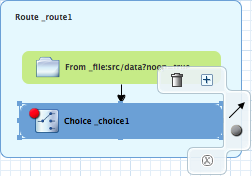
Double-click the
Route_route1entry to switch focus toRoute_route1in the Design tab. On the canvas, select the
Choice_choice1node, and then click its icon to set an unconditional breakpoint:
Expand 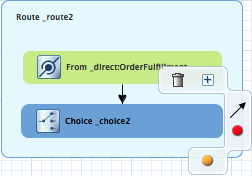

 Note
NoteIn the route editor, you can disable or delete a specific breakpoint by clicking the node’s
 icon or its
 icon, respectively. You can delete all set breakpoints by right-clicking the canvas and selecting Delete all breakpoints.
Repeat [setBPstep] to set an unconditional breakpoint on the following
Route_Route1nodes:-
Log_log1 -
SetHeader_setHeader1 -
To_Invalid -
Log_log2 -
SetHeader_setHeader2 -
To_Fulfill
-
-
In Project Explorer, double-click
Route_route2undersrc/main/resources/OSGI-INF/blueprintto openRoute_route2on the canvas. Repeat [setBPstep] to set an unconditional breakpoint on the following
Route_Route2nodes:-
Choice_choice2 -
SetHeader_setHead_usa -
Log_usa -
To_US -
SetHeader_setHead_uk -
Log_uk -
To_UK -
SetHeader_setHead_ger -
Log_ger -
To_GER -
SetHeader_setHead_fr -
Log_fr -
To_FR
-
Stepping through the CBRroute routing context
You can step through the routing context in two ways:
-
Step over (
 ) - Jumps to the next node of execution in the routing context, regardless of breakpoints.
-
Resume (
 ) - Jumps to the next active breakpoint in the routing context.
You can temporarily narrow then later re-expand the debugger’s focus by disabling and re-enabling the breakpoints you set in the routing context. This enables you, for example, to focus on problematic nodes in your routing context. To do so, open the Breakpoints tab and clear the check box of each breakpoint you want to temporarily disable. Then use
to step through the route. The debugger will skip over the disabled breakpoints.
-
In Project Explorer, expand the root node
CBRrouteto expose theblueprint.xmlfile in theCamel Contextsfolder. Right-click the
blueprint.xmlfile to open its context menu, and then click menu:Debug As…[ > > Local Camel Context > ].The Camel debugger suspends execution at the first breakpoint it encounters and asks whether you want to open Debug perspective now:
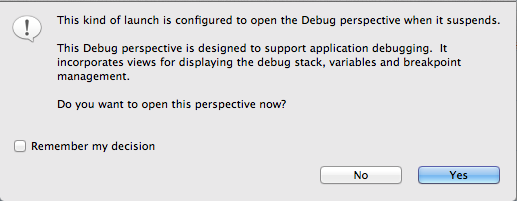
Click .
NoteIf you click , the confirmation pane appears several more times. After the third refusal, it disappears, and the Camel debugger resumes execution. To interact with the debugger at this point, you need to open the Debug perspective by clicking menu:Window[ > > Open Perspective > > Debug > ].
Debug perspective opens with the routing context suspended at
_choice1 in Route1 [blueprint.xml]as shown in the Debug view: Note
NoteBreakpoints are held for a maximum of five minutes before the debugger automatically resumes, moving on to the next breakpoint or to the end of the routing context, whichever comes next.
In the Variables view, expand the nodes to expose the variables and values available for each node.
As you step through the routing context, the variables whose values have changed since the last breakpoint are highlighted in yellow. You may need to expand the nodes at each breakpoint to reveal variables that have changed.
Click
to step to the next breakpoint, _log2 in Route1 [blueprint.xml]: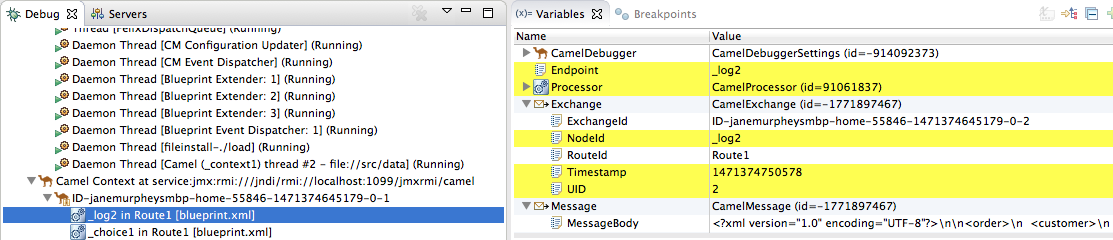
-
Expand the nodes in the Variables view to examine the variables that have changed since the last breakpoint at
_choice1 in Route1 [blueprintxt.xml]. Click
to step to the next breakpoint, _setHeader2 in Route1 [blueprint.xml].Examine the variables that changed since the breakpoint at
_log2 in Route1 [blueprint.xml].In the Debug view, click
_log2 in Route1 [blueprint.xml]to populate the Variables view with the variable values from the breakpoint_log2 in Route1 [blueprint.xml]for a quick comparison.In the Debug view, you can switch between breakpoints within the same message flow to quickly compare and monitor changing variable values in the Variables view.
NoteMessage flows can vary in length. For messages that transit the
InvalidOrdersbranch ofRoute_route1, the message flow is short. For messages that transit theValidOrdersbranch ofRoute_route1, which continues on toRoute_route2, the message flow is longer.Continue stepping through the routing context. When one message completes the routing context and the next message enters it, the new message flow appears in the Debug view, tagged with a new breadcrumb ID:
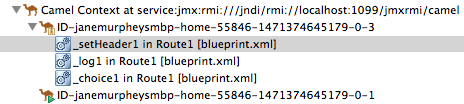
In this case,
ID-janemurpheysmbp-home-55846-1471374645179-0-3identifies the second message flow, corresponding tomessage2.xmlhaving entered the routing context. Breadcrumb IDs are incremented by 2.NoteExchange and Message IDs are identical and remain unchanged throughout a message’s passage through the routing context. Their IDs are constructed from the message flow’s breadcrumb ID, and incremented by 1. So, in the case of
message2.xml, itsExchangeIdandMessageIdareID-janemurpheysmbp-home-55846-1471374645179-0-4.When
message3.xmlenters the breakpoint_choice1 in Route_route1 [blueprint.xml], examine the Processor variables. The values displayed are the metrics accumulated formessage1.xmlandmessage2.xml, which previously transited the routing context: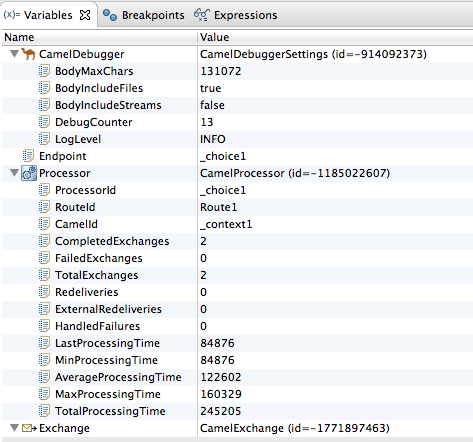
Timing metrics are in milliseconds.
-
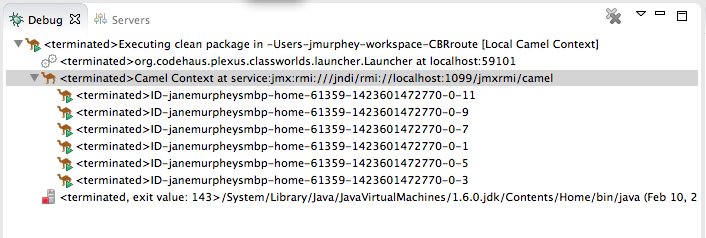
Continue stepping each message through the routing context, examining variables and console output at each processing step. When
message6.xmlenters the breakpointTo_GER in Route2 [blueprint.xml], the debugger begins shutting down the breadcrumb threads. In the Menu bar, click
 to terminate the Camel debugger. This will cause the Console to terminate, but you will have to manually clear the output.
Note
to terminate the Camel debugger. This will cause the Console to terminate, but you will have to manually clear the output.
NoteWith a thread or endpoint selected under the Camel Context node in the Debug view, you need to click
twice - first to terminate the thread or endpoint and second to terminate the Camel Context, thus the session.
In the Menu bar, right-click
 to open the context menu, and then select Close to close Debug perspective.
Doing so automatically returns you to perspective from which you launched the Camel debugger.
In Project Explorer, open the project’s context menu, and select Refresh to refresh the display.
NoteIf you terminated the session prematurely, before all messages transited the routing context, you might see, under the
CBRroute/src/datafolder, a message like this:message3.xml.camelLock. You need to remove it before you run the debugger on the project again. To do so, double-click the.camelLockmessage to open its context menu, and then select Delete. When asked, click to confirm deletion.Expand the
CBRroute/target/messages/* directories to check that the messages were delivered to their expected destinations: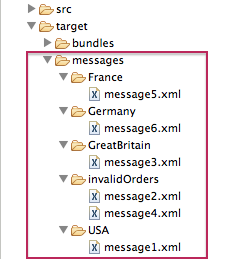
- Leave the routing context as is, with all previous breakpoints set and enabled.
Changing the value of a variable
In this session, you will add variables to a watch list to easily check how their values change as messages pass through the routing context. You will also change the value of a variable in the body of two messages and observe how the change affects each message’s route through the routing context.
-
Follow [startDebugger1] through [startDebugger3] in the section called “Stepping through the CBRroute routing context” to rerun the Camel debugger on the
CBRrouteproject. With
message1stopped at the first breakpoint,_choice1 in Route1 [blueprint.xml], add the variablesNodeIdandRouteId(in theExchangecategory) andMessageBodyandCamelFileName(in theMessagecategory) to the watch list.For each of the four variables:
- In the Variables view, expand the appropriate category to expose the target variable:
Right-click the variable (in this case,
NodeIdin theExchangecategory) to open the context menu and select Watch: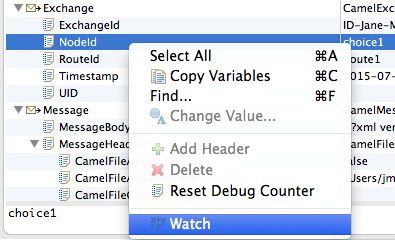
The Expressions tab opens, listing the variable you selected to watch:
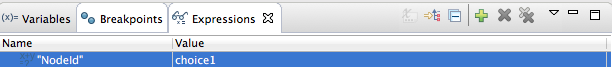
- Repeat [selectVariable] for each of the three remaining variables.
- Switch back to the Variables view.
-
Step
message1through the routing context until it reaches the fourth breakpoint,_Fulfill in Route1 [blueprint.xml]. -
In the Variables view, expand the
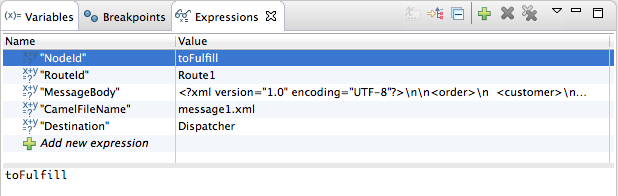
Messagecategory. Repeat [selectVariable] to add the variable
Destinationto the watch list.The Expressions view should now contain these variables:
 Note
NoteThe pane below the list of variables displays the value of the selected variable.
NoteThe Expressions view retains all variables you add to the list until you explicitly remove them.
-
Step
message1through the rest of the routing context. -
Stop
message2at_choice1 in Route1 [blueprint.xml]. -
In the Variables view, expand the
Messagecategory to expose theMessageBodyvariable. Right-click
MessageBodyto open its context menu, and select Change Value…: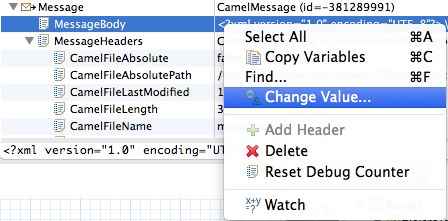
Change the value of
quantityfrom 3 to 2: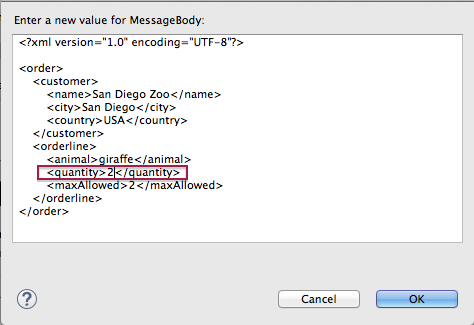
This changes the in-memory value only.
- Click .
Switch to the Expressions view, and select the
MessageBodyvariable.The pane below the list of variables displays the entire body of
message2, making it easy to check the current value of order items: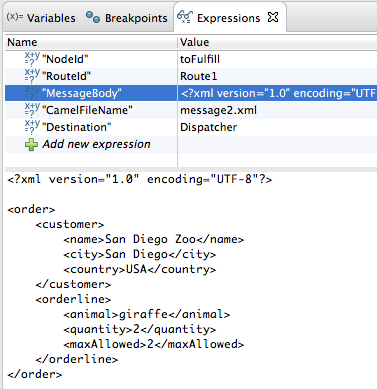 Note
NoteCreating a watch list makes it easy for you to quickly check the current value of multiple variables of interest.
Click
to step to the next breakpoint.
Instead of following the branch leading to
To_Invalid,message2now follows the branch leading toTo_FulfillandRoute_route2: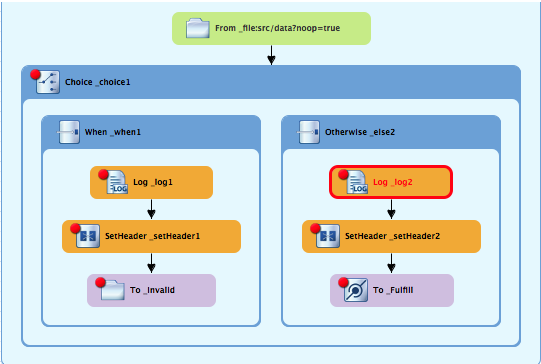
-
Step
message2through the routing context, checking the Debug view, the Variables view, and the Console output at each step. -
Stop
message3at_choice1 in Route1 [blueprint.xml]. Switch to the Breakpoints view, and disable all breakpoints (13) listed below
_choice1: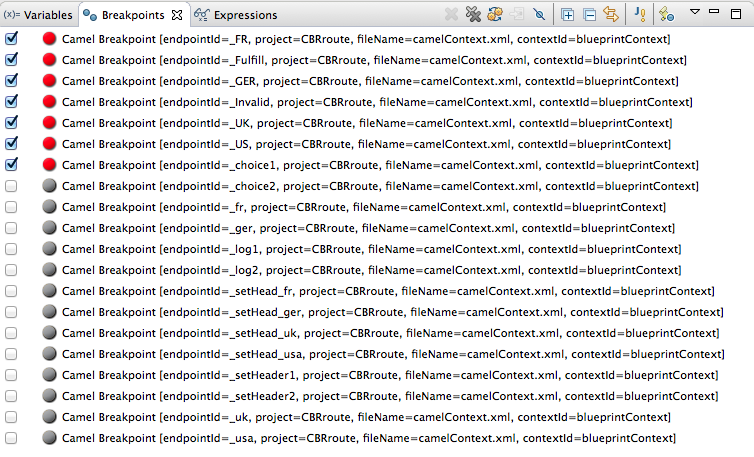
Click
to step to the next breakpoint:
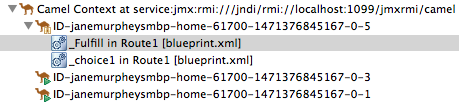
The debugger jumps to
_FulFill in Route1 [blueprint.xml].Click
again to step to the next breakpoint:
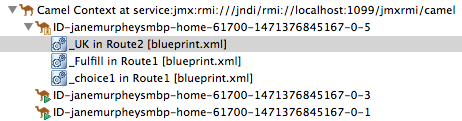
The debugger jumps to
_UK in Route2 [blueprint.xml].- In the Breakpoints view, re-enable all disabled breakpoints.
- Switch back to the Variables view.
-
Click
to step to the next breakpoint, and stop
message4at_choice1 in Route1 [blueprint.xml]. -
Right-click
MessageBodyto open its context menu, and select Change Value…. Change the value of
quantityfrom 5 to 4: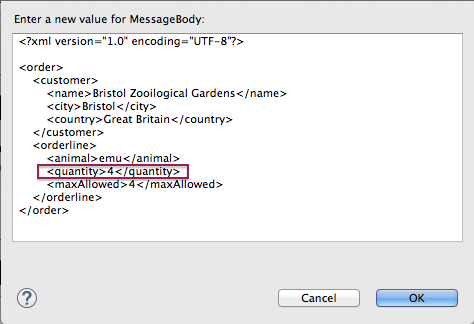
- Click .
-
Switch to the Expressions view, and select the
MessageBodyvariable to check the value ofquantityin the body ofmessage4. -
Repeat [varChgRestart1] and [varChgRestart2] to step
message4through the routing context. -
Click
repeatedly to quickly step
message5andmessage6through the routing context. In the tool bar, click
to terminate the Camel debugger:
This will also cause the Console to terminate, but you will have to click its
 button to clear the output.
In the Menu bar, right-click
to open the context menu, and then select Close to close Debug perspective.
Doing so automatically returns you to the perspective from which you launched the Camel debugger.
- In Project Explorer, open the project’s context menu, and select Refresh to refresh the display.
Expand the
CBRroute/target/messages/* directories to check whether the messages were delivered as expected: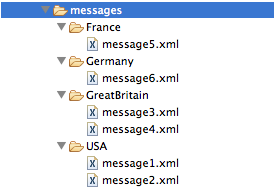
You should see that no messages were sent to the
invalidOrders. Instead,message2.xmlshould appear in theUSAfolder, andmessage4.xmlshould appear theGreatBritainfolder.
Next steps
Next you will trace messages through your routing context to see where you can optimize and fine tune your routing context’s performance, as described in Chapter 7, To Trace a Message Through a Route.