此内容没有您所选择的语言版本。
4.4. Extended Example: HTTP Metrics
This example plug-in is written for the agent to connect to an HTTP server to monitor the web server itself for performance or availability. This plug-in performs two tasks:
- Issue a GET or HEAD request to the base URL for the given server.
- Collect both the HTTP return code and the response time as a resource trait.
Figure 4.2. Basic Agent Plug-in Scenario

NOTE
For simplicity, this plug-in is written for an agent that is running on the same machine as a JBoss ON server.
The HTTP metrics plug-in is designed to run a server and a child service to collect two monitoring metrics. This requires two Java files which define the plug-in behavior and the behavior of a discovery component that the plug-in requires to locate URLs.
As with all agent plug-ins, this example also has a
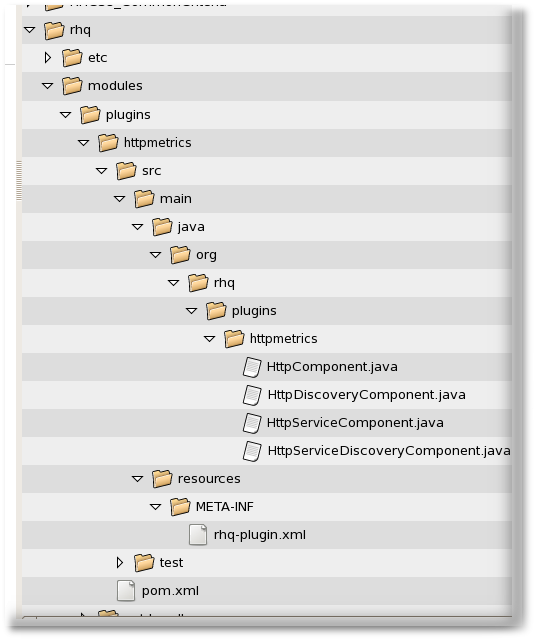
rhq-plugin.xml file as the plug-in descriptor, which is required for JBoss ON to recognize the plug-in configuration. The plug-in is built as a maven project, so it has a pom.xml file, although that is not a requirement, since any properly configured JAR file can be deployed as an agent plug-in.
Figure 4.3. Directory Layout of an Agent Plug-in Project
The plug-in descriptor is where everything is glued together. The first part of the plug-in descriptor defines the basic information about the plug-in, like its name, version number, and schema.
Example 4.3. Basic Plug-in Information
The
package attribute identifies the Java package for Java class names that are referenced in the plug-in configuration in the descriptor.
The HTTP Metrics plug-in is defines as a server which runs a child resource. Services cannot run on their own, so defining the HTTP Metrics resource as a server first allows multiple services to be launched off of it.
Example 4.4. Server Definition
<server name="HttpCheck"
   description="Httpserver pinging"
   discovery="HttpDiscoveryComponent"
   class="HttpComponent">
<server name="HttpCheck"
   description="Httpserver pinging"
   discovery="HttpDiscoveryComponent"
   class="HttpComponent">
The next step is to add a service element as a child of the server. To differentiate between the server and the service operations, the service has its own discovery and plug-in components, meaning its own
.java files and classes. The supportsManualAdd option sells JBoss ON that the HTTP services can be added manually through the UI, which is important for administration.
Example 4.5. Service Definition
<service name="HttpServiceCheck"
         discovery="HttpServiceDiscoveryComponent"
         class="HttpServiceComponent"
         description="One remote Http Server"
         supportsManualAdd="true"
<service name="HttpServiceCheck"
         discovery="HttpServiceDiscoveryComponent"
         class="HttpServiceComponent"
         description="One remote Http Server"
         supportsManualAdd="true"
The middle of the <service> element defines the plug-in properties that are configured through the UI. This can be simple (setting a simple string for the URL).
Example 4.6. Simple Configuration Properties
<plugin-configuration>
   <c:simple-property name="url"
     type="string"
     required="true" />
</plugin-configuration>
<plugin-configuration>
   <c:simple-property name="url"
     type="string"
     required="true" />
</plugin-configuration>
The properties can be more advanced and allow specific values for the protocol, port, and hostname or IP address, depending on how much information needs to be configured.
Example 4.7. Complex Configuration Properties
The last part of the <service> element contains the metrics that are configured for the HTTP Metrics plug-in. The first metric, for the response time, collects a numeric data type. The status metric collects a trait data type. (JBoss ON is intelligent enough to only store changed traits to conserve space.)
Example 4.8. Defined Metrics
The attributes available to define the metric are defined in the agent plug-in XML schema. The attributes used in this example are listed in Table 4.5, “metric Attributes”.
When defining metrics, values that form part of a larger data structure, such as an array of values, need to be deconstructed into individual values before they can be monitored.
| Attribute | Description |
|---|---|
| property | Gives the unique name of this metric. The name can also be obtained in the code using the getName() call. |
| description | Gives a human readable description of the metric. |
| displayName | Gives the name that gets displayed in the JBoss ON UI. |
| data type | Sets the type of metric, such as numeric or trait. |
| units | The measurement units to use for numerical data type. |
| displayType | If the value is set to summary, the metric is displayed in the indicator charts and collected by default. |
| defaultOn | Sets whether the metric collected by default. |
| measurementType |
Sets what characteristics the numerical values have. The options are trends up, trends down, or dynamic. For both trends metrics, the system automatically creates additional per minute metrics.
Values that form part of a larger data structure, such as an array of values, need to be deconstructed into individual values before they can be monitored.
|
Two Java files define how to discover the HTTP metrics server and any URL defined to be monitored.
The first Java file,
HttpDiscoveryComponent.java, discovers the HTTP metrics server. The discovery component is called by the InventoryManager in the agent to discover resources. This can be done by a process table scan, querying the MBeanServer, or other means. Whatever the method, the most important thing is that the discovery component returns the same unique key each time for the same resource. The DiscoveryComponent needs to implement org.rhq.core.pluginapi.inventory.ResourceDiscoveryComponent and you need to implement discoverResources().
Basically, this retrieves a list of resources discovered by the process scan and creates the details about the discovered resource. Using ProcessInfo gets more information about the process and can be used to exclude certain types of discovered resources from the final list.
Example 4.9. HttpDiscoveryComponent.java
The service discovery component (defined in
HttpServiceDiscoveryComponent.java) relies on information passed through the GUI to configure its resources, rather than a discovery scan. The initial definition in the Java file is similar to the one for the server discovery, but this definition has an additional List<Configuration> childConfigs which processes the information that is passed through the UI. This pulls the information for the required url information supplied by the user.
Example 4.10. Service Discovery
The list of URLs that are configured are processed and added as a resource with the resource name, description, type, and (critically) the unique resource key that is used by the discovery process.
Example 4.11. Listing HTTP URL Resources
The plug-in component is the part of the plug-in that does the work after the discovery has finished.
For the server component (
HttpComponent.java), the plug-in is pretty simple. The component only implements placeholder methods from the ResourceComponent interface to set the server availability. Setting the availability to UP automatically allows the resource component to start.
Example 4.12. Server Availability After Discovery
    public AvailabilityType getAvailability() {
        return AvailabilityType.UP;
    }
    public AvailabilityType getAvailability() {
        return AvailabilityType.UP;
    }
The service component (
HttpServiceComponent.java) is more complex because it must carry out the operations defined in the plug-in descriptor.
Each of the basic functions in the plug-in descriptor is implemented through an appropriate agent facet. All of the gent facets are listed in Section 6.2, “Plug-in Facets”. The HTTP metrics component specifically maps the <metric> element in the descriptor to the
MeasurementFacet.
Each facet has its own methods to implement. For monitoring and other operations that require processing metrics, the
MeasurementFacet implements the following method:
getValues(MeasurementReport report, Set metrics)
getValues(MeasurementReport report, Set metrics)
The
MeasurementReport passed in is where the monitoring results are added. The metrics value is a list of metrics for which data should be gathered. All of this information can be defined in the <metrics> element or in the UI configuration.
So the next part is the plug-in component to do the work.
To monitor things, the
getValues() method from the MeasurementFacet must be implemented, but that's not the first step to take. A resource cannot be discovered if the resource is down, so the first step is to set a start value to start the service from ResourceContext and give it an availability of UP.
Example 4.13. Service Resource Availability
Once the service is started, then the
getValues() can be implemented. This actually collects the monitoring data from the given URLs.
Example 4.14. Implementing getValues()
The final step is to process the information. Implementing the
getData() method in the MeasurementFacet loops the incoming request to see which metric is wanted and then to supply the collected value. Depending on the type of data, the data may be to be wrapped into the correct MeasurementData* class.
Example 4.15. Implementing getData()
This implementation for the HTTP Metrics plug-in is very simple. It opens a URL connection, takes the time it takes to connect, and gets the status code. That's all.