此内容没有您所选择的语言版本。
Chapter 10. Enabling Volume Metrics
To enable volume metrics for glusterfs plugin in order to collect the statistics of GlusterFS PVs, set up Prometheus, a monitoring toolkit. You can use Prometheus to visualize metrics and alerts for OpenShift Container Platform system resources.
For more information on how to setup Prometheus, see https://access.redhat.com/documentation/en-us/openshift_container_platform/3.10/html-single/configuring_clusters/#openshift-prometheus
Following is the list of different metrics of the PVs that can be viewed on Prometheus:
kubelet_volume_stats_available_bytes: Number of available bytes in the volume.kubelet_volume_stats_capacity_bytes: Capacity in bytes of the volume.kubelet_volume_stats_inodes: Maximum number of inodes in the volume.kubelet_volume_stats_inodes_free: Number of free inodes in the volume.kubelet_volume_stats_inodes_used: Number of used inodes in the volume.kubelet_volume_stats_used_bytes: Number of used bytes in the volume.heketi_cluster_count: Number of clusters.heketi_device_brick_count: Number of bricks on device.heketi_device_count: Number of devices on host.heketi_device_free: Amount of free space available on the device.heketi_device_size: Total size of the device.heketi_device_used: Amount of space used on the device.heketi_nodes_count: Number of nodes on the cluster.heketi_up: Verifies if heketi is running.heketi_volumes_count: Number of volumes on cluster.
Viewing Metrics
To view any metrics:
- Add the metrics name in Prometheus, and click Execute.
- In the Graph tab, the value for the metrics for the volume is displayed as a graph.For example, in the following image, to check the available bytes,
kubelet_volume_stats_available_bytesmetric is added to the search bar on Prometheus. On clickingExecute, the available bytes value is depicted as a graph. You can hover the mouse on the line to get more details. (To view the image in detail, right-click and select View Image.)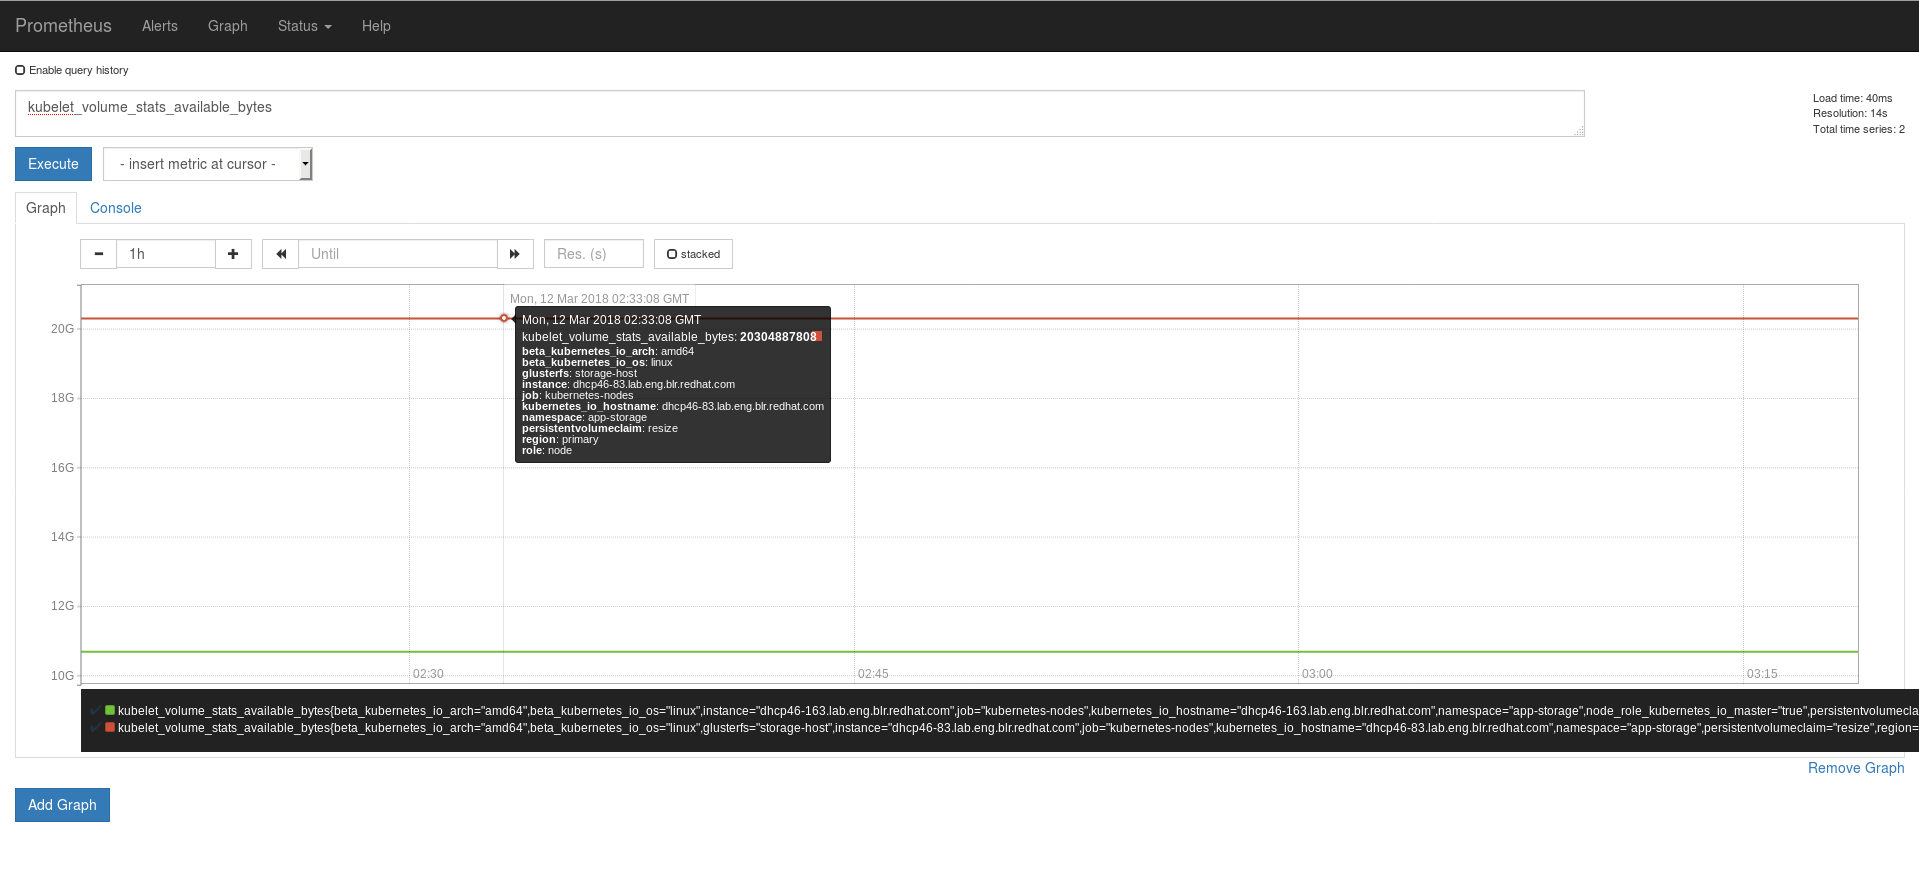
Viewing Heketi Metrics
To view Heketi metrics on Prometheus, execute the following commands:
- Add annotations to the
heketi-storage.# oc annotate svc heketi-storage prometheus.io/scheme=http # oc annotate svc heketi-storage prometheus.io/scrape=true# oc describe svc heketi-storage Name: heketi-storage Namespace: app-storage Labels: glusterfs=heketi-storage-service heketi=storage-service Annotations: description=Exposes Heketi service prometheus.io/scheme=http prometheus.io/scrape=true Selector: glusterfs=heketi-storage-pod Type: ClusterIP IP: 172.30.90.87 Port: heketi 8080/TCP TargetPort: 8080/TCP Endpoints: 172.18.14.2:8080 Session Affinity: None - Add the
app-storagenamespace for the heketi service in the Prometheus configmap.# oc get cm prometheus -o yaml -n openshift-metrics .... - job_name: 'kubernetes-service-endpoints' tls_config: ca_file: /var/run/secrets/kubernetes.io/serviceaccount/ca.crt # TODO: this should be per target insecure_skip_verify: true kubernetes_sd_configs: - role: endpoints relabel_configs: # only scrape infrastructure components - source_labels: [__meta_kubernetes_namespace] action: keep regex: 'default|logging|metrics|kube-.+|openshift|openshift-.+|app-storage' - Restart the
prometheus-0pod to query the Heketi metrics in Prometheus.