此内容没有您所选择的语言版本。
Chapter 10. Topology viewer
The topology viewer enables you to view node type, node health, and specific details about each node if you already have a mesh topology deployed.
To access the topology viewer from the automation controller UI, you must have System Administrator or System Auditor permissions.
For more information about automation mesh on a VM-based installation, see the Red Hat Ansible Automation Platform automation mesh guide for VM-based installations.
For more information about automation mesh on an operator-based installation, see the Red Hat Ansible Automation Platform automation mesh for operator-based installations.
10.1. Accessing the topology viewer
Use the following procedure to access the topology viewer from the automation controller UI.
Procedure
From the navigation panel, select
. The Topology View opens and displays a graphical representation of how each receptor node links together. 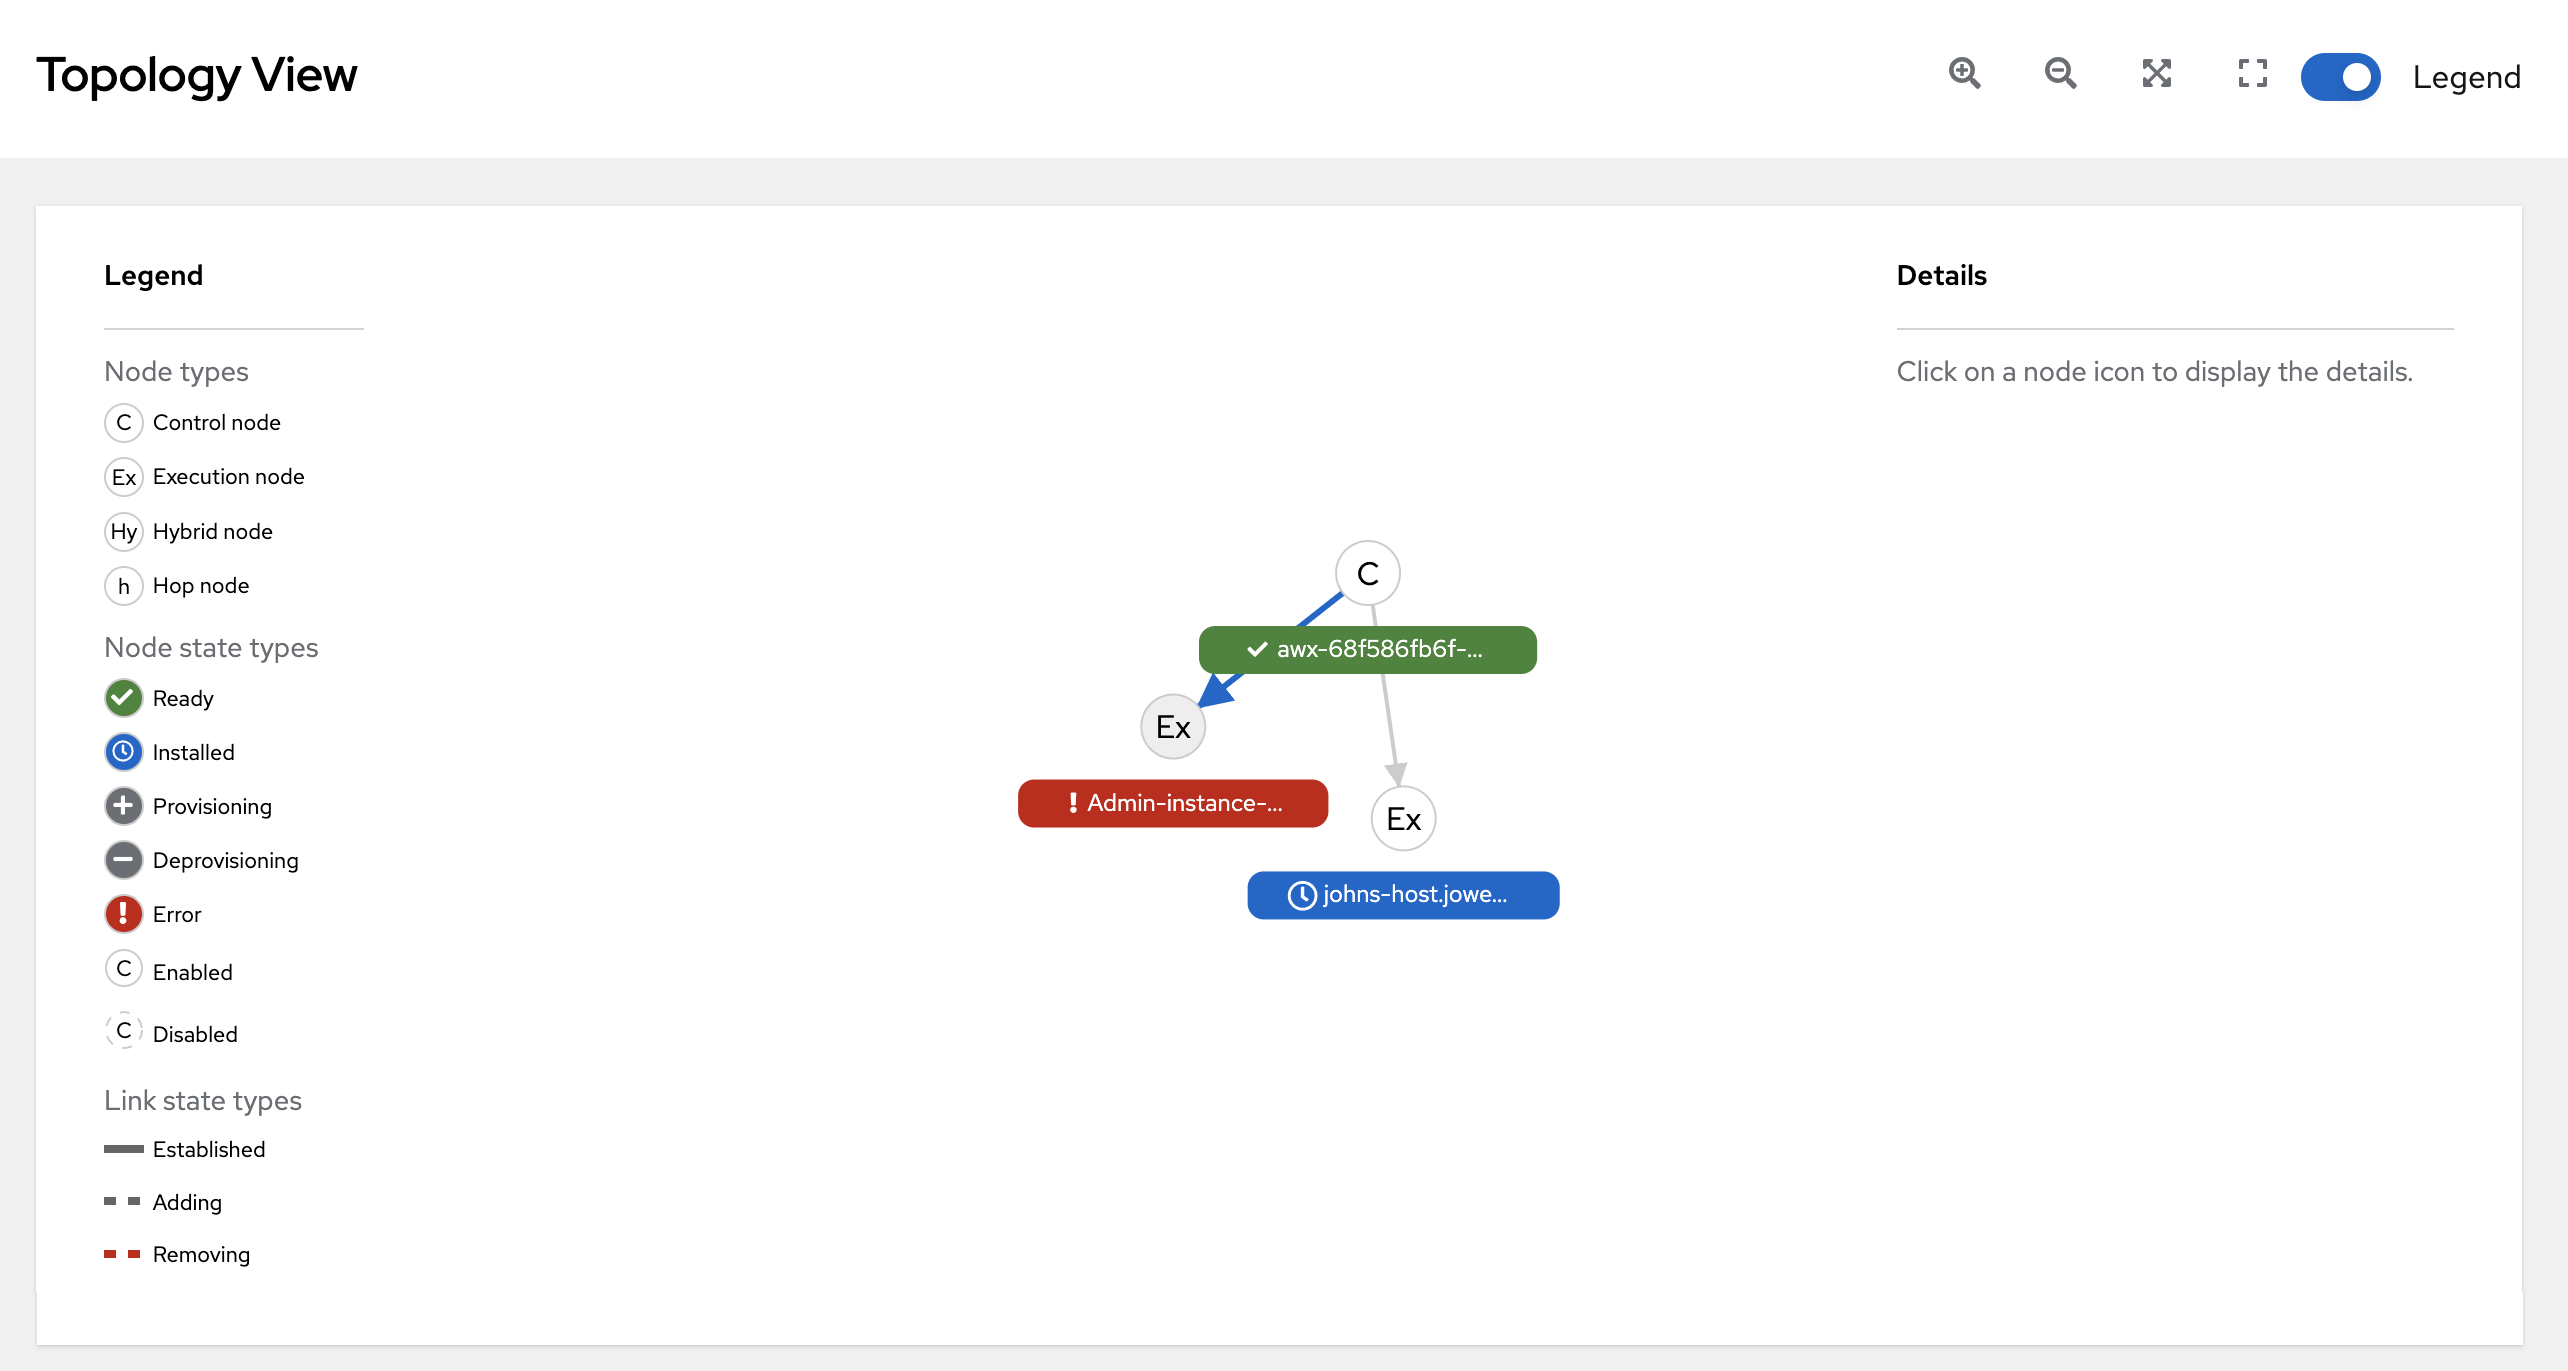
To adjust the zoom levels, or manipulate the graphic views, use the control icons: zoom-in (
 ), zoom-out (
 ), expand (
 ), and reset (
 ) on the toolbar.
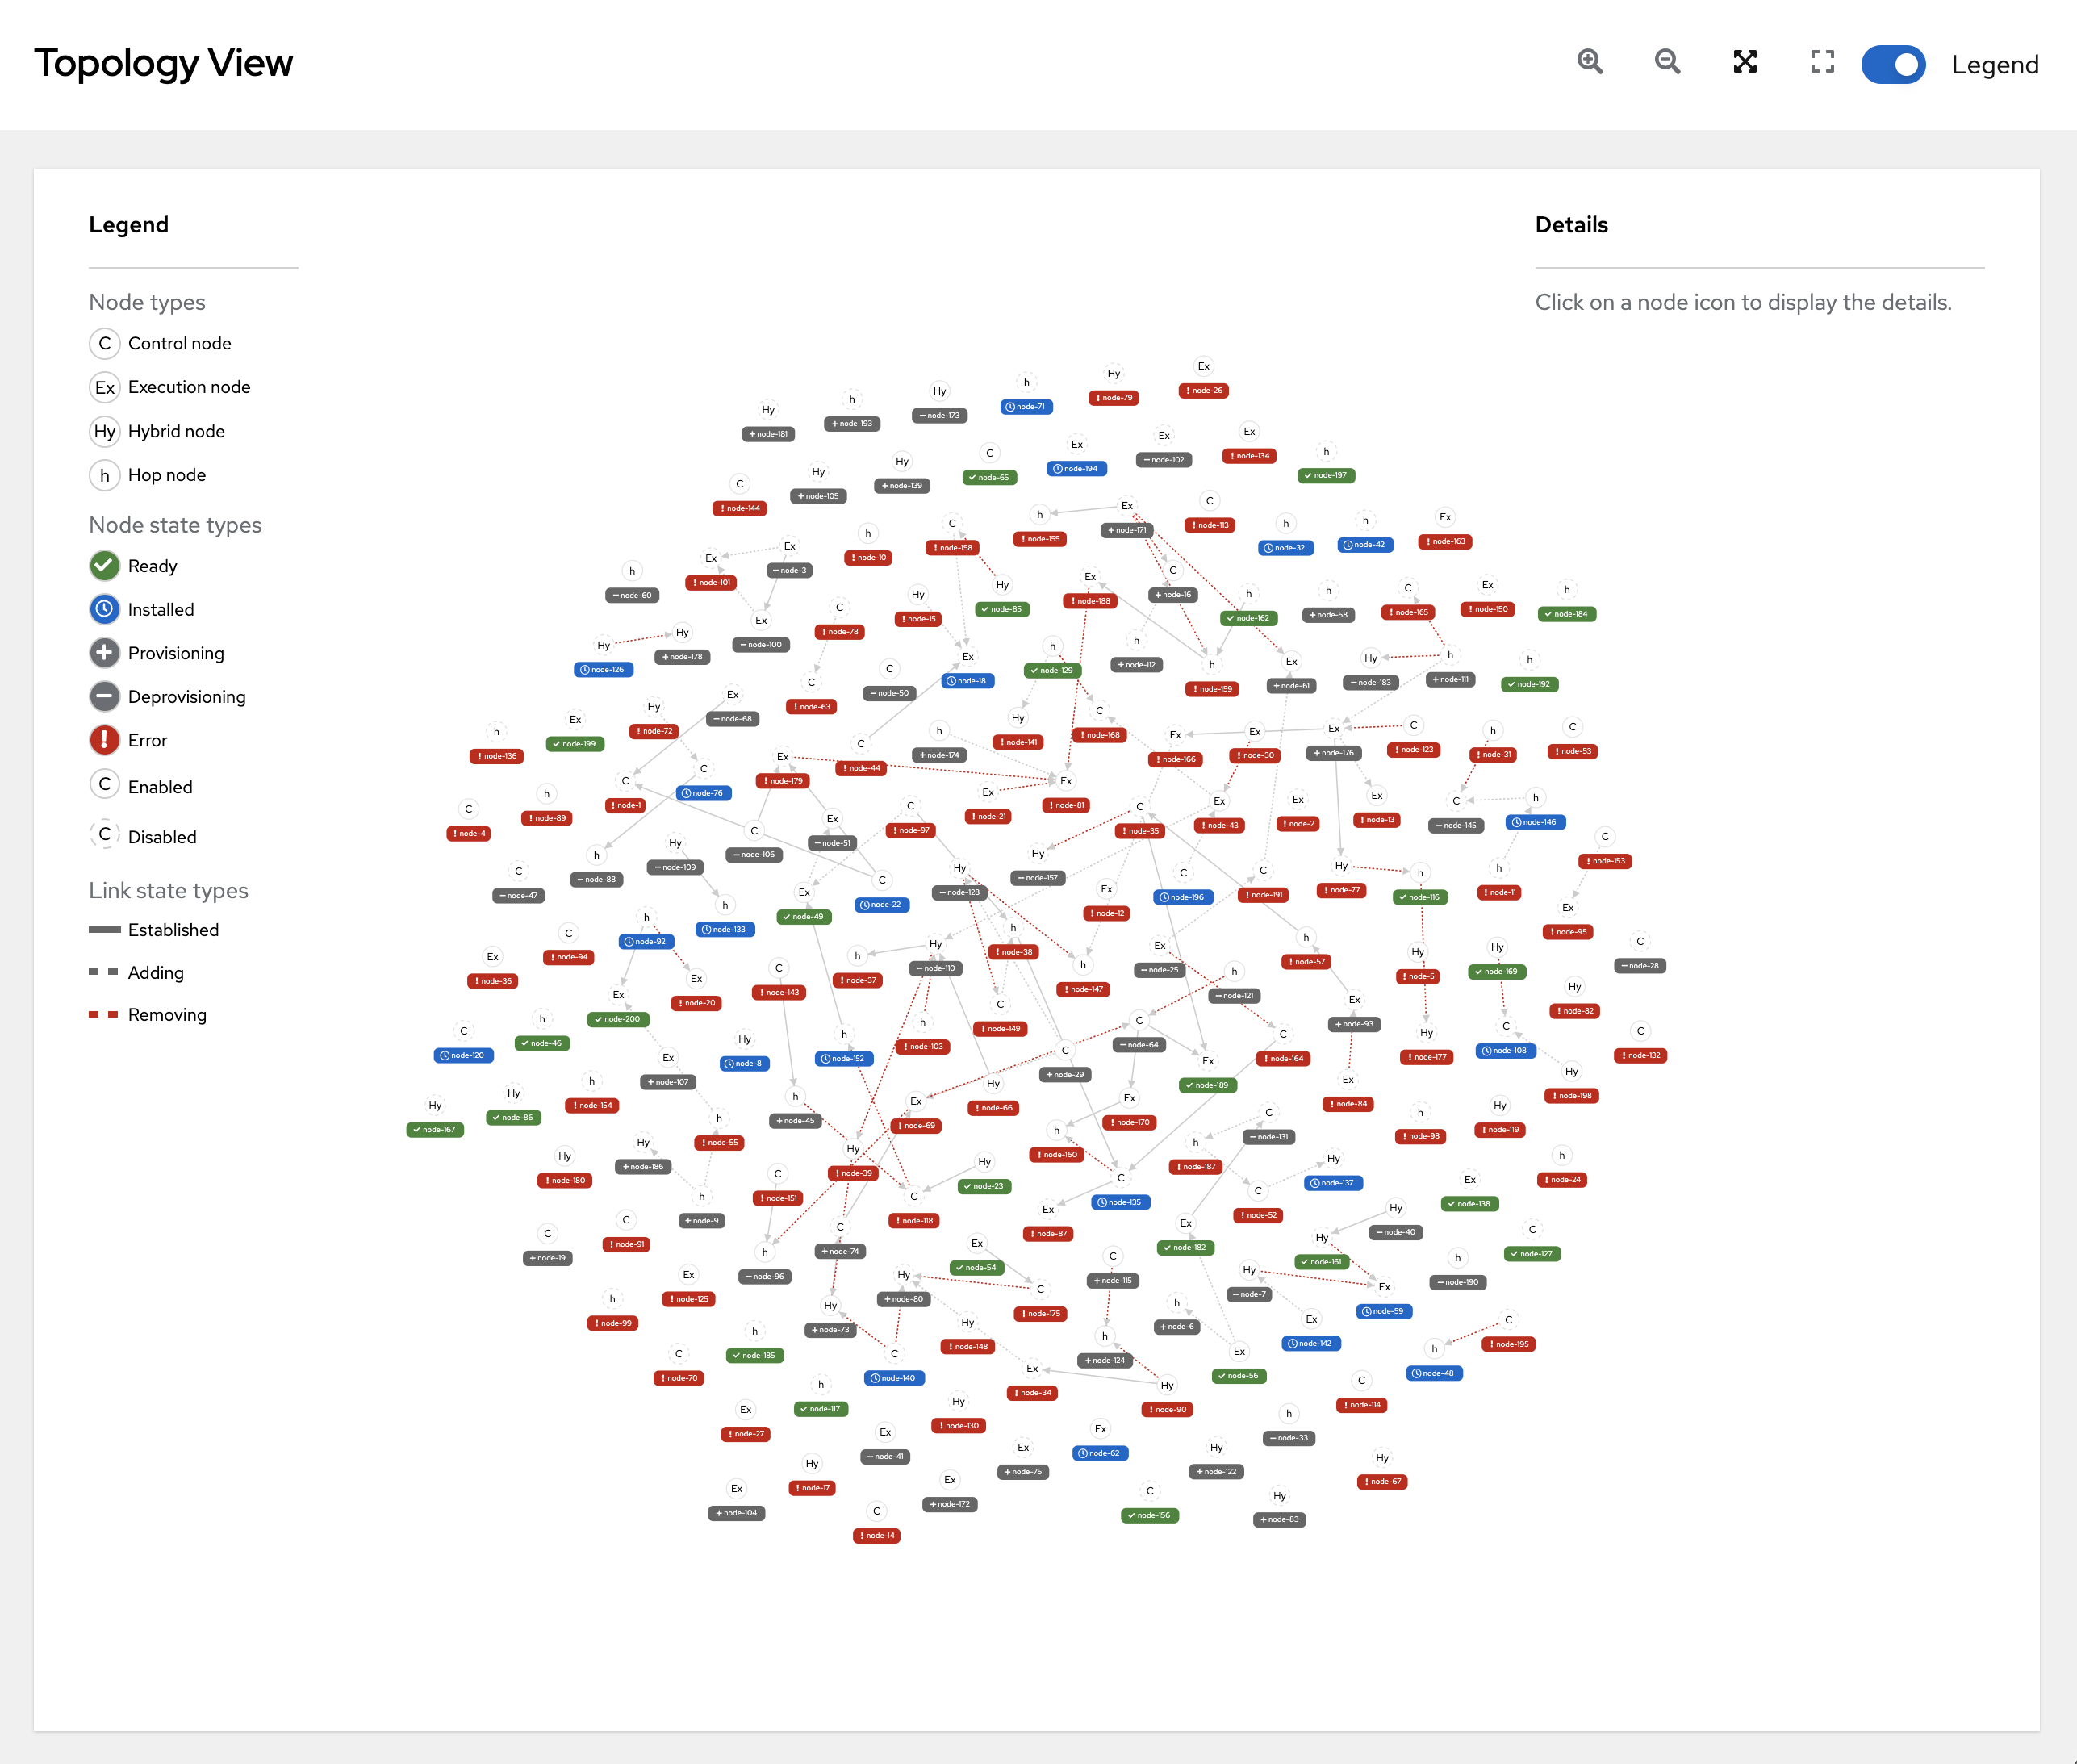
You can also click and drag to pan around; and scroll using your mouse or trackpad to zoom. The fit-to-screen feature automatically scales the graphic to fit on the screen and repositions it in the center. It is particularly useful when you want to see a large mesh in its entirety.
To reset the view to its default view, click the Reset zoom (
) icon.
Refer to the Legend to identify the type of nodes that are represented.
For VM-based installations, see Control and execution planes
For operator-based installations, see Control and execution planes
for more information on each type of node.
NoteIf the Legend is not present, use the toggle on the top bar to enable it.
The Legend shows the
node status <node_statuses>by color, which is indicative of the health of the node. An Error status in the Legend includes the Unavailable state (as displayed in the Instances list view) plus any future error conditions encountered in later versions of automation controller.The following link statuses are also shown in the Legend:
- Established: This is a link state that indicates a peer connection between nodes that are either ready, unavailable, or disabled.
- Adding: This is a link state indicating a peer connection between nodes that were selected to be added to the mesh topology.
- Removing: This is a link state indicating a peer connection between nodes that were selected to be removed from the topology.
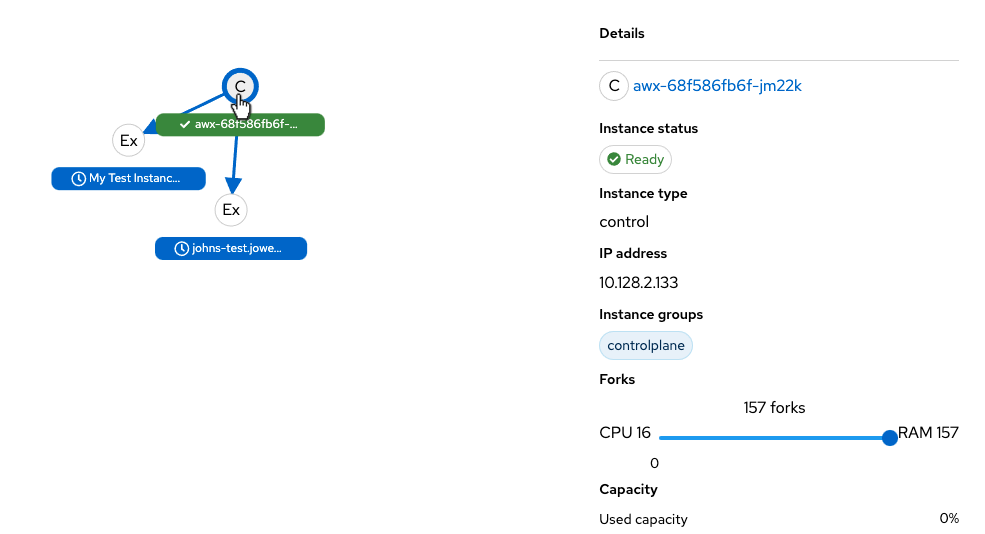
Hover over a node and the connectors highlight to show its immediate connected nodes (peers) or click on a node to retrieve details about it, such as its hostname, node type, and status.
Click on the link for instance hostname from the details displayed to be redirected to its Details page that provides more information about that node, most notably for information about an
Errorstatus, as in the following example.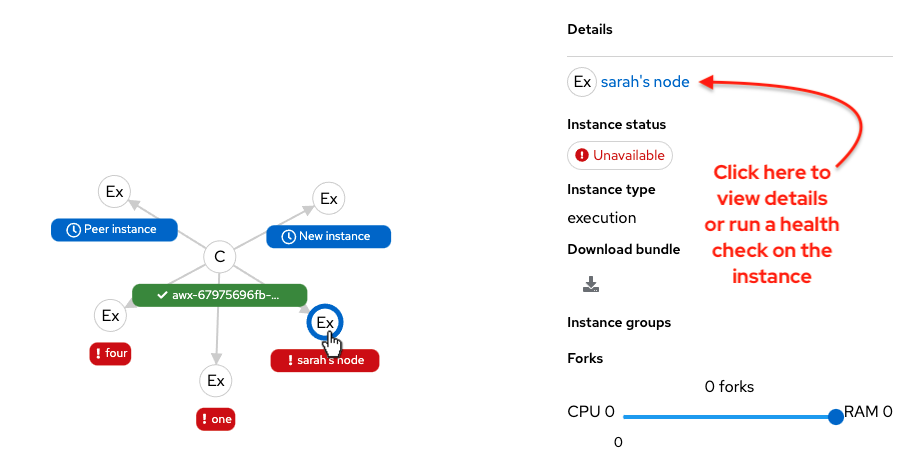
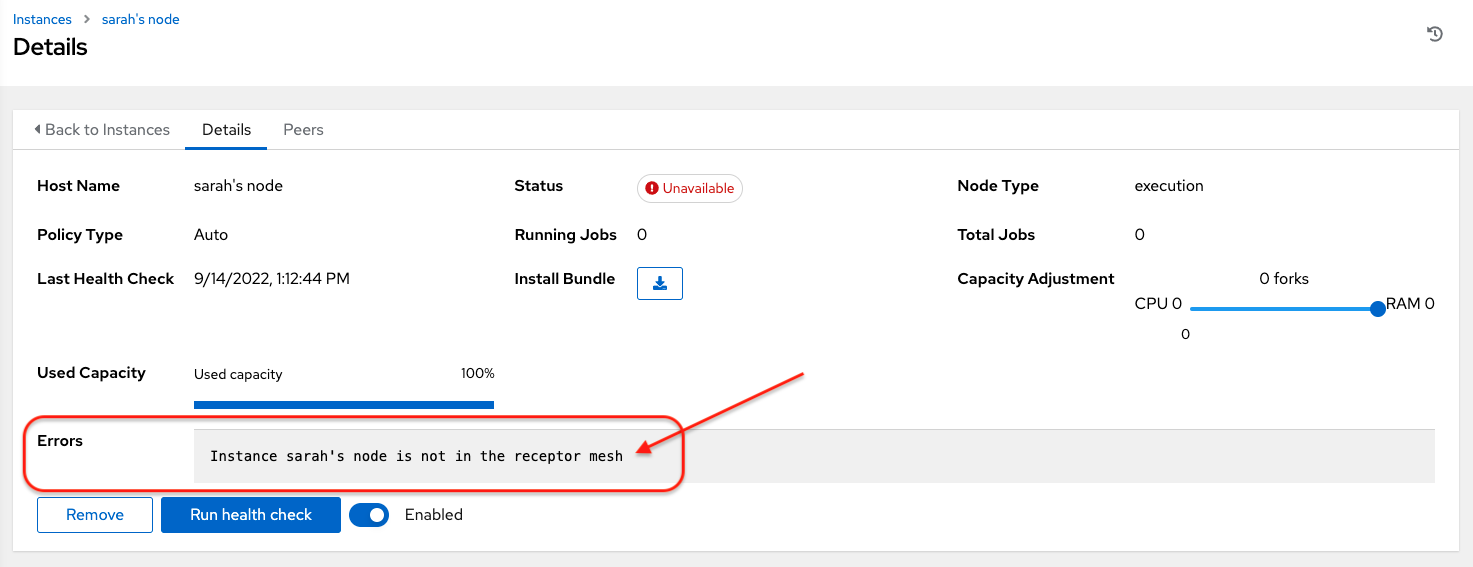
You can use the Details page to remove the instance, run a health check on the instance on an as-needed basis, or unassign jobs from the instance. By default, jobs can be assigned to each node. However, you can disable it to exclude the node from having any jobs running on it.
For more information on creating new nodes and scaling the mesh, see Managing Capacity with Instances.