Dieser Inhalt ist in der von Ihnen ausgewählten Sprache nicht verfügbar.
Chapter 2. Ceph Dashboard installation and access
As a system administrator, you can access the dashboard with the credentials provided on bootstrapping the cluster.
Cephadm installs the dashboard by default. Following is an example of the dashboard URL:
URL: https://host01:8443/
User: admin
Password: zbiql951arUpdate the browser and clear the cookies prior to accessing the dashboard URL.
The following are the Cephadm bootstrap options that are available for the Ceph dashboard configurations:
- [–initial-dashboard-user INITIAL_DASHBOARD_USER] - Use this option while bootstrapping to set initial-dashboard-user.
- [–initial-dashboard-password INITIAL_DASHBOARD_PASSWORD] - Use this option while bootstrapping to set initial-dashboard-password.
- [–ssl-dashboard-port SSL_DASHBOARD_PORT] - Use this option while bootstrapping to set custom dashboard port other than default 8443.
- [–dashboard-key DASHBOARD_KEY] - Use this option while bootstrapping to set Custom key for SSL.
- [–dashboard-crt DASHBOARD_CRT] - Use this option while bootstrapping to set Custom certificate for SSL.
- [–skip-dashboard] - Use this option while bootstrapping to deploy Ceph without dashboard.
- [–dashboard-password-noupdate] - Use this option while bootstrapping if you used above two options and don’t want to reset password at the first time login.
- [–allow-fqdn-hostname] - Use this option while bootstrapping to allow hostname that is fully-qualified.
- [–skip-prepare-host] - Use this option while bootstrapping to skip preparing the host.
To avoid connectivity issues with dashboard related external URL, use the fully qualified domain names (FQDN) for hostnames, for example, host01.ceph.redhat.com.
Open the Grafana URL directly in the client internet browser and accept the security exception to see the graphs on the Ceph dashboard. Reload the browser to view the changes.
Example
[root@host01 ~]# cephadm bootstrap --mon-ip 127.0.0.1 --registry-json cephadm.txt --initial-dashboard-user admin --initial-dashboard-password zbiql951ar --dashboard-password-noupdate --allow-fqdn-hostname
While boostrapping the storage cluster using cephadm, you can use the --image option for either custom container images or local container images.
You have to change the password the first time you log into the dashboard with the credentials provided on bootstrapping only if --dashboard-password-noupdate option is not used while bootstrapping. You can find the Ceph dashboard credentials in the var/log/ceph/cephadm.log file. Search with the "Ceph Dashboard is now available at" string.
This section covers the following tasks:
- Network port requirements for Ceph dashboard.
- Accessing the Ceph dashboard.
- Expanding the cluster on the Ceph dashboard.
- Upgrading a cluster.
- Toggling Ceph dashboard features.
- Understanding the landing page of the Ceph dashboard.
- Enabling Red Hat Ceph Storage Dashboard manually.
- Changing the dashboard password using the Ceph dashboard.
- Changing the Ceph dashboard password using the command line interface.
-
Setting
adminuser password for Grafana. - Creating an admin account for syncing users to the Ceph dashboard.
- Syncing users to the Ceph dashboard using the Red Hat Single Sign-On. *Enabling single sign-on for the Ceph dashboard.
- Disabling single sign-on for the Ceph dashboard.
2.1. Network port requirements for Ceph Dashboard
The Ceph dashboard components use certain TCP network ports which must be accessible. By default, the network ports are automatically opened in firewalld during installation of Red Hat Ceph Storage.
| Port | Use | Originating Host | Destination Host |
|---|---|---|---|
| 8443 | The dashboard web interface | IP addresses that need access to Ceph Dashboard UI and the host under Grafana server, since the AlertManager service can also initiate connections to the Dashboard for reporting alerts. | The Ceph Manager hosts. |
| 3000 | Grafana | IP addresses that need access to Grafana Dashboard UI and all Ceph Manager hosts and Grafana server. | The host or hosts running Grafana server. |
| 2049 | NFS-Ganesha | IP addresses that need access to NFS. | The IP addresses that provide NFS services. |
| 9095 | Default Prometheus server for basic Prometheus graphs | IP addresses that need access to Prometheus UI and all Ceph Manager hosts and Grafana server or Hosts running Prometheus. | The host or hosts running Prometheus. |
| 9093 | Prometheus Alertmanager | IP addresses that need access to Alertmanager Web UI and all Ceph Manager hosts and Grafana server or Hosts running Prometheus. | All Ceph Manager hosts and the host under Grafana server. |
| 9094 | Prometheus Alertmanager for configuring a highly available cluster made from multiple instances | All Ceph Manager hosts and the host under Grafana server. |
Prometheus Alertmanager High Availability (peer daemon sync), so both |
| 9100 |
The Prometheus | Hosts running Prometheus that need to view Node Exporter metrics Web UI and All Ceph Manager hosts and Grafana server or Hosts running Prometheus. | All storage cluster hosts, including MONs, OSDS, Grafana server host. |
| 9283 | Ceph Manager Prometheus exporter module | Hosts running Prometheus that need access to Ceph Exporter metrics Web UI and Grafana server. | All Ceph Manager hosts. |
2.2. Accessing the Ceph dashboard
You can access the Ceph dashboard to administer and monitor your Red Hat Ceph Storage cluster.
Prerequisites
- Successful installation of Red Hat Ceph Storage Dashboard.
- NTP is synchronizing clocks properly.
Procedure
Enter the following URL in a web browser:
Syntax
https://HOST_NAME:PORTReplace:
- HOST_NAME with the fully qualified domain name (FQDN) of the active manager host.
PORT with port
8443Example
https://host01:8443You can also get the URL of the dashboard by running the following command in the Cephadm shell:
Example
[ceph: root@host01 /]# ceph mgr servicesThis command will show you all endpoints that are currently configured. Look for the
dashboardkey to obtain the URL for accessing the dashboard.
-
On the login page, enter the username
adminand the default password provided during bootstrapping. - You have to change the password the first time you log in to the Red Hat Ceph Storage dashboard.
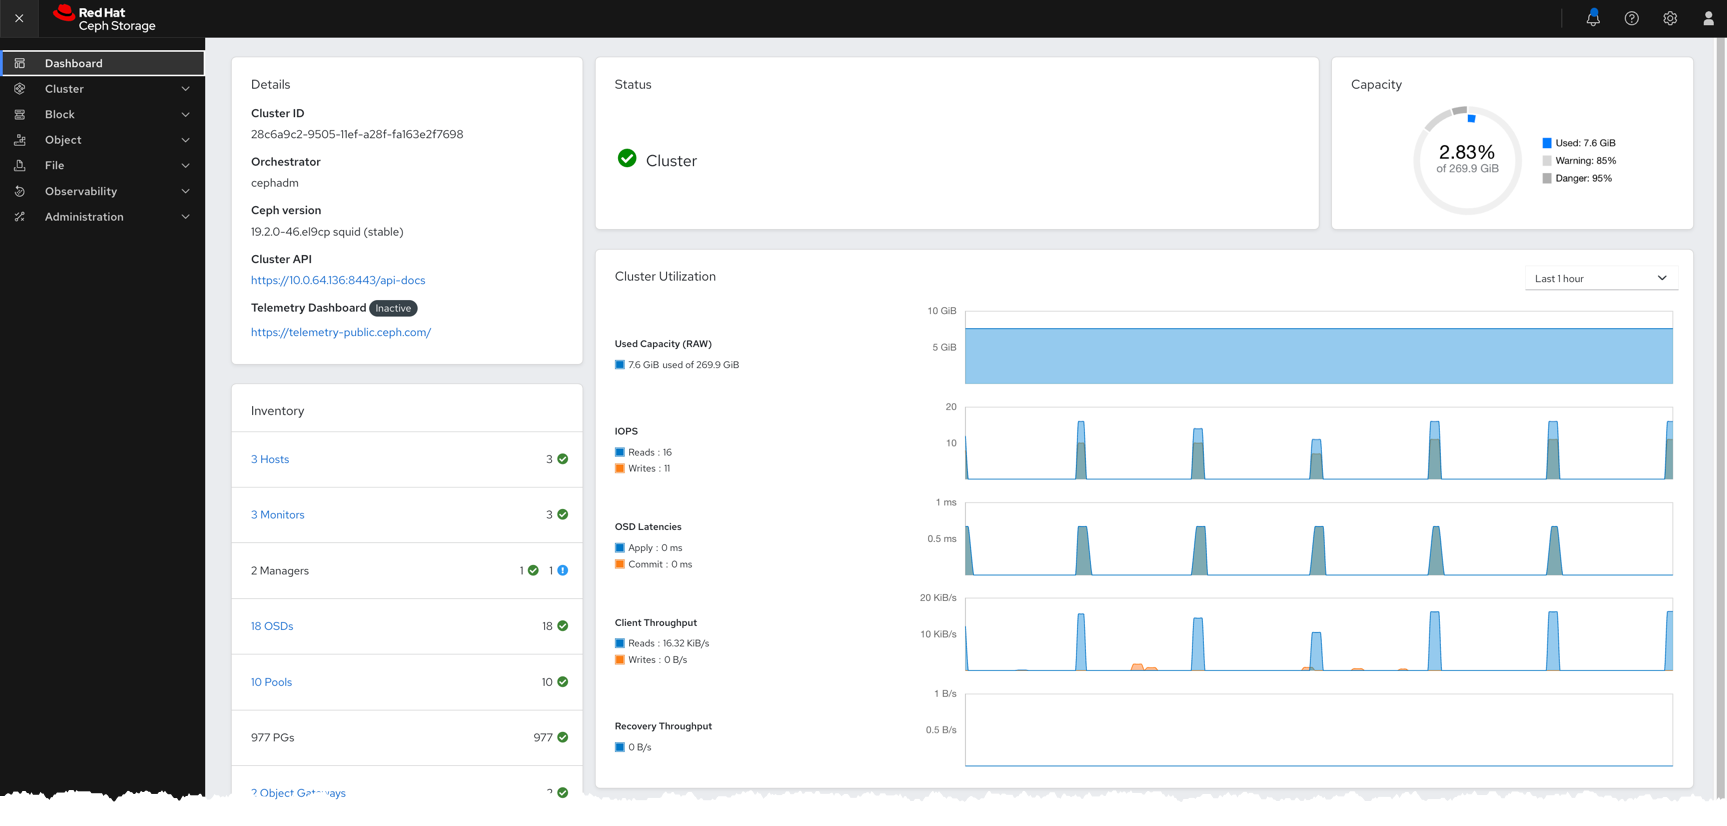
After logging in, the dashboard default landing page is displayed, which provides details, a high-level overview of status, performance, inventory, and capacity metrics of the Red Hat Ceph Storage cluster.
Figure 2.1. Ceph dashboard landing page
-
Click the menu icon (
 ) on the dashboard landing page to collapse or display the options in the vertical menu.
2.3. Expanding the cluster on the Ceph dashboard
You can use the dashboard to expand the Red Hat Ceph Storage cluster for adding hosts, adding OSDs, and creating services such as Alertmanager, Cephadm-exporter, CephFS-mirror, Grafana, ingress, MDS, NFS, node-exporter, Prometheus, RBD-mirror, and Ceph Object Gateway.
Once you bootstrap a new storage cluster, the Ceph Monitor and Ceph Manager daemons are created and the cluster is in HEALTH_WARN state. After creating all the services for the cluster on the dashboard, the health of the cluster changes from HEALTH_WARN to HEALTH_OK status.
Prerequisites
- Bootstrapped storage cluster. See Bootstrapping a new storage cluster section in the Red Hat Ceph Storage Installation Guide for more details.
-
At least
cluster-managerrole for the user on the Red Hat Ceph Storage Dashboard. See the User roles and permissions on the Ceph dashboard section in the Red Hat Ceph Storage Dashboard Guide for more details.
Procedure
Copy the admin key from the bootstrapped host to other hosts:
Syntax
ssh-copy-id -f -i /etc/ceph/ceph.pub root@HOST_NAMEExample
[ceph: root@host01 /]# ssh-copy-id -f -i /etc/ceph/ceph.pub root@host02 [ceph: root@host01 /]# ssh-copy-id -f -i /etc/ceph/ceph.pub root@host03- Log in to the dashboard with the default credentials provided during bootstrap.
- Change the password and log in to the dashboard with the new password .
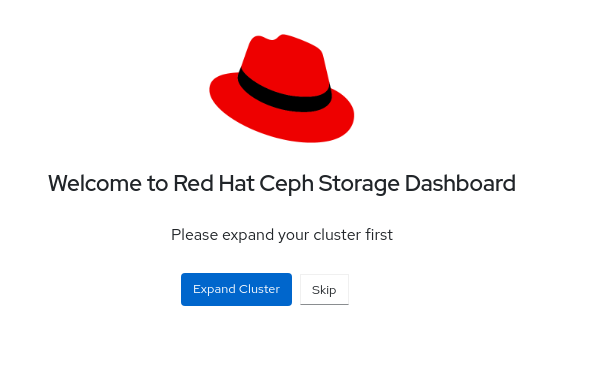
On the landing page, click Expand Cluster.
NoteClicking Expand Cluster opens a wizard taking you through the expansion steps. To skip and add hosts and services separately, click Skip.
Figure 2.2. Expand cluster
Add hosts. This needs to be done for each host in the storage cluster.
- In the Add Hosts step, click Add.
Provide the hostname. This is same as the hostname that was provided while copying the key from the bootstrapped host.
NoteAdd multiple hosts by using a comma-separated list of host names, a range expression, or a comma separated range expression.
- Optional: Provide the respective IP address of the host.
- Optional: Select the labels for the hosts on which the services are going to be created. Click the pencil icon to select or add new labels.
Click Add Host.
The new host is displayed in the Add Hosts pane.
- Click Next.
Create OSDs:
- In the Create OSDs step, for Primary devices, Click Add.
- In the Primary Devices window, filter for the device and select the device.
- Click Add.
- Optional: In the Create OSDs window, if you have any shared devices such as WAL or DB devices, then add the devices.
- Optional: In the Features section, select Encryption to encrypt the features.
- Click Next.
Create services:
- In the Create Services step, click Create.
In the Create Service form:
- Select a service type.
-
Provide the service ID. The ID is a unique name for the service. This ID is used in the service name, which is
service_type.service_id.
…Optional: Select if the service is Unmanaged.
+ When Unmanaged services is selected, the orchestrator will not start or stop any daemon associated with this service. Placement and all other properties are ignored.
- Select if the placement is by hosts or label.
- Select the hosts.
In the Count field, provide the number of daemons or services that need to be deployed.
Click Create Service.
The new service is displayed in the Create Services pane.
- In the Create Service window, Click Next.
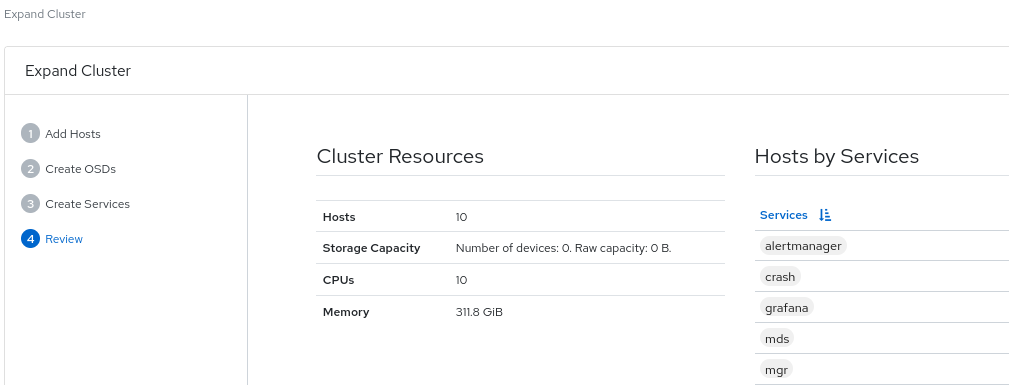
Review the cluster expansion details.
Review the Cluster Resources, Hosts by Services, Host Details. To edit any parameters, click Back and follow the previous steps.
Figure 2.3. Review cluster
Click Expand Cluster.
The
Cluster expansion displayednotification is displayed and the cluster status changes to HEALTH_OK on the dashboard.
Verification
Log in to the
cephadmshell:Example
[root@host01 ~]# cephadm shellRun the
ceph -scommand.Example
[ceph: root@host01 /]# ceph -sThe health of the cluster is HEALTH_OK.
2.4. Upgrading a cluster
Upgrade Ceph clusters using the dashboard.
Cluster images are pulled automatically from registry.redhat.io. Optionally, use custom images for upgrade.
Prerequisites
Verify that your upgrade version path and operating system is supported before starting the upgrade process. For more information, see Compatibility Matrix for Red Hat Ceph Storage 8.0.
Before you begin, make sure that you have the following prerequisites in place:
These items cannot be done through the dashboard and must be completed manually, through the command-line interface, before continuing to upgrade the cluster from the dashboard.
For detailed information, see Upgrading the Red Hat Ceph Storage cluster in a disconnected environment and complete steps 1 through 7.
The latest
cephadm.Syntax
dnf udpate cephadmThe latest
cephadm-ansible.Syntax
dnf udpate cephadm-ansibleThe latest
cephadm pre-flight playbook.Syntax
ansible-playbook -i INVENTORY_FILE cephadm-preflight.yml --extra-vars "ceph_origin=custom upgrade_ceph_packages=true"Run the following Ceph commands to avoid alerts and rebalancing of the data during the cluster upgrade:
Syntax
ceph health mute DAEMON_OLD_VERSION --sticky
ceph osd set noout
ceph osd set noscrub
ceph osd set nodeep-scrub
Procedure
View if cluster upgrades are available and upgrade as needed from Administration > Upgrade on the dashboard.
NoteIf the dashboard displays the
Not retrieving upgradesmessage, check if the registries were added to the container configuration files with the appropriate log in credentials to Podman or docker.Click Pause or Stop during the upgrade process, if needed. The upgrade progress is shown in the progress bar along with information messages during the upgrade.
NoteWhen stopping the upgrade, the upgrade is first paused and then prompts you to stop the upgrade.
- Optional. View cluster logs during the upgrade process from the Cluster logs section of the Upgrade page.
- Verify that the upgrade is completed successfully by confirming that the cluster status displays OK state.
After verifying that the upgrade is complete, unset the
noout,noscrub, andnodeep-scrubflags.Example
[ceph: root@host01 /]# ceph osd unset noout
[ceph: root@host01 /]# ceph osd unset noscrub
[ceph: root@host01 /]# ceph osd unset nodeep-scrub
2.5. Toggling Ceph dashboard features
You can customize the Red Hat Ceph Storage dashboard components by enabling or disabling features on demand. All features are enabled by default. When disabling a feature, the web-interface elements become hidden and the associated REST API end-points reject any further requests for that feature. Enabling and disabling dashboard features can be done from the command-line interface or the web interface.
Available features:
Ceph Block Devices:
-
Image management,
rbd -
Mirroring,
mirroring
-
Image management,
-
Ceph File System,
cephfs -
Ceph Object Gateway,
rgw -
NFS Ganesha gateway,
nfs
By default, the Ceph Manager is collocated with the Ceph Monitor.
You can disable multiple features at once.
Once a feature is disabled, it can take up to 20 seconds to reflect the change in the web interface.
Prerequisites
- Installation and configuration of the Red Hat Ceph Storage dashboard software.
- User access to the Ceph Manager host or the dashboard web interface.
- Root level access to the Ceph Manager host.
Procedure
To toggle the dashboard features from the dashboard web interface:
- On the dashboard landing page, go to Administration→Manager Modules and select the dashboard module.
- Click Edit.
- In the Edit Manager module form, you can enable or disable the dashboard features by selecting or clearing the check boxes next to the different feature names.
- After the selections are made, click Update.
To toggle the dashboard features from the command-line interface:
Log in to the Cephadm shell:
Example
[root@host01 ~]# cephadm shellList the feature status:
Example
[ceph: root@host01 /]# ceph dashboard feature statusDisable a feature:
[ceph: root@host01 /]# ceph dashboard feature disable rgwThis example disables the Ceph Object Gateway feature.
Enable a feature:
[ceph: root@host01 /]# ceph dashboard feature enable cephfsThis example enables the Ceph Filesystem feature.
2.6. Understanding the landing page of the Ceph dashboard
The landing page displays an overview of the entire Ceph cluster using navigation bars and individual panels.
The menu bar provides the following options:
- Tasks and Notifications
- Provides task and notification messages.
- Help
- Provides links to the product and REST API documentation, details about the Red Hat Ceph Storage Dashboard, and a form to report an issue.
- Dashboard Settings
- Gives access to user management and telemetry configuration.
- User
- Use this menu to see log in status, to change a password, and to sign out of the dashboard.
Figure 2.4. Menu bar

The navigation menu can be opened or hidden by clicking the navigation menu icon
 .
.
Dashboard
The main dashboard displays specific information about the state of the cluster.
The main dashboard can be accessed at any time by clicking Dashboard from the navigation menu.
The dashboard landing page organizes the panes into different categories.
Figure 2.5. Ceph dashboard landing page

- Details
- Displays specific cluster information and if telemetry is active or inactive.
- Inventory
Displays the different parts of the cluster, how many are available, and their status.
Link directly from Inventory to specific inventory items, where available.
- Hosts
- Displays the total number of hosts in the Ceph storage cluster.
- Monitors
- Displays the number of Ceph Monitors and the quorum status.
- Managers
- Displays the number and status of the Manager Daemons.
- OSDs
- Displays the total number of OSDs in the Ceph Storage cluster and the number that are up, and in.
- Pools
- Displays the number of storage pools in the Ceph cluster.
- PGs
Displays the total number of placement groups (PGs). The PG states are divided into Working and Warning to simplify the display. Each one encompasses multiple states. + The Working state includes PGs with any of the following states:
- activating
- backfill_wait
- backfilling
- creating
- deep
- degraded
- forced_backfill
- forced_recovery
- peering
- peered
- recovering
- recovery_wait
- repair
- scrubbing
- snaptrim
- snaptrim_wait + The Warning state includes PGs with any of the following states:
- backfill_toofull
- backfill_unfound
- down
- incomplete
- inconsistent
- recovery_toofull
- recovery_unfound
- remapped
- snaptrim_error
- stale
- undersized
- Object Gateways
- Displays the number of Object Gateways in the Ceph storage cluster.
- Metadata Servers
- Displays the number and status of metadata servers for Ceph File Systems (CephFS).
- Status
- Displays the health of the cluster and host and daemon states. The current health status of the Ceph storage cluster is displayed. Danger and warning alerts are displayed directly on the landing page. Click View alerts for a full list of alerts.
- Capacity
- Displays storage usage metrics. This is displayed as a graph of used, warning, and danger. The numbers are in percentages and in GiB.
- Cluster Utilization
- The Cluster Utilization pane displays information related to data transfer speeds. Select the time range for the data output from the list. Select a range between the last 5 minutes to the last 24 hours.
- Used Capacity (RAW)
- Displays usage in GiB.
- IOPS
- Displays total I/O read and write operations per second.
- OSD Latencies
- Displays total applies and commits per millisecond.
- Client Throughput
- Displays total client read and write throughput in KiB per second.
- Recovery Throughput
- Displays the rate of cluster healing and balancing operations. For example, the status of any background data that may be moving due to a loss of disk is displayed. The information is displayed in bytes per second.
2.7. Changing the dashboard password using the Ceph dashboard
By default, the password for accessing dashboard is randomly generated by the system while bootstrapping the cluster. You have to change the password the first time you log in to the Red Hat Ceph Storage dashboard. You can change the password for the admin user using the dashboard.
Prerequisites
- A running Red Hat Ceph Storage cluster.
Procedure
Log in to the dashboard:
Syntax
https://HOST_NAME:8443- Go to User→Change password on the menu bar.
- Enter the old password, for verification.
- In the New password field enter a new password. Passwords must contain a minimum of 8 characters and cannot be the same as the last one.
- In the Confirm password field, enter the new password again to confirm.
Click Change Password.
You will be logged out and redirected to the login screen. A notification appears confirming the password is changed.
2.8. Changing the Ceph dashboard password using the command line interface
If you have forgotten your Ceph dashboard password, you can change the password using the command line interface.
Prerequisites
- A running Red Hat Ceph Storage cluster.
- Root-level access to the host on which the dashboard is installed.
Procedure
Log into the Cephadm shell:
Example
[root@host01 ~]# cephadm shellCreate the
dashboard_password.ymlfile:Example
[ceph: root@host01 /]# touch dashboard_password.ymlEdit the file and add the new dashboard password:
Example
[ceph: root@host01 /]# vi dashboard_password.ymlReset the dashboard password:
Syntax
ceph dashboard ac-user-set-password DASHBOARD_USERNAME -i PASSWORD_FILEExample
[ceph: root@host01 /]# ceph dashboard ac-user-set-password admin -i dashboard_password.yml
{"username": "admin", "password": "$2b$12$i5RmvN1PolR61Fay0mPgt.GDpcga1QpYsaHUbJfoqaHd1rfFFx7XS", "roles": ["administrator"], "name": null, "email": null, "lastUpdate": , "enabled": true, "pwdExpirationDate": null, "pwdUpdateRequired": false}
Verification
- Log in to the dashboard with your new password.
2.9. Setting admin user password for Grafana
By default, cephadm does not create an admin user for Grafana. With the Ceph Orchestrator, you can create an admin user and set the password.
With these credentials, you can log in to the storage cluster’s Grafana URL with the given password for the admin user.
Prerequisites
- A running Red Hat Ceph Storage cluster with the monitoring stack installed.
-
Root-level access to the
cephadmhost. -
The
dashboardmodule enabled.
Procedure
As a root user, create a
grafana.ymlfile and provide the following details:Syntax
service_type: grafana
spec:
  initial_admin_password: PASSWORD
Example
service_type: grafana
spec:
  initial_admin_password: mypassword
Mount the
grafana.ymlfile under a directory in the container:Example
[root@host01 ~]# cephadm shell --mount grafana.yml:/var/lib/ceph/grafana.ymlNoteEvery time you exit the shell, you have to mount the file in the container before deploying the daemon.
Optional: Check if the
dashboardCeph Manager module is enabled:Example
[ceph: root@host01 /]# ceph mgr module lsOptional: Enable the
dashboardCeph Manager module:Example
[ceph: root@host01 /]# ceph mgr module enable dashboardApply the specification using the
orchcommand:Syntax
ceph orch apply -i FILE_NAME.ymlExample
[ceph: root@host01 /]# ceph orch apply -i /var/lib/ceph/grafana.ymlRedeploy
grafanaservice:Example
[ceph: root@host01 /]# ceph orch redeploy grafanaThis creates an admin user called
adminwith the given password and the user can log in to the Grafana URL with these credentials.
Verification:
Log in to Grafana with the credentials:
Syntax
https://HOST_NAME:PORTExample
https://host01:3000/
2.10. Enabling Red Hat Ceph Storage Dashboard manually
If you have installed a Red Hat Ceph Storage cluster by using --skip-dashboard option during bootstrap, you can see that the dashboard URL and credentials are not available in the bootstrap output. You can enable the dashboard manually using the command-line interface. Although the monitoring stack components such as Prometheus, Grafana, Alertmanager, and node-exporter are deployed, they are disabled and you have to enable them manually.
Prerequisite
-
A running Red Hat Ceph Storage cluster installed with
--skip-dashboardoption during bootstrap. - Root-level access to the host on which the dashboard needs to be enabled.
Procedure
Log into the Cephadm shell:
Example
[root@host01 ~]# cephadm shellCheck the Ceph Manager services:
Example
[ceph: root@host01 /]# ceph mgr services

{
    "prometheus": "http://10.8.0.101:9283/"
}
You can see that the Dashboard URL is not configured.
Enable the dashboard module:
Example
[ceph: root@host01 /]# ceph mgr module enable dashboardCreate the self-signed certificate for the dashboard access:
Example
[ceph: root@host01 /]# ceph dashboard create-self-signed-certNoteYou can disable the certificate verification to avoid certification errors.
Check the Ceph Manager services:
Example
[ceph: root@host01 /]# ceph mgr services

{
    "dashboard": "https://10.8.0.101:8443/",
    "prometheus": "http://10.8.0.101:9283/"
}
Create the admin user and password to access the Red Hat Ceph Storage dashboard:
Syntax
echo -n "PASSWORD" > PASSWORD_FILE
ceph dashboard ac-user-create admin -i PASSWORD_FILE administrator
Example
[ceph: root@host01 /]# echo -n "p@ssw0rd" > password.txt [ceph: root@host01 /]# ceph dashboard ac-user-create admin -i password.txt administrator- Enable the monitoring stack. See the Enabling monitoring stack section in the Red Hat Ceph Storage Dashboard Guide for details.
2.11. Using single sign-on with the dashboard
The Ceph Dashboard supports external authentication of users with the choice of either the Security Assertion Markup Language (SAML) 2.0 protocol or with the OAuth2 Proxy (oauth2-proxy). Before using single sign-on (SSO) with the Ceph Dashboard, create the dashboard user accounts and assign any required roles. The Ceph Dashboard completes user authorization and then the existing Identity Provider (IdP) completes the authentication process. You can enable single sign-on using the SAML protocol or oauth2-proxy.
Red Hat Ceph Storage supports dashboard SSO and Multi-Factor Authentication with RHSSO (Keycloak).
To connect your SAML IdP with the Ceph Dashboard, use the following Service Provider (SP) configuration details. In each of the following configuration URLs, replace DASHBOARD_HOST with the fully qualified domain name (FQDN) and port of your dashboard. For example, ceph-dashboard.example.com:8443.
- Entity ID (Audience URI)
- The unique identifier for the Ceph Dashboard service provider.
https://DASHBOARD_HOST/auth/saml2/metadata
- Assertion Consumer Service (ACS)
- The endpoint where the IdP sends the SAML assertion (using POST binding).
https://DASHBOARD_HOST/auth/saml2/
- Default Relay State (Start URL)
- The page that users are directed to after a successful login.
https://DASHBOARD_HOST/#/dashboard
- Target URL
-
https://DASHBOARD_HOST/#/dashboard
Some IdPs can automatically configure these fields from the service provider metadata. To provide the metadata, give your IdP the following URL:
OAuth2 SSO uses the oauth2-proxy service to work with the Ceph Management gateway (mgmt-gateway), providing unified access and improved user experience.
The OAuth2 SSO, mgmt-gateway, and oauth2-proxy services are Technology Preview.
For more information about the Ceph Management gateway and the OAuth2 Proxy service, see Using the Ceph Management gateway (mgmt-gateway) and Using the OAuth2 Proxy (oauth2-proxy) service.
For more information about Red Hat build of Keycloack, see Red Hat build of Keycloak on the Red Hat Customer Portal.
2.11.1. Creating an admin account for syncing users to the Ceph dashboard
You have to create an admin account to synchronize users to the Ceph dashboard.
After creating the account, use Red Hat Single Sign-on (SSO) to synchronize users to the Ceph dashboard. See the Syncing users to the Ceph dashboard using Red Hat Single Sign-On section in the Red Hat Ceph Storage Dashboard Guide.
Prerequisites
- A running Red Hat Ceph Storage cluster.
- Dashboard is installed.
- Admin level access to the dashboard.
- Users are added to the dashboard.
- Root-level access on all the hosts.
- Java OpenJDK installed. For more information, see the Installing a JRE on RHEL by using yum section of the Installing and using OpenJDK 8 for RHEL guide for OpenJDK on the Red Hat Customer Portal.
- Red hat Single Sign-On installed from a ZIP file. See the Installing RH-SSO from a ZIP File section of the Server Installation and Configuration Guide for Red Hat Single Sign-On on the Red Hat Customer Portal.
Procedure
- Download the Red Hat Single Sign-On 7.4.0 Server on the system where Red Hat Ceph Storage is installed.
Unzip the folder:
[root@host01 ~]# unzip rhsso-7.4.0.zipNavigate to the
standalone/configurationdirectory and open thestandalone.xmlfor editing:[root@host01 ~]# cd standalone/configuration [root@host01 configuration]# vi standalone.xmlFrom the
bindirectory of the newly createdrhsso-7.4.0folder, run theadd-user-keycloakscript to add the initial administrator user:[root@host01 bin]# ./add-user-keycloak.sh -u admin-
Replace all instances of
localhostand two instances of127.0.0.1with the IP address of the machine where Red Hat SSO is installed. Start the server. From the
bindirectory ofrh-sso-7.4folder, run thestandaloneboot script:[root@host01 bin]# ./standalone.shCreate the admin account in https: IP_ADDRESS :8080/auth with a username and password:
NoteYou have to create an admin account only the first time that you log into the console.
- Log into the admin console with the credentials created.
2.11.2. Syncing users to the Ceph dashboard using Red Hat Single Sign-On
You can use Red Hat Single Sign-on (SSO) with Lightweight Directory Access Protocol (LDAP) integration to synchronize users to the Red Hat Ceph Storage Dashboard.
The users are added to specific realms in which they can access the dashboard through SSO without any additional requirements of a password.
Prerequisites
- A running Red Hat Ceph Storage cluster.
- Dashboard is installed.
- Admin level access to the dashboard.
- Users are added to the dashboard. See the Creating users on Ceph dashboard section in the Red Hat Ceph Storage Dashboard Guide.
- Root-level access on all the hosts.
- Admin account created for syncing users. See the Creating an admin account for syncing users to the Ceph dashboard section in the Red Hat Ceph Storage Dashboard Guide.
Procedure
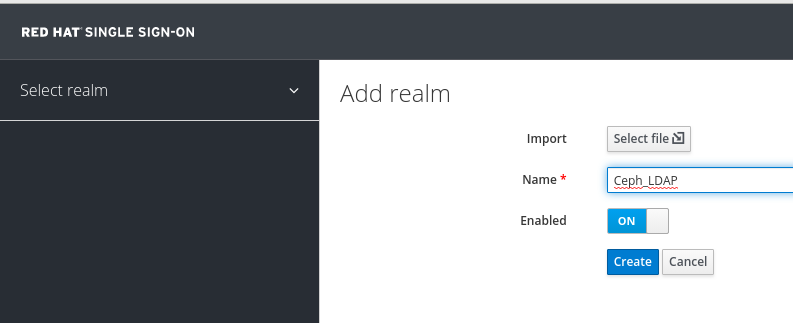
- To create a realm, click the Master drop-down menu. In this realm, you can provide access to users and applications.
In the Add Realm window, enter a case-sensitive realm name and set the parameter Enabled to ON and click Create:
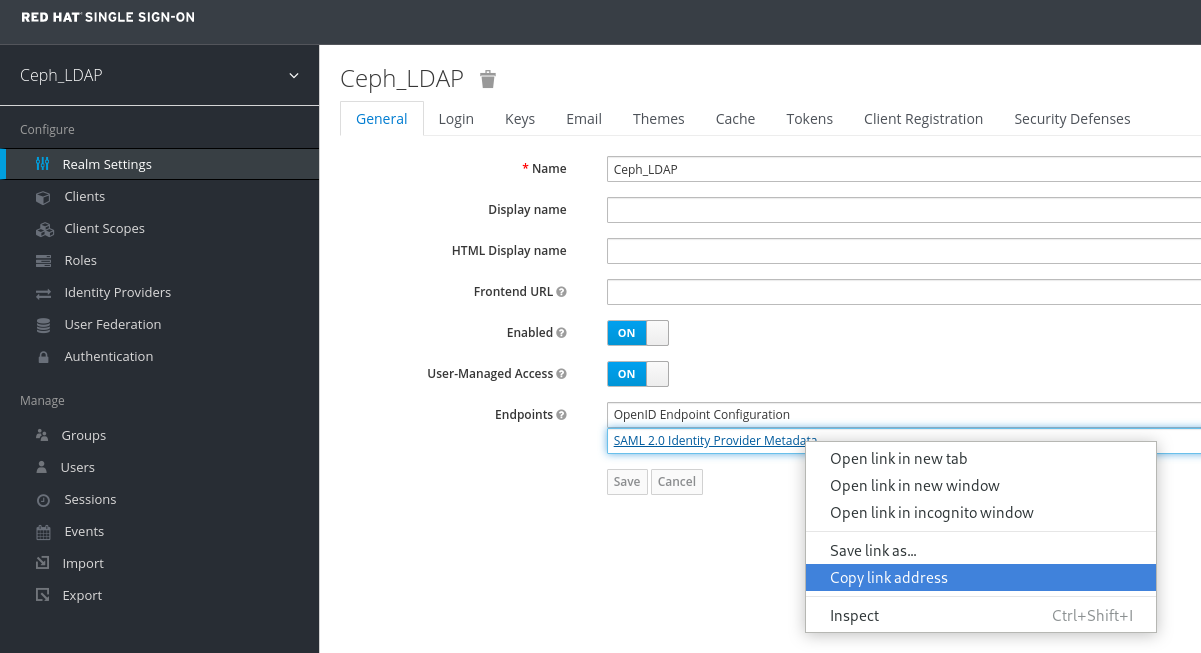
In the Realm Settings tab, set the following parameters and click Save:
- Enabled - ON
- User-Managed Access - ON
Make a note of the link address of SAML 2.0 Identity Provider Metadata to paste in Client Settings.
In the Clients tab, click Create:

In the Add Client window, set the following parameters and click Save:
Client ID - BASE_URL:8443/auth/saml2/metadata
Example
https://example.ceph.redhat.com:8443/auth/saml2/metadata
- Client Protocol - saml
In the Client window, under Settings tab, set the following parameters:
Expand Table 2.2. Client Settings tab Name of the parameter Syntax Example Client IDBASE_URL:8443/auth/saml2/metadata
https://example.ceph.redhat.com:8443/auth/saml2/metadata
EnabledON
ON
Client Protocolsaml
saml
Include AuthnStatementON
ON
Sign DocumentsON
ON
Signature AlgorithmRSA_SHA1
RSA_SHA1
SAML Signature Key NameKEY_ID
KEY_ID
Valid Redirect URLsBASE_URL:8443/*
https://example.ceph.redhat.com:8443/*
Base URLBASE_URL:8443
https://example.ceph.redhat.com:8443/
Master SAML Processing URLhttps://localhost:8080/auth/realms/REALM_NAME/protocol/saml/descriptor
https://localhost:8080/auth/realms/Ceph_LDAP/protocol/saml/descriptor
NotePaste the link of SAML 2.0 Identity Provider Metadata from Realm Settings tab.
Under Fine Grain SAML Endpoint Configuration, set the following parameters and click Save:
Expand Table 2.3. Fine Grain SAML configuration Name of the parameter Syntax Example Assertion Consumer Service POST Binding URL
BASE_URL:8443/#/dashboard
https://example.ceph.redhat.com:8443/#/dashboard
Assertion Consumer Service Redirect Binding URL
BASE_URL:8443/#/dashboard
https://example.ceph.redhat.com:8443/#/dashboard
Logout Service Redirect Binding URL
BASE_URL:8443/
https://example.ceph.redhat.com:8443/
In the Clients window, Mappers tab, set the following parameters and click Save:
Expand Table 2.4. Client Mappers tab Name of the parameter Value Protocolsaml
Nameusername
Mapper PropertyUser Property
Propertyusername
SAML Attribute nameusername
In the Clients Scope tab, select role_list:
- In Mappers tab, select role list, set the Single Role Attribute to ON.
Select User_Federation tab:
- In User Federation window, select ldap from the drop-down menu:
In User_Federation window, Settings tab, set the following parameters and click Save:
Expand Table 2.5. User Federation Settings tab Name of the parameter Value Console Display Namerh-ldap
Import UsersON
Edit_ModeREAD_ONLY
Username LDAP attributeusername
RDN LDAP attributeusername
UUID LDAP attributensuniqueid
User Object ClassesinetOrgPerson, organizationalPerson, rhatPerson
Connection URLExample: ldap://ldap.corp.redhat.com Click Test Connection. You will get a notification that the LDAP connection is successful.
Users DNou=users, dc=example, dc=com
Bind Typesimple
Click Test authentication. You will get a notification that the LDAP authentication is successful.
In Mappers tab, select first name row and edit the following parameter and Click Save:
- LDAP Attribute - givenName
In User_Federation tab, Settings tab, Click Synchronize all users:
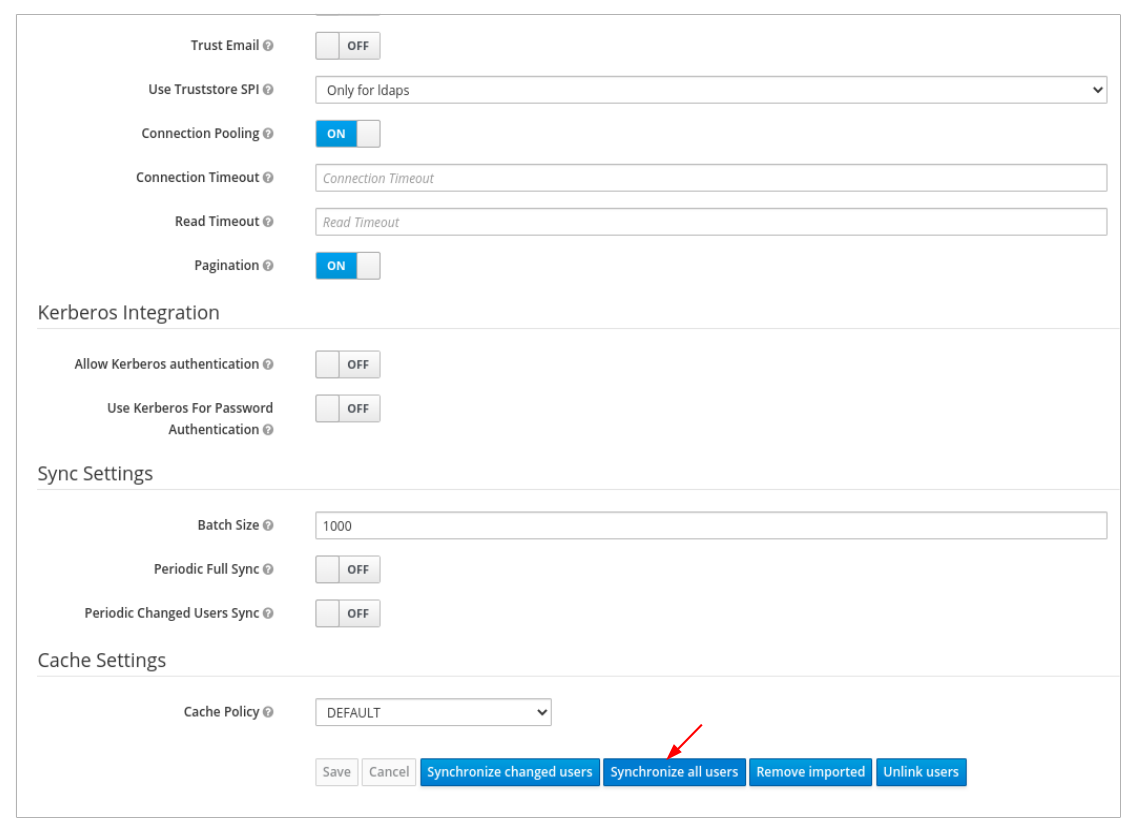
You will get a notification that the sync of users is finished successfully.
In the Users tab, search for the user added to the dashboard and click the Search icon:
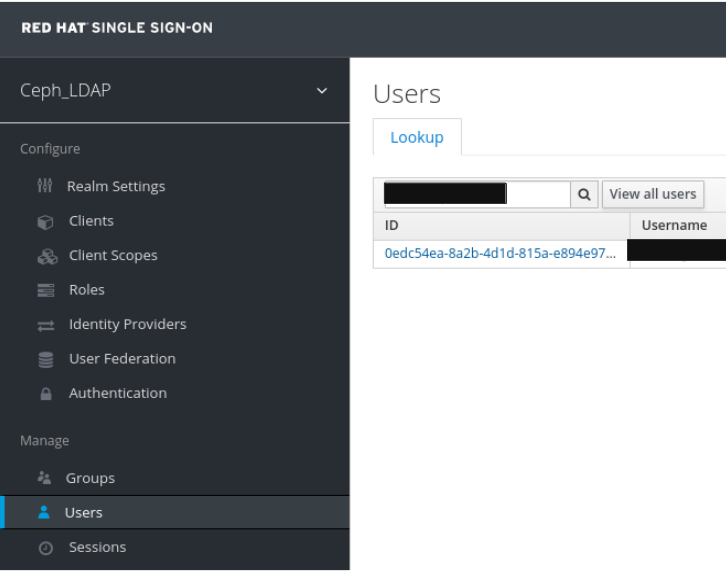
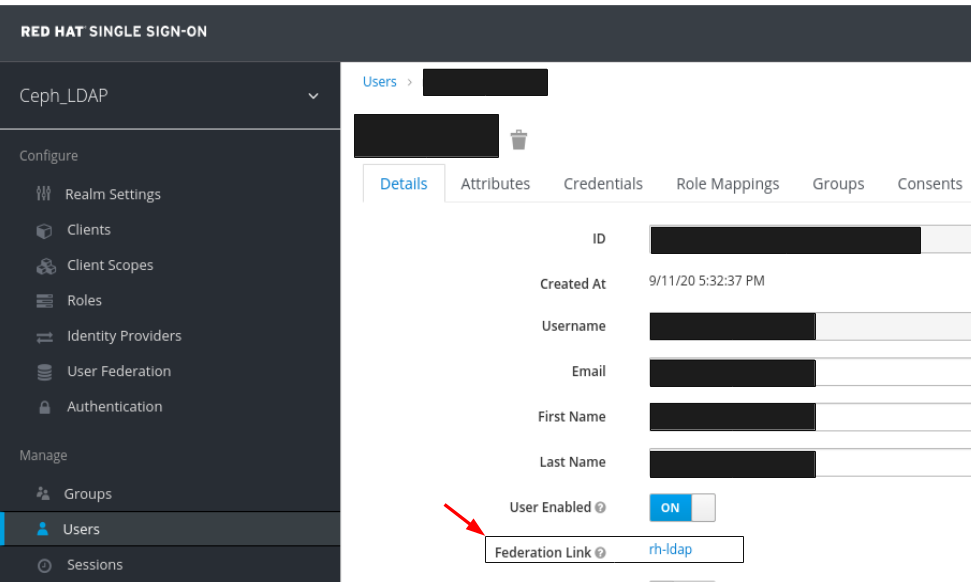
To view the user , click the specific row. You should see the federation link as the name provided for the User Federation.
 Important
Do not add users manually as the users will not be synchronized by LDAP. If added manually, delete the user by clicking Delete.
NoteIf Red Hat SSO is currently being used within your work environment, be sure to first enable SSO. For more information, see the Enabling Single Sign-On with SAMLE 2.0 for the Ceph Dashboard section in the Red Hat Ceph Storage Dashboard Guide.
Verification
Users added to the realm and the dashboard can access the Ceph dashboard with their mail address and password.
Example
https://example.ceph.redhat.com:8443
2.11.3. Enabling Single Sign-On with SAML 2.0 for the Ceph Dashboard
The Ceph Dashboard supports external authentication of users with the Security Assertion Markup Language (SAML) 2.0 protocol. Before using single sign-On (SSO) with the Ceph dashboard, create the dashboard user accounts and assign the desired roles. The Ceph Dashboard performs authorization of the users and the authentication process is performed by an existing Identity Provider (IdP). You can enable single sign-on using the SAML protocol.
Prerequisites
- A running Red Hat Ceph Storage cluster.
- Installation of the Ceph Dashboard.
- Root-level access to The Ceph Manager hosts.
Procedure
To configure SSO on Ceph Dashboard, run the following command:
Syntax
cephadm shell CEPH_MGR_HOST ceph dashboard sso setup saml2 CEPH_DASHBOARD_BASE_URL IDP_METADATA IDP_USERNAME_ATTRIBUTE IDP_ENTITY_ID SP_X_509_CERT SP_PRIVATE_KEYExample
[root@host01 ~]# cephadm shell host01 ceph dashboard sso setup saml2 https://dashboard_hostname.ceph.redhat.com:8443 idp-metadata.xml username https://10.70.59.125:8080/auth/realms/realm_name /home/certificate.txt /home/private-key.txtReplace
-
CEPH_MGR_HOST with Ceph
mgrhost. For example,host01 - CEPH_DASHBOARD_BASE_URL with the base URL where Ceph Dashboard is accessible.
- IDP_METADATA with the URL to remote or local path or content of the IdP metadata XML. The supported URL types are http, https, and file.
- Optional: IDP_USERNAME_ATTRIBUTE with the attribute used to get the username from the authentication response. Defaults to uid.
- Optional: IDP_ENTITY_ID with the IdP entity ID when more than one entity ID exists on the IdP metadata.
- Optional: SP_X_509_CERT with the file path of the certificate used by Ceph Dashboard for signing and encryption.
- Optional: SP_PRIVATE_KEY with the file path of the private key used by Ceph Dashboard for signing and encryption.
-
CEPH_MGR_HOST with Ceph
Verify the current SAML 2.0 configuration:
Syntax
cephadm shell CEPH_MGR_HOST ceph dashboard sso show saml2Example
[root@host01 ~]# cephadm shell host01 ceph dashboard sso show saml2To enable SSO, run the following command:
Syntax
cephadm shell CEPH_MGR_HOST ceph dashboard sso enable saml2
SSO is "enabled" with "SAML2" protocol.
Example
[root@host01 ~]# cephadm shell host01 ceph dashboard sso enable saml2Open your dashboard URL.
Example
https://dashboard_hostname.ceph.redhat.com:8443- On the SSO page, enter the login credentials. SSO redirects to the dashboard web interface.
2.11.4. Configuring Red Hat SSO as the identity provider using OAuth2 Protocol
You can enable single sign-on (SSO) for the IBM Storage Ceph Dashboard by configuring Red Hat SSO as the Identity Provider (IdP).
Prerequisites
- A running Red Hat Ceph Storage cluster.
- A subvolume group with corresponding subvolumes.
-
Enable the Ceph Management gateway (
mgmt-gateway) service. For more information, see Enabling the Ceph Management gateway. -
Enable the OAuth2 Proxy service (
oauth2-proxy). For more information, see Enabling the OAuth2 Proxy service. - Ensure that oauth2 proxy and identity provider are configured before you can configure the Identity Provider.
Procedure
Create a realm in Red Hat SSO.
- Click the Master drop-down menu and select Add Realm.
- Enter a case-sensitive name for the realm.
- Set Enabled to ON and click Create.
Configure realm settings.
- Go to the Realm Settings tab.
- Set Enabled to ON and User-Managed Access to ON.
- Click* Save*.
- Copy the OpenID Endpoint Configuration URL. Use the issuer endpoint from this configuration for OAuth2 Proxy setup.
Example
Issuer: http://<your-ip>:<port>/realms/<realm-name>Create and configure the OIDC client.
- Create a client of type OpenID Connect.
- Enable client authentication and authorization.
Set redirect URLs.
- Valid redirect URL: https://<host_name|IP_address>/oauth2/callback
- Valid logout redirect URL: https://<host_name|IP_address>/oauth2/sign_out
- Go to the Credentials tab and note the values for client_id and client_secret.These credentials are required to configure the oauth2-proxy service.
Create a role for dashboard access.
- Navigate to the Roles tab.
- Create a role and assign it to the OIDC client.
- Use a role name supported by the IBM Storage Ceph dashboard.
Create a user and assign roles.
- Create a new user.
- Define user credentials.
- Open the Role Mappings tab and assign the previously created role to the user.
Enable SSO for the dashboard.
Syntax
ceph dashboard sso enable
SSO is now enabled for the Ceph management stack. When users access the dashboard, they are redirected to the Red Hat SSO login page. After successful authentication, users are granted access across all monitoring stacks, including dashboard, Grafana, and Prometheus, based on the roles assigned in Red Hat SSO.
2.11.5. Configuring IBM Security Verify as the identity provider using OAuth2 protocol
You can enable single sign-on (SSO) for the IBM Storage Ceph Dashboard by configuring IBM Security Verify as the Identity Provider (IdP).
Prerequisites
- A running Red Hat Ceph Storage cluster.
- Installation of the Ceph Dashboard.
-
Enable the Ceph Management gateway (
mgmt-gateway) service. For more information, see Enabling the Ceph Management gateway. -
Enable the OAuth2 Proxy service (
oauth2-proxy). For more information, see Enabling the OAuth2 Proxy service.
Procedure
- From the IBM Security Verify application, navigate to the Applications > Application and and click Add An Application.
- Under Application Type , select Custom Application and click Add Application.
- Add the company name under the General tab.
- Navigate to Sign-on tab and select Open ID Connect 1.0 from the Sign-on Method drop-down list.
Enter the mgmt-gateway URL under the Application URL section.
Example
https://<HOSTNAME/IP_OF_THE_MGMT-GATEWAY_HOST>- Clear the PKCE verification checkbox.
From the Redirect URIs section, fill in the redirect the URIs. Use the following redirect URL format.
From the Token settings, select JWT as the access token format. For each of the following attributes, enter the details in the respective fields and then select the corresponding attribute source from the drop-down list:
- name | preferred_username
- email | email
- From the Consent Settings, select Do not ask for consent from the drop-down list.
- From the Custom Scopes, clear the Restrict Custom Scopes checkbox and click Save.
Add a user.
- Navigate to Directory > Users & Groups and click Add User.
- Provide the desired username and a valid email address.The initial user credentials are sent to the email address provided.
- Click Save.
Navigate to the Directory > Attributes and click Add Attribute.
- Select Custom Attribute, and then select the Single Sign On (SSO) checkbox. Click Next.
- In the Attribute Name field, enter roles.
- Under Data Type, select Multivalue String from the drop-down list.
- Click Additional settings, select Lowercase from the Apply Transformation drop-down list and click Next.
- Click Add Attribute.
Navigate to Directory > Users & Groups and edit the newly added user.
- Select View Extended Profile.
- From Custom User Attributes, add your desired dashboard role. For example, administrator, read-only, block-manager, and so on. This user inherit the dashboard roles automatically.
- Click Save settings.
Go to Applications > Application and click the Settings icon for the custom application created in step 2.
- From the Sign-on tab, go to *Token setting*s.
- For the roles attribute, enter the detail in the respective fields and then select the corresponding attribute source from the drop-down list: roles | roles
- From the Entitlements tab add the newly created user and click Save.
2.11.6. Enabling OAuth2 single sign-on
Enable OAuth2 single sign-on (SSO) for the Ceph Dashboard. OAuth2 SSO uses the oauth2-proxy service.
Enabling OAuth2 single sign-on is Technology Preview for Red Hat Ceph Storage 8.0.
Technology Preview features are not supported with Red Hat production service level agreements (SLAs), might not be functionally complete, and Red Hat does not recommend using them for production. These features provide early access to upcoming product features, enabling customers to test functionality and provide feedback during the development process. See the support scope for Red Hat Technology Preview features for more details.
Prerequisites
Before you begin, make sure that you have the following prerequisites in place:
- A running Red Hat Ceph Storage cluster.
- Installation of the Ceph Dashboard.
- Root-level access to the Ceph Manager hosts.
- An admin account with Red Hat Single-Sign on 7.6.0. For more information, see Creating an admin account with Red Hat Single Sign-On 7.6.0.
-
Enable the Ceph Management gateway (
mgmt-gateway) service. For more information, see Enabling the Ceph Management gateway. -
Enable the OAuth2 Proxy service (
oauth2-proxy). For more information, see Enabling the OAuth2 Proxy service. - You should either have an admin account with Red Hat Single-Sign-On 7.6.0 with OAuth2 protocol running or IBM Security Verify with OAuth2 protocol running. For more information, see Configuring IBM Security Verify as the identity provider using OAuth2 protocol.
Procedure
Enable Ceph Dashboard OAuth2 SSO access.
Syntax
ceph dashboard sso enable oauth2Example
[ceph: root@host01 /]# ceph dashboard sso enable oauth2
SSO is "enabled" with "oauth2" protocol.
Set the valid redirect URL.
Syntax
https://HOST_NAME|IP_ADDRESS/oauth2/callbackNoteThis URL must be the same redirect URL as configured in the OAuth2 Proxy service.
Configure a valid user role.
NoteFor the Administrator role, configure the IDP user with an administrator or read-only access.
Open your dashboard URL.
Example
https://<hostname/ip address of mgmt-gateway host>- On the SSO page, enter the Identity Provider (IdP) credentials. The SSO redirects to the dashboard web interface.
Verification
Check the SSO status at any time with the cephadm shell ceph dashboard sso status command.
Example
[root@host01 ~]# cephadm shell ceph dashboard sso status
SSO is "enabled" with "oauth2" protocol.
2.11.7. Disabling Single Sign-On for the Ceph Dashboard
You can disable SAML 2.0 and OAuth2 SSO for the Ceph Dashboard at any time.
Prerequisites
Before you begin, make sure that you have the following prerequisites in place:
- A running Red Hat Ceph Storage cluster.
- Installation of the Ceph Dashboard.
- Root-level access to The Ceph Manager hosts.
- Single sign-on enabled for Ceph Dashboard
Procedure
To view status of SSO, run the following command:
Syntax
cephadm shell CEPH_MGR_HOST ceph dashboard sso statusExample
[root@host01 ~]#  cephadm shell host01 ceph dashboard sso status
SSO is "enabled" with "SAML2" protocol.
To disable SSO, run the following command:
Syntax
cephadm shell CEPH_MGR_HOST ceph dashboard sso disable
SSO is "disabled".
Example
[root@host01 ~]# cephadm shell host01 ceph dashboard sso disable