Dieser Inhalt ist in der von Ihnen ausgewählten Sprache nicht verfügbar.
Chapter 10. Enabling Volume Metrics in OpenShift 3.10 and 3.11
Prometheus is a stand-alone, open source systems monitoring and alerting toolkit and shipped with OpenShift. You can use Prometheus to visualize metrics and alerts for OpenShift Container Platform system resources as PVs and services like heketi.
Heketi provides a RESTful management interface which can be used to manage the life cycle of GlusterFS volumes,as well as a metrics endpoint which can be scraped by Prometheus.
The way Prometheus is integrated into OpenShift differs slightly between OCP 3.10 and 3.11.
For more information on how to setup Prometheus in OCP 3.10, see Prometheus on OpenShift Container Platform.
For more information on how to setup Prometheus in OCP 3.11, see Prometheus Cluster Monitoring.
10.1. Available Metrics for File Storage and Block Storage
The following list provides different metrics of the PVs that can be viewed on Prometheus:
- kubelet_volume_stats_available_bytes
- Number of available bytes in the volume.
- kubelet_volume_stats_capacity_bytes
- Capacity in bytes of the volume.
- kubelet_volume_stats_inodes
- Maximum number of inodes in the volume.
- kubelet_volume_stats_inodes_free
- Number of free inodes in the volume.
- kubelet_volume_stats_inodes_used
- Number of used inodes in the volume.
- kubelet_volume_stats_used_bytes
- Number of used bytes in the volume.
The Heketi service provides the following metrics:
- heketi_cluster_count
- Number of clusters.
- heketi_device_brick_count
- Number of bricks on device.
- heketi_device_count
- Number of devices on host.
- heketi_device_free_bytes
- Amount of free space available on the device.
- heketi_device_size_bytes
- Total size of the device.
- heketi_device_used_bytes
- Amount of space used on the device.
- heketi_nodes_count
- Number of nodes on the cluster.
- heketi_up
- Verifies if heketi is running.
- heketi_volumes_count
- Number of volumes on cluster.
- heketi_block_volumes_count
- Number of block volumes on cluster.
10.2. Enabling Heketi Metrics in OpenShift 3.10
To view Heketi metrics on Prometheus in OCP 3.10, execute the following commands:
Add annotations to the
heketi-storageservice (normally running in the app-storage namespace).# oc project app-storage # oc annotate svc heketi-storage prometheus.io/scheme=http # oc annotate svc heketi-storage prometheus.io/scrape=true# oc describe svc heketi-storage Name: heketi-storage Namespace: app-storage Labels: glusterfs=heketi-storage-service heketi=storage-service Annotations: description=Exposes Heketi service prometheus.io/scheme=http prometheus.io/scrape=true Selector: glusterfs=heketi-storage-pod Type: ClusterIP IP: 172.30.90.87 Port: heketi 8080/TCP TargetPort: 8080/TCP Endpoints: 172.18.14.2:8080 Session Affinity: NoneAdd the
app-storagenamespace for the heketi service in the Prometheus configmap.# oc get cm prometheus -o yaml -n openshift-metrics .... - job_name: 'kubernetes-service-endpoints' tls_config: ca_file: /var/run/secrets/kubernetes.io/serviceaccount/ca.crt # TODO: this should be per target insecure_skip_verify: true kubernetes_sd_configs: - role: endpoints relabel_configs: # only scrape infrastructure components - source_labels: [__meta_kubernetes_namespace] action: keep regex: 'default|logging|metrics|kube-.+|openshift|openshift-.+|app-storage'Do the above for all other storage namespaces (for example: infra-storage).
-
Restart the
prometheus-0pod to query the Heketi metrics in Prometheus.
10.3. Enabling Heketi Metrics in OpenShift 3.11
In OCP 3.11, Prometheus uses servicemonitors, which are new resources introduced by the Prometheus Operator. The servicemonitors need to be created for every storage namespace and they describe the set of targets to be monitored.
To view Heketi metrics on Prometheus in OCP 3.11, execute the following commands:
Add annotations to the
heketi-storageservice.# oc project app-storage # oc annotate svc heketi-storage prometheus.io/scheme=http # oc annotate svc heketi-storage prometheus.io/scrape=trueCreate a
heketi-appservicemonitor in the openshift-monitoring namespace using the below template:# cat heketi-app-sm.yml apiVersion: monitoring.coreos.com/v1 kind: ServiceMonitor metadata: name: heketi-app labels: k8s-app: heketi-app namespace: openshift-monitoring spec: endpoints: - bearerTokenFile: /var/run/secrets/kubernetes.io/serviceaccount/token interval: 30s port: heketi scheme: http targetPort: 0 namespaceSelector: matchNames: - app-storage selector: matchLabels: heketi: storage-serviceWhere, the namespaceSelector and label need to match the values in the heketi-storage service:
# oc describe svc heketi-storage -n app-storage
Name:              heketi-storage
Namespace:         app-storage
Labels:            glusterfs=heketi-storage-service
                   heketi=storage-service
Annotations:       description=Exposes Heketi service
                   prometheus.io/scheme=http
                   prometheus.io/scrape=true
Selector:          glusterfs=heketi-storage-pod
Type:              ClusterIP
IP:                172.30.3.92
Port:              heketi  8080/TCP
TargetPort:        8080/TCP
Endpoints:         10.128.4.12:8080
Session Affinity:  None
Events:            <none>
With the correct selectors set, create the servicemonitor in the openshift-monitoring namespace with the correct selectors set.
# oc create -f heketi-app-sm.yml -n openshift-monitoring
servicemonitor.monitoring.coreos.com "heketi-app" created
# oc get servicemonitor -n openshift-monitoring NAME AGE alertmanager 20d cluster-monitoring-operator 20d heketi-app 1m kube-apiserver 20d kube-controllers 20d kube-state-metrics 20d kubelet 20d node-exporter 20d prometheus 20d prometheus-operator 20d- In case you have multiple OCS clusters, one servicemonitor needs to be created per OCS cluster using the steps above.
Execute the following command to add cluster-reader rights to prometheus:
# oc adm policy add-cluster-role-to-user cluster-reader \ system:serviceaccount:openshift-monitoring:prometheus-k8s -n \ openshift-monitoring cluster role "cluster-reader" added: "system:serviceaccount:openshift-monitoring:prometheus-k8s"- After some minutes, Prometheus loads the new servicemonitors.
10.4. Viewing Metrics
To view any metrics:
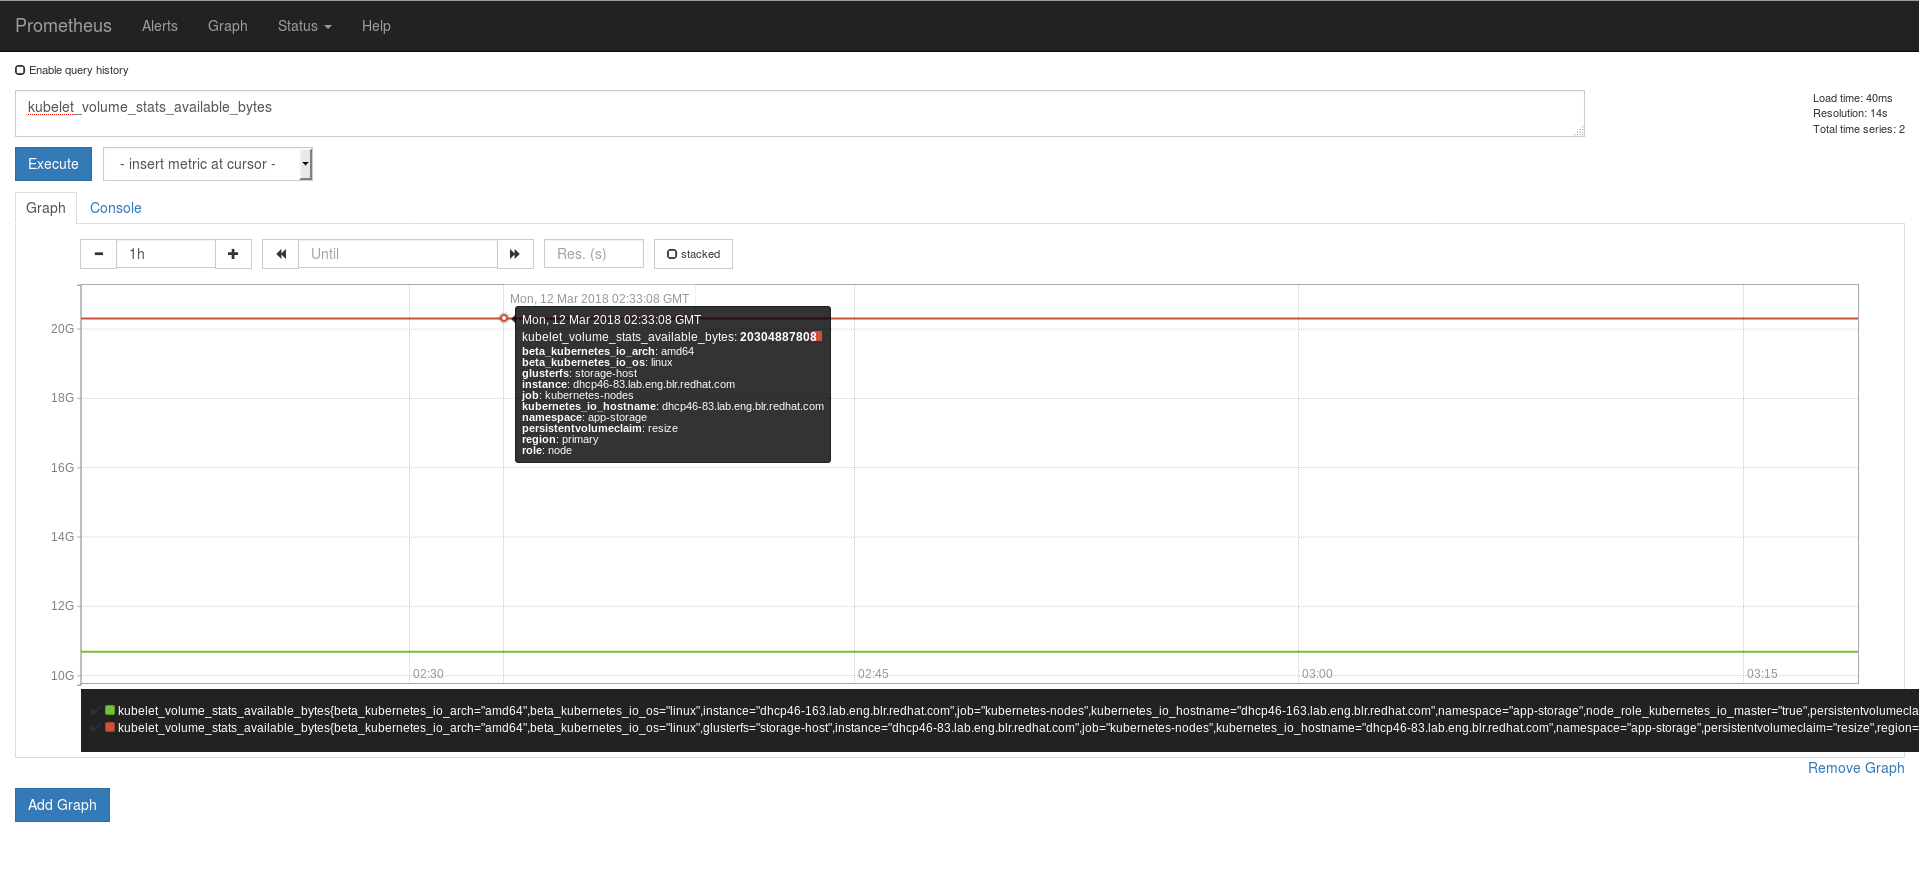
- Add the metrics name in Prometheus, and click Execute.
In the Graph tab, the value for the metrics for the volume is displayed as a graph.
For example, in the following image, to check the available bytes,
kubelet_volume_stats_available_bytesmetric is added to the search bar on Prometheus. On clicking Execute, the available bytes value is depicted as a graph. You can hover the mouse on the line to get more details. (To view the image in detail, right-click and select View Image.)