Validation and troubleshooting
Validating and troubleshooting an OpenShift Container Platform installation
Abstract
Chapter 1. Validating an installation
You can check the status of an OpenShift Container Platform cluster after an installation or validate boot artifacts before an installation by following the procedures in this document.
1.1. Validating RHCOS live media
The OpenShift Container Platform installation program contains pinned versions of RHCOS bootimages. Fully automated installations use these pinned artifacts by default. The mirror registry where you downloaded the installation program contains a sha256sum encrypted with the Red Hat product key.
For user-provisioned infrastructure installations, you can access information and use the OpenShift Container Platform installer to indirectly validate RHCOS bootimage artifacts using their SHA-256 checksums.
Procedure
Run the following command to print the metadata for any bootimage artifact:
$ openshift-install coreos print-stream-json | jq <bootimage>1 - 1
- The query for the bootimage you want to obtain information on. For validation purposes, the bootimage artifact must have a generated
sha256sum. This can include OVA, VHD, QCOW2 and others. For example, to get information on anx86_64architectureisofile for bare metal platforms, this value would be.architectures.x86_64.artifacts.metal.formats.iso.
Example output
{
  "disk": {
    "location": "<url>/art/storage/prod/streams/<release>/builds/rhcos-<release>-live.<architecture>.<artifact>",
    "sha256": "abc2add9746eb7be82e6919ec13aad8e9eae8cf073d8da6126d7c95ea0dee962"
  }
}
1.2. Reviewing the installation log
You can review a summary of an installation in the OpenShift Container Platform installation log. If an installation succeeds, the information required to access the cluster is included in the log.
Prerequisites
- You have access to the installation host.
Procedure
Review the
.openshift_install.loglog file in the installation directory on your installation host:$ cat <install_dir>/.openshift_install.logExample output
Cluster credentials are included at the end of the log if the installation is successful, as outlined in the following example:
...
time="2020-12-03T09:50:47Z" level=info msg="Install complete!"
time="2020-12-03T09:50:47Z" level=info msg="To access the cluster as the system:admin user when using 'oc', run 'export KUBECONFIG=/home/myuser/install_dir/auth/kubeconfig'"
time="2020-12-03T09:50:47Z" level=info msg="Access the OpenShift web-console here: https://console-openshift-console.apps.mycluster.example.com"
time="2020-12-03T09:50:47Z" level=info msg="Login to the console with user: \"kubeadmin\", and password: \"password\""
time="2020-12-03T09:50:47Z" level=debug msg="Time elapsed per stage:"
time="2020-12-03T09:50:47Z" level=debug msg="    Infrastructure: 6m45s"
time="2020-12-03T09:50:47Z" level=debug msg="Bootstrap Complete: 11m30s"
time="2020-12-03T09:50:47Z" level=debug msg=" Bootstrap Destroy: 1m5s"
time="2020-12-03T09:50:47Z" level=debug msg=" Cluster Operators: 17m31s"
time="2020-12-03T09:50:47Z" level=info msg="Time elapsed: 37m26s"
1.3. Viewing the image pull source
For clusters with unrestricted network connectivity, you can view the source of your pulled images by using a command on a node, such as crictl images.
However, for disconnected installations, to view the source of pulled images, you must review the CRI-O logs to locate the Trying to access log entry, as shown in the following procedure. Other methods to view the image pull source, such as the crictl images command, show the non-mirrored image name, even though the image is pulled from the mirrored location.
Prerequisites
-
You have access to the cluster as a user with the
cluster-adminrole.
Procedure
Review the CRI-O logs for a master or worker node:
$ oc adm node-logs <node_name> -u crioExample output
The
Trying to accesslog entry indicates where the image is being pulled from.... Mar 17 02:52:50 ip-10-0-138-140.ec2.internal crio[1366]: time="2021-08-05 10:33:21.594930907Z" level=info msg="Pulling image: quay.io/openshift-release-dev/ocp-release:4.10.0-ppc64le" id=abcd713b-d0e1-4844-ac1c-474c5b60c07c name=/runtime.v1alpha2.ImageService/PullImage Mar 17 02:52:50 ip-10-0-138-140.ec2.internal crio[1484]: time="2021-03-17 02:52:50.194341109Z" level=info msg="Trying to access \"li0317gcp1.mirror-registry.qe.gcp.devcluster.openshift.com:5000/ocp/release@sha256:1926eae7cacb9c00f142ec98b00628970e974284b6ddaf9a6a086cb9af7a6c31\"" Mar 17 02:52:50 ip-10-0-138-140.ec2.internal crio[1484]: time="2021-03-17 02:52:50.226788351Z" level=info msg="Trying to access \"li0317gcp1.mirror-registry.qe.gcp.devcluster.openshift.com:5000/ocp/release@sha256:1926eae7cacb9c00f142ec98b00628970e974284b6ddaf9a6a086cb9af7a6c31\"" ...The log might show the image pull source twice, as shown in the preceding example.
If your
ImageContentSourcePolicyobject lists multiple mirrors, OpenShift Container Platform attempts to pull the images in the order listed in the configuration, for example:Trying to access \"li0317gcp1.mirror-registry.qe.gcp.devcluster.openshift.com:5000/ocp/release@sha256:1926eae7cacb9c00f142ec98b00628970e974284b6ddaf9a6a086cb9af7a6c31\" Trying to access \"li0317gcp2.mirror-registry.qe.gcp.devcluster.openshift.com:5000/ocp/release@sha256:1926eae7cacb9c00f142ec98b00628970e974284b6ddaf9a6a086cb9af7a6c31\"
1.4. Getting cluster version, status, and update details
You can view the cluster version and status by running the oc get clusterversion command. If the status shows that the installation is still progressing, you can review the status of the Operators for more information.
You can also list the current update channel and review the available cluster updates.
Prerequisites
-
You have access to the cluster as a user with the
cluster-adminrole. -
You have installed the OpenShift CLI (
oc).
Procedure
Obtain the cluster version and overall status:
$ oc get clusterversionExample output
NAME      VERSION   AVAILABLE   PROGRESSING   SINCE   STATUS
version   4.6.4     True        False         6m25s   Cluster version is 4.6.4
The example output indicates that the cluster has been installed successfully.
If the cluster status indicates that the installation is still progressing, you can obtain more detailed progress information by checking the status of the Operators:
$ oc get clusteroperators.config.openshift.ioView a detailed summary of cluster specifications, update availability, and update history:
$ oc describe clusterversionList the current update channel:
$ oc get clusterversion -o jsonpath='{.items[0].spec}{"\n"}'Example output
{"channel":"stable-4.6","clusterID":"245539c1-72a3-41aa-9cec-72ed8cf25c5c"}Review the available cluster updates:
$ oc adm upgradeExample output
Cluster version is 4.6.4

Updates:

VERSION IMAGE
4.6.6   quay.io/openshift-release-dev/ocp-release@sha256:c7e8f18e8116356701bd23ae3a23fb9892dd5ea66c8300662ef30563d7104f39
1.5. Querying the status of the cluster nodes by using the CLI
You can verify the status of the cluster nodes after an installation.
Prerequisites
-
You have access to the cluster as a user with the
cluster-adminrole. -
You have installed the OpenShift CLI (
oc).
Procedure
List the status of the cluster nodes. Verify that the output lists all of the expected control plane and compute nodes and that each node has a
Readystatus:$ oc get nodesExample output
NAME                          STATUS   ROLES    AGE   VERSION
compute-1.example.com         Ready    worker   33m   v1.25.0
control-plane-1.example.com   Ready    master   41m   v1.25.0
control-plane-2.example.com   Ready    master   45m   v1.25.0
compute-2.example.com         Ready    worker   38m   v1.25.0
compute-3.example.com         Ready    worker   33m   v1.25.0
control-plane-3.example.com   Ready    master   41m   v1.25.0
Review CPU and memory resource availability for each cluster node:
$ oc adm top nodesExample output
NAME                          CPU(cores)   CPU%   MEMORY(bytes)   MEMORY%
compute-1.example.com         128m         8%     1132Mi          16%
control-plane-1.example.com   801m         22%    3471Mi          23%
control-plane-2.example.com   1718m        49%    6085Mi          40%
compute-2.example.com         935m         62%    5178Mi          75%
compute-3.example.com         111m         7%     1131Mi          16%
control-plane-3.example.com   942m         26%    4100Mi          27%
1.6. Reviewing the cluster status from the OpenShift Container Platform web console
You can review the following information in the Overview page in the OpenShift Container Platform web console:
- The general status of your cluster
- The status of the control plane, cluster Operators, and storage
- CPU, memory, file system, network transfer, and pod availability
- The API address of the cluster, the cluster ID, and the name of the provider
- Cluster version information
- Cluster update status, including details of the current update channel and available updates
- A cluster inventory detailing node, pod, storage class, and persistent volume claim (PVC) information
- A list of ongoing cluster activities and recent events
Prerequisites
-
You have access to the cluster as a user with the
cluster-adminrole.
Procedure
- In the Administrator perspective, navigate to Home → Overview.
1.7. Reviewing the cluster status from Red Hat OpenShift Cluster Manager
From the OpenShift Container Platform web console, you can review detailed information about the status of your cluster on OpenShift Cluster Manager.
Prerequisites
- You are logged in to OpenShift Cluster Manager Hybrid Cloud Console.
-
You have access to the cluster as a user with the
cluster-adminrole.
Procedure
- Go to the Clusters list in OpenShift Cluster Manager Hybrid Cloud Console and locate your OpenShift Container Platform cluster.
- Click the Overview tab for your cluster.
Review the following information about your cluster:
- vCPU and memory availability and resource usage
- The cluster ID, status, type, region, and the provider name
- Node counts by node type
- Cluster version details, the creation date of the cluster, and the name of the cluster owner
- The life cycle support status of the cluster
Subscription information, including the service level agreement (SLA) status, the subscription unit type, the production status of the cluster, the subscription obligation, and the service level
TipTo view the history for your cluster, click the Cluster history tab.
Navigate to the Monitoring page to review the following information:
- A list of any issues that have been detected
- A list of alerts that are firing
- The cluster Operator status and version
- The cluster’s resource usage
Optional: You can view information about your cluster that Red Hat Insights collects by navigating to the Overview menu. From this menu you can view the following information:
- Potential issues that your cluster might be exposed to, categorized by risk level
- Health-check status by category
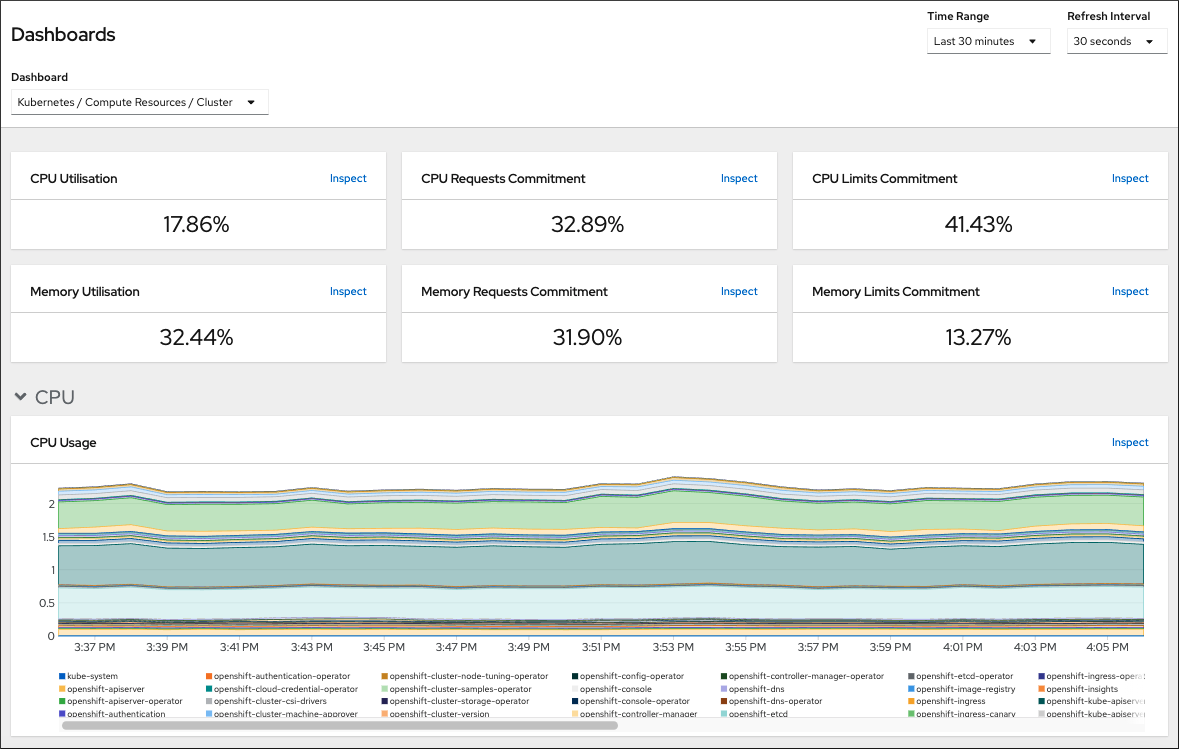
1.8. Checking cluster resource availability and utilization
OpenShift Container Platform provides a comprehensive set of monitoring dashboards that help you understand the state of cluster components.
In the Administrator perspective, you can access dashboards for core OpenShift Container Platform components, including:
- etcd
- Kubernetes compute resources
- Kubernetes network resources
- Prometheus
- Dashboards relating to cluster and node performance
Figure 1.1. Example compute resources dashboard
Prerequisites
-
You have access to the cluster as a user with the
cluster-adminrole.
Procedure
- In the Administrator perspective in the OpenShift Container Platform web console, navigate to Observe → Dashboards.
- Choose a dashboard in the Dashboard list. Some dashboards, such as the etcd dashboard, produce additional sub-menus when selected.
Optional: Select a time range for the graphs in the Time Range list.
- Select a pre-defined time period.
Set a custom time range by selecting Custom time range in the Time Range list.
- Input or select the From and To dates and times.
- Click Save to save the custom time range.
- Optional: Select a Refresh Interval.
- Hover over each of the graphs within a dashboard to display detailed information about specific items.
1.9. Listing alerts that are firing
Alerts provide notifications when a set of defined conditions are true in an OpenShift Container Platform cluster. You can review the alerts that are firing in your cluster by using the Alerting UI in the OpenShift Container Platform web console.
Prerequisites
-
You have access to the cluster as a user with the
cluster-adminrole.
Procedure
- In the Administrator perspective, navigate to the Observe → Alerting → Alerts page.
- Review the alerts that are firing, including their Severity, State, and Source.
- Select an alert to view more detailed information in the Alert Details page.
1.10. Next steps
- See Troubleshooting installations if you experience issues when installing your cluster.
- After installing OpenShift Container Platform, you can further expand and customize your cluster.
Chapter 2. Troubleshooting installation issues
To assist in troubleshooting a failed OpenShift Container Platform installation, you can gather logs from the bootstrap and control plane machines. You can also get debug information from the installation program. If you are unable to resolve the issue using the logs and debug information, see Determining where installation issues occur for component-specific troubleshooting.
If your OpenShift Container Platform installation fails and the debug output or logs contain network timeouts or other connectivity errors, review the guidelines for configuring your firewall. Gathering logs from your firewall and load balancer can help you diagnose network-related errors.
2.1. Prerequisites
- You attempted to install an OpenShift Container Platform cluster and the installation failed.
2.2. Gathering logs from a failed installation
If you gave an SSH key to your installation program, you can gather data about your failed installation.
You use a different command to gather logs about an unsuccessful installation than to gather logs from a running cluster. If you must gather logs from a running cluster, use the oc adm must-gather command.
Prerequisites
- Your OpenShift Container Platform installation failed before the bootstrap process finished. The bootstrap node is running and accessible through SSH.
-
The
ssh-agentprocess is active on your computer, and you provided the same SSH key to both thessh-agentprocess and the installation program. - If you tried to install a cluster on infrastructure that you provisioned, you must have the fully qualified domain names of the bootstrap and control plane nodes.
Procedure
Generate the commands that are required to obtain the installation logs from the bootstrap and control plane machines:
If you used installer-provisioned infrastructure, change to the directory that contains the installation program and run the following command:
$ ./openshift-install gather bootstrap --dir <installation_directory>1 - 1
installation_directoryis the directory you specified when you ran./openshift-install create cluster. This directory contains the OpenShift Container Platform definition files that the installation program creates.
For installer-provisioned infrastructure, the installation program stores information about the cluster, so you do not specify the hostnames or IP addresses.
If you used infrastructure that you provisioned yourself, change to the directory that contains the installation program and run the following command:
$ ./openshift-install gather bootstrap --dir <installation_directory> \1 --bootstrap <bootstrap_address> \2 --master <master_1_address> \3 --master <master_2_address> \4 --master <master_3_address>"5 - 1
- For
installation_directory, specify the same directory you specified when you ran./openshift-install create cluster. This directory contains the OpenShift Container Platform definition files that the installation program creates. - 2
<bootstrap_address>is the fully qualified domain name or IP address of the cluster’s bootstrap machine.- 3 4 5
- For each control plane, or master, machine in your cluster, replace
<master_*_address>with its fully qualified domain name or IP address.
NoteA default cluster contains three control plane machines. List all of your control plane machines as shown, no matter how many your cluster uses.
Example output
INFO Pulling debug logs from the bootstrap machine
INFO Bootstrap gather logs captured here "<installation_directory>/log-bundle-<timestamp>.tar.gz"
If you open a Red Hat support case about your installation failure, include the compressed logs in the case.
2.3. Manually gathering logs with SSH access to your host(s)
Manually gather logs in situations where must-gather or automated collection methods do not work.
By default, SSH access to the OpenShift Container Platform nodes is disabled on the Red Hat OpenStack Platform (RHOSP) based installations.
Prerequisites
- You must have SSH access to your host(s).
Procedure
Collect the
bootkube.serviceservice logs from the bootstrap host using thejournalctlcommand by running:$ journalctl -b -f -u bootkube.serviceCollect the bootstrap host’s container logs using the podman logs. This is shown as a loop to get all of the container logs from the host:
$ for pod in $(sudo podman ps -a -q); do sudo podman logs $pod; doneAlternatively, collect the host’s container logs using the
tailcommand by running:# tail -f /var/lib/containers/storage/overlay-containers/*/userdata/ctr.logCollect the
kubelet.serviceandcrio.serviceservice logs from the master and worker hosts using thejournalctlcommand by running:$ journalctl -b -f -u kubelet.service -u crio.serviceCollect the master and worker host container logs using the
tailcommand by running:$ sudo tail -f /var/log/containers/*
2.4. Manually gathering logs without SSH access to your host(s)
Manually gather logs in situations where must-gather or automated collection methods do not work.
If you do not have SSH access to your node, you can access the systems journal to investigate what is happening on your host.
Prerequisites
- Your OpenShift Container Platform installation must be complete.
- Your API service is still functional.
- You have system administrator privileges.
Procedure
Access
journaldunit logs under/var/logby running:$ oc adm node-logs --role=master -u kubeletAccess host file paths under
/var/logby running:$ oc adm node-logs --role=master --path=openshift-apiserver
2.5. Getting debug information from the installation program
You can use any of the following actions to get debug information from the installation program.
Look at debug messages from a past installation in the hidden
.openshift_install.logfile. For example, enter:$ cat ~/<installation_directory>/.openshift_install.log1 - 1
- For
installation_directory, specify the same directory you specified when you ran./openshift-install create cluster.
Change to the directory that contains the installation program and re-run it with
--log-level=debug:$ ./openshift-install create cluster --dir <installation_directory> --log-level debug1 - 1
- For
installation_directory, specify the same directory you specified when you ran./openshift-install create cluster.
2.6. Reinstalling the OpenShift Container Platform cluster
If you are unable to debug and resolve issues in the failed OpenShift Container Platform installation, consider installing a new OpenShift Container Platform cluster. Before starting the installation process again, you must complete thorough cleanup. For a user-provisioned infrastructure (UPI) installation, you must manually destroy the cluster and delete all associated resources. The following procedure is for an installer-provisioned infrastructure (IPI) installation.
Procedure
Destroy the cluster and remove all the resources associated with the cluster, including the hidden installer state files in the installation directory:
$ ./openshift-install destroy cluster --dir <installation_directory>1 - 1
installation_directoryis the directory you specified when you ran./openshift-install create cluster. This directory contains the OpenShift Container Platform definition files that the installation program creates.
Before reinstalling the cluster, delete the installation directory:
$ rm -rf <installation_directory>- Follow the procedure for installing a new OpenShift Container Platform cluster.
Legal Notice
Copyright © Red Hat
OpenShift documentation is licensed under the Apache License 2.0 (https://www.apache.org/licenses/LICENSE-2.0).
Modified versions must remove all Red Hat trademarks.
Portions adapted from https://github.com/kubernetes-incubator/service-catalog/ with modifications by Red Hat.
Red Hat, Red Hat Enterprise Linux, the Red Hat logo, the Shadowman logo, JBoss, OpenShift, Fedora, the Infinity logo, and RHCE are trademarks of Red Hat, Inc., registered in the United States and other countries.
Linux® is the registered trademark of Linus Torvalds in the United States and other countries.
Java® is a registered trademark of Oracle and/or its affiliates.
XFS® is a trademark of Silicon Graphics International Corp. or its subsidiaries in the United States and/or other countries.
MySQL® is a registered trademark of MySQL AB in the United States, the European Union and other countries.
Node.js® is an official trademark of the OpenJS Foundation.
The OpenStack® Word Mark and OpenStack logo are either registered trademarks/service marks or trademarks/service marks of the OpenStack Foundation, in the United States and other countries and are used with the OpenStack Foundation’s permission. We are not affiliated with, endorsed or sponsored by the OpenStack Foundation, or the OpenStack community.
All other trademarks are the property of their respective owners.