Network Observability
Configuring and using the Network Observability Operator in OpenShift Container Platform
Abstract
Chapter 1. Network Observability Operator release notes
The Network Observability Operator enables administrators to observe and analyze network traffic flows for OpenShift Container Platform clusters.
These release notes track the development of the Network Observability Operator in the OpenShift Container Platform.
For an overview of the Network Observability Operator, see About network observability.
1.1. Network Observability Operator 1.11 advisory
You can review the advisory for Network Observability Operator 1.11 release.
1.2. Network Observability Operator 1.11 new features and enhancements
Learn about the new features and enhancements in the Network Observability Operator 1.11 release, including hierarchical governance with the FlowCollectorSlice resource, a new Service deployment model, and the general availability of health rules.
- Per-tenant hierarchical governance with the FlowCollectorSlice resource
This release introduces the
FlowCollectorSliceAPI to support hierarchical governance, allowing project administrators to independently manage sampling and subnet labeling for their specific namespaces.This feature was implemented to reduce global processing overhead and provide tenant autonomy in large-scale environments where individual teams require self-service visibility without cluster-wide configuration changes. As a result, organizations can selectively collect traffic and delegate data enrichment tasks to the project level while maintaining centralized cluster control.
- New Service deployment model for the
FlowCollectorresource This release introduces a new
Servicedeployment model in theFlowCollectorcustom resource. This model provides an intermediate option between theDirectandKafkamodels. In theServicemodel, the eBPF agent is deployed as adaemonset, and theflowlogs-pipelinecomponent is deployed as a scalable service.This model offers improved performance in large clusters by reducing cache duplication across component instances.
- Health rules are generally available
The health alerts feature, introduced in previous versions as a Technology Preview feature, is fully supported as health rules in the Network Observability Operator 1.11 release.
ImportantNetwork Observability health rules are available on OpenShift Container Platform 4.16 and later.
This eBPF-based system correlates network metrics with infrastructure metadata to provide proactive notifications and automated insights into cluster health, such as traffic surges or latency trends. As a result, you can use the Network Health dashboard in the OpenShift Container Platform web console to manage categorized alerts, customize thresholds, and create recording rules for improved visualization performance.
- Enhanced network traffic visualization and filtering
This release introduces enhanced visualization and filtering tools in the OpenShift Container Platform web console.
- Inline filter editing: You can now edit filter chips directly within the filter input field. This enhancement provides a more efficient method for modifying long filter values that were previously truncated, eliminating the need to manually copy and paste values. This update adopts an inline editing convention consistent with the Saved filters feature.
- External traffic quick filters: New quick filters allow you to monitor external ingress and egress traffic actively. This enhancement streamlines network management, enabling you to identify and address issues related to external network communication quickly.
- Intuitive resource iconography: The OpenShift Container Platform console now uses specific icons for Kubernetes kinds, groups, and filters. These icons provide a more intuitive and visually consistent experience, making it easier to navigate the network topology and identify applied filters at a glance.
- DNS resolution analysis
This release includes eBPF-based DNS tracking to enrich network flow records with domain names.
This feature was implemented to reduce the mean time to identify (MTTI) by allowing administrators to immediately distinguish between network routing failures and service discovery issues, such as
NXDOMAINerrors.- Integration with Gateway API
This release introduces automatic integration between the Network Observability Operator and the Gateway API when a
GatewayClassresource is created. This feature provides high-level traffic attribution for cluster ingress and egress traffic without requiring manual configuration of theFlowCollectorresource.ImportantIntegration with Gateway API is available on OpenShift Container Platform 4.19 and later.
You can verify the automated mapping of network flows to Gateway API resources in the Observe → Network Traffic view of the OpenShift Container Platform web console. The Owner column displays the Gateway name, providing a direct link to the associated Gateway resource page.
- Improved data resilience in the Overview and Topology views
With this release, functional data remains visible in the Overview and Topology views even if some background queries fail. This enhancement ensures that the scope and group drop-down menus in the Topology view remain accessible during partial service disruptions.
Additionally, the Overview page now displays active error messages to assist with troubleshooting, providing better visibility into system health without interrupting the monitoring workflow.
- Improved categorization of unknown network flows
With this release, network flows from unknown sources are categorized into four distinct groups: external, unknown service, unknown node, and unknown pod.
This enhancement uses subnet labels to separate unknown IP subnets, providing a clearer network topology. This improved visibility helps to identify potential security threats and allows for a more targeted analysis of unknown elements within the cluster.
- Improved performance for new Network Observability installations
The default performance of the Network Observability Operator is improved for new installations. The default value for
cacheActiveTimeoutis increased from 5 to 15 seconds, and thecacheMaxFlowsvalue is increased from 100,000 to 120,000 to accommodate higher flow volumes.ImportantThese new default values apply only to new installations; existing installations retain their current configurations.
These changes reduce CPU load by up to 40%.
- Improved LokiStack status monitoring and reporting
With this release, the Network Observability Operator monitors the status of the
LokiStackresource and reports errors or configuration issues. The Network Observability Operator verifiesLokiStackconditions, including pending or failed pods and specific warning conditions.This enhancement provides more actionable information in the
FlowCollectorstatus, allowing for more effective troubleshooting of theLokiStackcomponent within network observability.- Visual indicators for Loki indexed fields in the filter menu
With this release, functional data remains visible in the Overview and Topology views even if some background queries fail. This enhancement ensures that the scope and group drop-down menus in the Topology view remain accessible during partial service disruptions.
This enhancement improves query performance by indicating which fields are indexed for faster data retrieval. Using indexed fields when filtering data reduces the time required to browse and analyze network flows within the console.
1.3. Network Observability Operator 1.11 known issues
The following known issues affect the Network Observability Operator 1.11 release.
- Health rules do not trigger when the sampling rate increases because of
lowVolumeThreshold Network observability alerts might not trigger when an elevated sampling rate causes the volume to fall below the
lowVolumeThresholdfilter. This results in fewer alerts being evaluated or displayed.To work around this problem, adjust the
lowVolumeThresholdvalue to align with the sampling rate to ensure consistent alert evaluation.- DNS metrics unavailable when Loki is disabled
When the
DNSTrackingfeature is enabled in a "Loki-less" installation, the required metrics for DNS graphs are unavailable. As a consequence, you cannot view DNS latency and response codes in the dashboard.To work around this problem, you must either disable the
DNSTrackingoption or enable Loki in theFlowCollectorresource by settingspec.loki.enableto true.
1.4. Network Observability Operator 1.11 fixed issues
The Network Observability Operator 1.11 release contains several fixed issues that improve performance and the user experience.
- Missing dates in charts
Before this update, the chart tooltip date was not displayed as intended, due to a breaking change in a dependency. As a consequence, users experienced missing date information in the OpenShift Container Platform web console plugin’s Overview tab chart, affecting data context.
With this release, the chart tooltip date display is restored.
- Warning message for Direct mode not refreshed after upscaling
Before this update, cluster information was not refreshed after scaling, causing a warning message to persist in large clusters, not updating with changes.
With this release, cluster information is now refreshed when it changes, resulting in the warning message for large clusters in
Directmode updating with changes in cluster size, improving user visibility.- Unenriched OVN IPs
Before this update, some IPs declared by OVN-Kubernetes were not enriched, causing unenriched IPs like
100.64.0.xto not appear inMachinesnetwork. As a consequence, IPs not enriched caused the wrong network visibility for users.With this release, missing IPs in OVN-Kubernetes are now enriched. As a result, IPs declared by OVN-Kubernetes are correctly enriched and appear in the
Machinesnetwork improving the visibility of network traffic sources in theMachinesnetwork.- Improved operator API discovery reliability
Before this update, a race condition during Network Observability Operator startup could cause API discovery to fail silently. As a consequence, the operator could fail to recognize the OpenShift Container Platform cluster, leading to missing mandatory
ClusterRoleBindingresources and preventing components from functioning correctly.With this release, the Network Observability Operator continues to check for API availability over time and reconciliation is blocked if discovery fails. As a result, the operator correctly identifies the environment and ensures all required roles are created.
- Added missing translation fields to IPFIX exports
Before this update, some network flow fields were missing translations during the IPFIX export process. As a result, exported IPFIX data was incomplete or difficult to interpret in external collectors.
With this release, the missing translation fields (xlat) have been added to the
flowlogs-pipelineIPFIX exporter. IPFIX exports now provide a complete set of translated fields for consistent network observability.- Fixed FlowMetric form creation link and defaults
Before this update, the link to create a
FlowMetriccustom resource incorrectly directed users to a YAML editor instead of the intended form view. Additionally, the editor was pre-filled with incorrect default values.With this release, the link correctly leads to the
FlowMetricresource creation form with the expected default settings. As a result, users can now easily createFlowMetricresources through the user interface.- Virtual machine resource type icon in Topology view
Before this update, virtual machine (VM) owner types incorrectly displayed a generic question mark (?) icon in the Topology view.
With this release, the user interface now includes a specific icon for VM resources. As a result, users can more easily identify and distinguish VM traffic within the network topology.
- DNS optimization, update DNS Alerts
Before this update, many DNS "NXDOMAIN" errors were returned due to ambiguous URLs being used in network observability.
With this release, these URLs have been disambiguated, resulting in a more optimal use of DNS.
Chapter 2. Network Observability Operator release notes archive
2.1. Network Observability Operator release notes archive
These release notes track past developments of the Network Observability Operator in the OpenShift Container Platform. They are for reference purposes only.
The Network Observability Operator enables administrators to observe and analyze network traffic flows for OpenShift Container Platform clusters.
2.1.1. Network Observability Operator 1.10.1 advisory
You can review the advisory for Network Observability Operator 1.10.1 release.
2.1.2. Network Observability Operator 1.10.1 CVEs
You can review the CVEs for the Network Observability Operator 1.10.1 release.
2.1.3. Network Observability Operator 1.10.1 fixed issues
The Network Observability Operator 1.10.1 release contains several fixed issues that improve performance and the user experience.
- Warning Generated for Direct Mode on Clusters Over 15 Nodes
Before this update, the recommendation against using the
Directdeployment model on large clusters was only available in the documentation.With this release, the Network Observability Operator now generates a warning when the Direct deployment mode is used on a cluster exceeding 15 nodes.
- Network policy deployment disabled on OpenShiftSDN
Before this update, when OpenShift SDN was the cluster network plugin, enabling the
FlowCollectornetwork policy would break communication between network observability pods. This issue does not occur with OVN-Kubernetes, which is the default supported network plugin.With this release, the Network Observability Operator no longer attempts to deploy the network policy when OpenShift SDN is detected; a warning is displayed instead. Additionally, the default value for enabling the network policy is modified: it is now enabled by default only when OVN-Kubernetes is detected as the cluster network plugin.
- Validation added for subnet label characters
Before this update, there were no restrictions on characters allowed in the subnet labels "name" configuration, meaning users could enter text containing spaces or special characters. This generated errors in the web console plugin when users tried to apply filters, and clicking the filter icon for a subnet label often failed.
With this release, the configured subnet label name is validated immediately when configured in the
FlowCollectorcustom resource. The validation ensures the name contains only alphanumeric characters,:,_, and-. As a result, filtering on subnet labels from the web console plugin now works as expected.- Network Observability CLI uses unique temporary directory per run
Before this update, the Network Observability CLI created or reused a single temporary (
tmp) directory in the current working directory. This could lead to conflicts or data corruption between separate runs.With this release, the Network Observability CLI now creates a unique temporary directory for each run, preventing potential conflicts and improving file management hygiene.
2.1.4. Network Observability Operator 1.10 advisory
Review the advisory that is available for the Network Observability Operator 1.10:
2.1.5. Network Observability Operator 1.10 new features and enhancements
The Network Observability Operator 1.10 release enhances security, improves performance, and introduces new CLI UI tools for better network flow management.
2.1.5.1. Network policy updates
The Network Observability Operator now supports configuring both ingress and egress network policies to control pod traffic. This enhancement improves security.
By default, the spec.NetworkPolicy.enable specification is now set to true. This means that if you use Loki or Kafka, it is recommended that you deploy the Loki Operator and Kafka instances into dedicated namespaces. This ensures that the network policies can be configured correctly to allow communication between all components.
2.1.5.2. Network Observability Operator CLI UI updates
This release brings the following new features and updates to the Network Observability Operator CLI (oc netobserv) user interface (UI):
Table view enhancements
- Customizable columns: Click Manage Columns to select which columns to display, and tailor the table to your needs.
- Smart filtering: Live filters now include auto-suggestions, making it easier to select the right keys and values.
-
Packet preview: When capturing packets, click a row to inspect the
pcapcontent directly.
Terminal-based line charts enhancements
- Metrics visualization: Real-time graphs are rendered directly in the CLI.
- Panel selection: Choose from predefined views or customize views by using the Manage Panels pop-up menu to selectively view charts of specific metrics.
2.1.5.3. Network observability console improvements
The network observability console plugin includes a new view to configure the FlowCollector custom resource (CR). From this view, you can complete the following tasks:
-
Configure the
FlowCollectorCR. - Calculate your resource footprint.
- Gain increased of issues such as configuration warnings or high metrics cardinality.
2.1.5.4. Performance improvements
Network Observability Operator 1.10 has improved the performance and memory footprint of the Operator, especially visible on large clusters.
2.1.6. Network Observability Operator 1.10 Technology Preview features
2.1.6.1. Network Observability Operator custom alerts (Technology Preview)
This release introduces new alert functionality, and custom alert configuration. These capabilities are Technology Preview features, and must be explicitly enabled.
To view the new alerts, in the OpenShift Container Platform web console, click Observe → Alerting → Alerting rules.
2.1.6.2. Network Observability Operator Network Health dashboard (Technology Preview)
When you enable the Technology Preview alerts functionality in the Network Observability Operator, you can view a new Network Health dashboard in the OpenShift Container Platform web console by clicking Observe.
The Network Health dashboard provides a summary of triggered alerts, distinguishing between critical, warning, and minor issues, and also shows pending alerts.
2.1.7. Network Observability Operator 1.10 removed features
Review the removed features that might affect your use of the Network Observability Operator 1.10 release.
2.1.7.1. FlowCollector API version v1beta1 has been removed
The FlowCollector custom resource (CR) API version v1beta1 has been removed and is no longer supported. Use the v1beta2 version.
2.1.8. Network Observability Operator 1.10 known issues
Review the following known issues and their recommended workarounds (where available) that might affect your use of the Network Observability Operator 1.10 release.
2.1.8.1. Upgrading to 1.10 fails on OpenShift Container Platform 4.14 and earlier
Upgrading to the Network Observability Operator 1.10 on OpenShift Container Platform 4.14 and earlier can fail due to a FlowCollector custom resource definition (CRD) validation error in the software catalog.
To workaround this problem, you must:
Uninstall both versions of the Network Observability Operator from the software catalog in the OpenShift Container Platform web console.
-
Keep the
FlowCollectorCRD installed so that it doesn’t cause any disruption in the flow collection process.
-
Keep the
Check the current name of the
FlowCollectorCRD by running the following command:$ oc get crd flowcollectors.flows.netobserv.io -o jsonpath='{.spec.versions[0].name}'Expected output:
v1beta1Check the current serving status of the
FlowCollectorCRD by running the following command:$ oc get crd flowcollectors.flows.netobserv.io -o jsonpath='{.spec.versions[0].served}'Expected output:
trueSet the
servedflag for thev1beta1version tofalseby running the following command:$ oc patch crd flowcollectors.flows.netobserv.io --type='json' -p "[{'op': 'replace', 'path': '/spec/versions/0/served', 'value': false}]"Verify that the
servedflag is set tofalseby running the following command:$ oc get crd flowcollectors.flows.netobserv.io -o jsonpath='{.spec.versions[0].served}'Expected output:
false- Install Network Observability Operator 1.10.
2.1.8.2. eBPF agent compatibility with older OpenShift Container Platform versions
The eBPF agent used in the Network Observability Command Line Interface (CLI) packet capture feature is incompatible with OpenShift Container Platform versions 4.16 and older.
This limitation prevents the eBPF-based Packet Capture Agent (PCA) from functioning correctly on those older clusters.
To work around this problem, you must manually configure PCA to use an older, compatible eBPF agent container image. For more information, see the Red Hat Knowledgebase Solution eBPF agent compatibility with older Openshift versions in Network Observability CLI 1.10+.
2.1.8.3. eBPF Agent fails to send flows with OpenShiftSDN when NetworkPolicy is enabled
When running Network Observability Operator 1.10 on OpenShift Container Platform 4.14 clusters that use the OpenShiftSDN CNI plugin, the eBPF agent is unable to send flow records to the flowlogs-pipeline component. This occurs when the FlowCollector custom resource is created with NetworkPolicy enabled (spec.networkPolicy.enable: true).
As a consequence, flow data is not processed by the flowlogs-pipeline component and does not appear in the Network Traffic dashboard or the configured storage (Loki). The eBPF agent pod logs show i/o timeout errors when attempting to connect to the collector:
time="2025-10-17T13:53:44Z" level=error msg="couldn't send flow records to collector" collector="10.0.68.187:2055" component=exporter/GRPCProto error="rpc error: code = Unavailable desc = connection error: desc = \"transport: Error while dialing: dial tcp 10.0.68.187:2055: i/o timeout\""
To work around this problem, set spec.networkPolicy.enable to false to disable NetworkPolicy in the FlowCollector resource for Network Observability Operator 1.10.
This will allow the eBPF agent to communicate with the flowlogs-pipeline component without interference from the automatically deployed network policy.
2.1.9. Network Observability Operator 1.10 fixed issues
The Network Observability Operator 1.10 release contains several fixed issues that improve performance and the user experience.
2.1.9.1. MetricName and Remap fields are validated
Before this update, users could create a FlowMetric custom resource (CR) with an invalid metric name. Although the FlowMetric CR was successfully created, the underlying metric would fail silently without providing any error feedback to the user.
With this release, the FlowMetric, metricName, and remap fields are now validated before creation, so users are immediately notified if they enter an invalid name.
2.1.9.2. Improved html-to-image export performance
Before this update, performance issues in the underlying library caused the html-to-image export function to take a long time, leading to browser freezing.
With this release, the performance of the html-to-image library has been improved, reducing export wait times and eliminating browser freezing during image generation.
2.1.9.3. Improved warnings for eBPF privileged mode
Before this update, when users selected eBPF features that require privileged mode, the features would often fail without clearly informing the user that privileged mode was missing or needed to be enabled.
With this release, a validation hook immediately warns the user if the configuration is inconsistent. This improves user understanding and prevents misconfiguration.
2.1.9.4. Subnet labels added to OpenTelemetry exporter
Before this update, the OpenTelemetry metrics exporter was missing the network flow labels SrcSubnetLabel and DstSubnetLabel, causing them to show as empty.
With this release, these labels are now correctly provided by the exporter. They have also been renamed to source.subnet.label and destination.subnet.label for improved clarity and consistency with OpenTelemetry standards.
2.1.9.5. Reduced default tolerations for network observability components
Before this update, a default toleration was set on all network observability components to allow them to be scheduled on any node, including those tainted with NoSchedule. This could potentially block cluster upgrades.
With this release, the default toleration is now only maintained for the eBPF agents and the Flowlogs-Pipeline when configured in Direct mode. The toleration has been removed from the OpenShift Container Platform web console plugin and the Flowlogs-Pipeline when configured in Kafka mode.
Additionally, while tolerations were always configurable in the FlowCollector custom resource (CR), it was previously impossible to replace the tolerations with an empty list. It is now possible to replace the tolerations with an empty list.
2.1.10. Network Observability Operator 1.9.3 advisory
The following advisory is available for the Network Observability Operator 1.9.3:
2.1.11. Network Observability Operator 1.9.2 advisory
The following advisory is available for the Network Observability Operator 1.9.2:
2.1.12. Network observability 1.9.2 bug fixes
-
Before this update, OpenShift Container Platform versions 4.15 and earlier did not support the
TC_ATTACH_MODEconfiguration. This led to command-line interface (CLI) errors and prevented the observation of packets and flows. With this release, the Traffic Control eXtension (TCX) hook attachment mode has been adjusted for these older versions. This eliminatestcxhook errors and enables flow and packet observation.
2.1.13. Network Observability Operator 1.9.1 advisory
You can review the advisory for the Network Observability Operator 1.9.1 release.
The following advisory is available for the Network Observability Operator 1.9.1:
2.1.14. Network Observability Operator 1.9.1 fixed issues
You can review the fixed issues for the Network Observability Operator 1.9.1 release.
-
Before this update, network flows were not observed on OpenShift Container Platform 4.15 due to an incorrect attach mode setting. This stopped users from monitoring network flows correctly, especially with certain catalogs. With this release, the default attach mode for OpenShift Container Platform versions older than 4.16.0 is set to
tc, so flows are now observed on OpenShift Container Platform 4.15. (NETOBSERV-2333) - Before this update, if an IPFIX collector restarted, configuring an IPFIX exporter could lose its connection and stop sending network flows to the collector. With this release, the connection is restored, and network flows continue to be sent to the collector. (NETOBSERV-2315)
- Before this update, when you configured an IPFIX exporter, flows without port information (such as ICMP traffic) were ignored, which caused errors in logs. TCP flags and ICMP data were also missing from IPFIX exports. With this release, these details are now included. Missing fields (like ports) no longer cause errors and are part of the exported data. (NETOBSERV-2307)
- Before this update, the User Defined Networks (UDN) Mapping feature showed a configuration issue and warning on OpenShift Container Platform 4.18 because the OpenShift version was incorrectly set in the code. This impacted the user experience. With this release, UDN Mapping now supports OpenShift Container Platform 4.18 without warnings, making the user experience smooth. (NETOBSERV-2305)
-
Before this update, the expand function on the Network Traffic page had compatibility problems with OpenShift Container Platform Console 4.19. This resulted in empty menu space when expanding and an inconsistent user interface. With this release, the compatibility problem in the
NetflowTrafficpart andtheme hookis resolved. The side menu in the Network Traffic view is now properly managed, which improves how you interact with the user interface. (NETOBSERV-2304)
2.1.15. Network Observability Operator 1.9.0 advisory
You can review the advisory for the Network Observability Operator 1.9.0 release.
2.1.16. Network Observability Operator 1.9.0 new features and enhancements
You can review the new features and enhancements for the Network Observability Operator 1.9.0 release.
2.1.16.1. User-defined networks with network observability
With this release, user-defined networks (UDN) feature is generally available with network observability. When the UDNMapping feature is enabled in network observability, the Traffic flow table has a UDN labels column. You can filter logs on Source Network Name and Destination Network Name information.
2.1.16.2. Filter flowlogs at ingestion
With this release, you can create filters to reduce the number of generated network flows and the resource usage of network observability components. The following filters can be configured:
- eBPF Agent filters
- Flowlogs-pipeline filters
2.1.16.3. IPsec support
This update brings the following enhancements to network observability when IPsec is enabled on OpenShift Container Platform:
- A new column named IPsec Status is displayed in the network observability Traffic flows view to show whether a flow was successfully IPsec-encrypted or if there was an error during encryption/decryption.
- A new dashboard showing the percentage of encrypted traffic is generated.
2.1.16.4. Network Observability CLI
The following filtering options are now available for packets, flows, and metrics capture:
-
Configure the ratio of packets being sampled by using the
--samplingoption. -
Filter flows using a custom query by using the
--queryoption. -
Specify interfaces to monitor by using the
--interfacesoption. -
Specify interfaces to exclude by using the
--exclude_interfacesoption. -
Specify metric names to generate by using the
--include_listoption.
For more information, see:
2.1.17. Network Observability Operator release notes 1.9.0 notable technical changes
You can review the notable technical changes for the Network Observability Operator 1.6.0 release.
-
The
NetworkEventsfeature in network observability 1.9 has been updated to work with the newer Linux kernel of OpenShift Container Platform 4.19. This update breaks compatibility with older kernels. As a result, theNetworkEventsfeature can only be used with OpenShift Container Platform 4.19. If you are using this feature with network observability 1.8 and OpenShift Container Platform 4.18, consider avoiding a network observability upgrade or upgrade to network observability 1.9 and OpenShift Container Platform to 4.19. -
The
netobserv-readercluster role has been renamed tonetobserv-loki-reader. - Improved CPU performance of the eBPF agents.
2.1.18. Network Observability Operator 1.9.0 Technology Preview features
You can review the Technology Preview features for the Network Observability Operator 1.9.0 release.
Some features in this release are currently in Technology Preview. These experimental features are not intended for production use. Note the following scope of support on the Red Hat Customer Portal for these features:
Technology Preview Features Support Scope
2.1.18.1. eBPF Manager Operator with network observability
The eBPF Manager Operator reduces the attack surface and ensures compliance, security, and conflict prevention by managing all eBPF programs. Network observability can use the eBPF Manager Operator to load hooks. This eliminates the need to provide the eBPF Agent with privileged mode or additional Linux capabilities like CAP_BPF and CAP_PERFMON. The eBPF Manager Operator with network observability is only supported on 64-bit AMD architecture.
2.1.19. Network Observability Operator 1.9.0 CVEs
You can review the CVEs for the Network Observability Operator 1.9.0 release.
2.1.20. Network Observability Operator 1.9.0 fixed issues
You can review the fixed issues for the Network Observability Operator 1.9.0 release.
-
Previously, when filtering by source or destination IP from the console plugin, using a Classless Inter-Domain Routing (CIDR) notation such as
10.128.0.0/24did not work, returning results that should be filtered out. With this update, it is now possible to use a CIDR notation, with the results being filtered as expected. (NETOBSERV-2276) -
Previously, network flows might have incorrectly identified the network interfaces in use, especially with a risk of mixing up
eth0andens5. This issue only occurred when the eBPF agents were configured asPrivileged. With this update, it has been fixed partially, and almost all network interfaces are correctly identified. Refer to the known issues below for more details. (NETOBSERV-2257) - Previously, when the Operator checked for available Kubernetes APIs in order to adapt its behavior, if there was a stale API, this resulted in an error that prevented the Operator from starting normally. With this update, the Operator ignores error on unrelated APIs, logs errors on related APIs, and continues to run normally. (NETOBSERV-2240)
- Previously, users could not sort flows by Bytes or Packets in the Traffic flows view of the Console plugin. With this update, users can sort flows by Bytes and Packets. (NETOBSERV-2239)
-
Previously, when configuring the
FlowCollectorresource with an IPFIX exporter, MAC addresses in the IPFIX flows were truncated to their 2 first bytes. With this update, MAC addresses are fully represented in the IPFIX flows. (NETOBSERV-2208) - Previously, some of the warnings sent from the Operator validation webhook could lack clarity on what needed to be done. With this update, some of these messages have been reviewed and amended to make them more actionable. (NETOBSERV-2178)
-
Previously, it was not obvious to figure out there was an issue when referencing a
LokiStackfrom theFlowCollectorresource, such as in case of typing error. With this update, theFlowCollectorstatus clearly states that the referencedLokiStackis not found in that case. (NETOBSERV-2174) - Previously, in the console plugin Traffic flows view, in case of text overflow, text ellipses sometimes hid much of the text to be displayed. With this update, it displays as much text as possible. (NETOBSERV-2119)
- Previously, the console plugin for network observability 1.8.1 and earlier did not work with the OpenShift Container Platform 4.19 web console, making the Network Traffic page inaccessible. With this update, the console plugin is compatible and the Network Traffic page is accessible in network observability 1.9.0. (NETOBSERV-2046)
-
Previously, when using conversation tracking (
logTypes: ConversationsorlogTypes: Allin theFlowCollectorresource), the Traffic rates metrics visible in the dashboards were flawed, wrongly showing an out-of-control increase in traffic. Now, the metrics show more accurate traffic rates. However, note that inConversationsandEndedConversationsmodes, these metrics are still not completely accurate as they do not include long-standing connections. This information has been added to the documentation. The default modelogTypes: Flowsis recommended to avoid these inaccuracy. (NETOBSERV-1955)
2.1.21. Network Observability Operator 1.9.0 known issues
You can review the known issues for the Network Observability Operator 1.9.0 release.
- The user-defined network (UDN) feature displays a configuration issue and a warning when used with OpenShift Container Platform 4.18, even though it is supported. This warning can be ignored. (NETOBSERV-2305)
-
In some rare cases, the eBPF agent is unable to appropriately correlate flows with the involved interfaces when running in
privilegedmodes with several network namespaces. A large part of these issues have been identified and resolved in this release, but some inconsistencies remain, especially with theens5interface. (NETOBSERV-2287)
2.1.22. Network Observability Operator 1.8.1 advisory
You can review the advisory for the Network Observability Operator 1.8.1 release.
2.1.23. Network Observability Operator 1.8.1 CVEs
You can review the CVEs for the Network Observability Operator 1.8.1 release.
2.1.24. Network Observability Operator 1.8.1 fixed issues
You can review the fixed issues for the Network Observability Operator 1.8.1 release.
- This fix ensures that the Observe menu appears only once in future versions of OpenShift Container Platform. (NETOBSERV-2139)
2.1.25. Network Observability Operator 1.8.0 advisory
You can review the advisory for the Network Observability Operator 1.8.0 release.
2.1.26. Network Observability Operator 1.8.0 new features and enhancements
You can review the new features and enhancements for the Network Observability Operator 1.8.0 release.
2.1.26.1. Packet translation
You can now enrich network flows with translated endpoint information, showing not only the service but also the specific backend pod, so you can see which pod served a request.
For more information, see:
2.1.26.2. eBPF performance improvements in 1.8
- Network observability now uses hash maps instead of per-CPU maps. This means that network flows data is now tracked in the kernel space and new packets are also aggregated there. The de-duplication of network flows can now occur in the kernel, so the size of data transfer between the kernel and the user spaces yields better performance. With these eBPF performance improvements, there is potential to observe a CPU resource reduction between 40% and 57% in the eBPF Agent.
2.1.26.3. Network Observability CLI
The following new features, options, and filters are added to the Network Observability CLI for this release:
-
Capture metrics with filters enabled by running the
oc netobserv metricscommand. -
Run the CLI in the background by using the
--backgroundoption with flows and packets capture and runningoc netobserv followto see the progress of the background run andoc netobserv copyto download the generated logs. -
Enrich flows and metrics capture with Machines, Pods, and Services subnets by using the
--get-subnetsoption. New filtering options available with packets, flows, and metrics capture:
- eBPF filters on IPs, Ports, Protocol, Action, TCP Flags and more
-
Custom nodes using
--node-selector -
Drops only using
--drops -
Any field using
--regexes
For more information, see Network Observability CLI reference.
2.1.27. Network Observability Operator release notes 1.8.0 fixed issues
You can review the fixed issues for the Network Observability Operator 1.8.0 release.
- Previously, the Network Observability Operator came with a "kube-rbac-proxy" container to manage RBAC for its metrics server. Since this external component is deprecated, it was necessary to remove it. It is now replaced with direct TLS and RBAC management through Kubernetes controller-runtime, without the need for a side-car proxy. (NETOBSERV-1999)
- Previously in the OpenShift Container Platform console plugin, filtering on a key that was not equal to multiple values would not filter anything. With this fix, the expected results are returned, which is all flows not having any of the filtered values. (NETOBSERV-1990)
- Previously in the OpenShift Container Platform console plugin with disabled Loki, it was very likely to generate a "Can’t build query" error due to selecting an incompatible set of filters and aggregations. Now this error is avoided avoid by automatically disabling incompatible filters while still making the user aware of the filter incompatibility. (NETOBSERV-1977)
- Previously, when viewing flow details from the console plugin, the ICMP info was always displayed in the side panel, showing "undefined" values for non-ICMP flows. With this fix, ICMP info is not displayed for non-ICMP flows. (NETOBSERV-1969)
- Previously, the "Export data" link from the Traffic flows view did not work as intended, generating empty CSV reports. Now, the export feature is restored, generating non-empty CSV data. (NETOBSERV-1958)
-
Previously, it was possible to configure the
FlowCollectorwithprocessor.logTypesConversations,EndedConversationsorAllwithloki.enableset tofalse, despite the conversation logs being only useful when Loki is enabled. This resulted in resource usage waste. Now, this configuration is invalid and is rejected by the validation webhook. (NETOBSERV-1957) -
Configuring the
FlowCollectorwithprocessor.logTypesset toAllconsumes much more resources, such as CPU, memory and network bandwidth, than the other options. This was previously not documented. It is now documented, and triggers a warning from the validation webhook. (NETOBSERV-1956) - Previously, under high stress, some flows generated by the eBPF agent were mistakenly dismissed, resulting in traffic bandwidth under-estimation. Now, those generated flows are not dismissed. (NETOBSERV-1954)
-
Previously, when enabling the network policy in the
FlowCollectorconfiguration, the traffic to the Operator webhooks was blocked, breaking theFlowMetricsAPI validation. Now traffic to the webhooks is allowed. (NETOBSERV-1934) -
Previously, when deploying the default network policy, namespaces
openshift-consoleandopenshift-monitoringwere set by default in theadditionalNamespacesfield, resulting in duplicated rules. Now there is no additional namespace set by default, which helps avoid getting duplicated rules.(NETOBSERV-1933) - Previously from the OpenShift Container Platform console plugin, filtering on TCP flags would match flows having only the exact desired flag. Now, any flow having at least the desired flag appears in filtered flows. (NETOBSERV-1890)
- When the eBPF agent runs in privileged mode and pods are continuously added or deleted, a file descriptor (FD) leak occurs. The fix ensures proper closure of the FD when a network namespace is deleted. (NETOBSERV-2063)
-
Previously, the CLI agent
DaemonSetdid not deploy on master nodes. Now, a toleration is added on the agentDaemonSetto schedule on every node when taints are set. Now, CLI agentDaemonSetpods run on all nodes. (NETOBSERV-2030) - Previously, the Source Resource and Source Destination filters autocomplete were not working when using Prometheus storage only. Now this issue is fixed and suggestions displays as expected. (NETOBSERV-1885)
- Previously, a resource using multiple IPs was displayed separately in the Topology view. Now, the resource shows as a single topology node in the view. (NETOBSERV-1818)
- Previously, the console refreshed the Network traffic table view contents when the mouse pointer hovered over the columns. Now, the display is fixed, so row height remains constant with a mouse hover. (NETOBSERV-2049)
2.1.28. Network Observability Operator release notes 1.8.0 known issues
You can review the known issues for the Network Observability Operator 1.8.0 release.
- If there is traffic that uses overlapping subnets in your cluster, there is a small risk that the eBPF Agent mixes up the flows from overlapped IPs. This can happen if different connections happen to have the exact same source and destination IPs and if ports and protocol are within a 5 seconds time frame and happening on the same node. This should not be possible unless you configured secondary networks or UDN. Even in that case, it is still very unlikely in usual traffic, as source ports are usually a good differentiator. (NETOBSERV-2115)
-
After selecting a type of exporter to configure in the
FlowCollectorresourcespec.exporterssection from the OpenShift Container Platform web console form view, the detailed configuration for that type does not show up in the form. The workaround is to configure directly the YAML. (NETOBSERV-1981)
2.1.29. Network Observability Operator 1.7.0 advisory
You can review the advisory for the Network Observability Operator 1.7.0 release.
2.1.30. Network Observability Operator 1.7.0 new features and enhancements
You can review the following new features and enhancements for the Network Observability Operator 1.7.0 release.
2.1.30.1. OpenTelemetry support
You can now export enriched network flows to a compatible OpenTelemetry endpoint, such as the Red Hat build of OpenTelemetry.
For more information, see:
2.1.30.2. Network observability Developer perspective
You can now use network observability in the Developer perspective.
For more information, see:
2.1.30.3. TCP flags filtering
You can now use the tcpFlags filter to limit the volume of packets processed by the eBPF program.
For more information, see:
2.1.30.4. Network observability for OpenShift Virtualization
You can observe networking patterns on an OpenShift Virtualization setup by identifying eBPF-enriched network flows coming from VMs that are connected to secondary networks, such as through Open Virtual Network (OVN)-Kubernetes.
For more information, see:
2.1.30.5. Network policy deploys in the FlowCollector custom resource (CR)
With this release, you can configure the FlowCollector custom resource (CR) to deploy a network policy for network observability. Previously, if you wanted a network policy, you had to manually create one. The option to manually create a network policy is still available.
For more information, see:
2.1.30.6. FIPS compliance
You can install and use the Network Observability Operator in an OpenShift Container Platform cluster running in FIPS mode.
ImportantTo enable FIPS mode for your cluster, you must run the installation program from a Red Hat Enterprise Linux (RHEL) computer configured to operate in FIPS mode. For more information about configuring FIPS mode on RHEL, see Switching RHEL to FIPS mode.
When running Red Hat Enterprise Linux (RHEL) or Red Hat Enterprise Linux CoreOS (RHCOS) booted in FIPS mode, OpenShift Container Platform core components use the RHEL cryptographic libraries that have been submitted to NIST for FIPS 140-2/140-3 Validation on only the x86_64, ppc64le, and s390x architectures.
If you are using Azure File storage, you cannot enable FIPS mode.
2.1.30.7. eBPF agent enhancements
The following enhancements are available for the eBPF agent:
-
If the DNS service maps to a different port than
53, you can specify this DNS tracking port usingspec.agent.ebpf.advanced.env.DNS_TRACKING_PORT. - You can now use two ports for transport protocols (TCP, UDP, or SCTP) filtering rules.
- You can now filter on transport ports with a wildcard protocol by leaving the protocol field empty.
For more information, see:
2.1.30.8. Network Observability CLI
The Network Observability CLI (oc netobserv), is now generally available. The following enhancements have been made since the 1.6 Technology Preview release:
- There are now eBPF enrichment filters for packet capture similar to flow capture.
-
You can now use filter
tcp_flagswith both flow and packets capture. - The auto-teardown option is available when max-bytes or max-time is reached.
For more information, see:
2.1.31. Network Observability Operator 1.7.0 fixed issues
You can review the following fixed issues for the Network Observability Operator 1.7.0 release.
-
Previously, when using a RHEL 9.2 real-time kernel, some of the webhooks did not work. Now, a fix is in place to check whether this RHEL 9.2 real-time kernel is being used. If the kernel is being used, a warning is displayed about the features that do not work, such as packet drop and neither Round-trip Time when using
s390xarchitecture. The fix is in OpenShift 4.16 and later. (NETOBSERV-1808) - Previously, in the Manage panels dialog in the Overview tab, filtering on total, bar, donut, or line did not show a result. Now the available panels are correctly filtered. (NETOBSERV-1540)
-
Previously, under high stress, the eBPF agents were susceptible to enter into a state where they generated a high number of small flows, almost not aggregated. With this fix, the aggregation process is still maintained under high stress, resulting in less flows being created. This fix improves the resource consumption not only in the eBPF agent but also in
flowlogs-pipelineand Loki. (NETOBSERV-1564) -
Previously, when the
workload_flows_totalmetric was enabled instead of thenamespace_flows_totalmetric, the health dashboard stopped showingBy namespaceflow charts. With this fix, the health dashboard now shows the flow charts when theworkload_flows_totalis enabled. (NETOBSERV-1746) -
Previously, when you used the
FlowMetricsAPI to generate a custom metric and later modified its labels, such as by adding a new label, the metric stopped populating and an error was shown in theflowlogs-pipelinelogs. With this fix, you can modify the labels, and the error is no longer raised in theflowlogs-pipelinelogs. (NETOBSERV-1748) -
Previously, there was an inconsistency with the default Loki
WriteBatchSizeconfiguration: it was set to 100 KB in theFlowCollectorCRD default, and 10 MB in the OLM sample or default configuration. Both are now aligned to 10 MB, which generally provides better performances and less resource footprint. (NETOBSERV-1766) - Previously, the eBPF flow filter on ports was ignored if you did not specify a protocol. With this fix, you can set eBPF flow filters independently on ports and or protocols. (NETOBSERV-1779)
- Previously, traffic from Pods to Services was hidden from the Topology view. Only the return traffic from Services to Pods was visible. With this fix, that traffic is correctly displayed. (NETOBSERV-1788)
- Previously, non-cluster administrator users that had access to Network Observability saw an error in the console plugin when they tried to filter for something that triggered auto-completion, such as a namespace. With this fix, no error is displayed, and the auto-completion returns the expected results. (NETOBSERV-1798)
- When the secondary interface support was added, you had to iterate multiple times to register the per network namespace with the netlink to learn about interface notifications. At the same time, unsuccessful handlers caused a leaking file descriptor because with TCX hook, unlike TC, handlers needed to be explicitly removed when the interface went down. Furthermore, when the network namespace was deleted, there was no Go close channel event to terminate the netlink goroutine socket, which caused go threads to leak. Now, there are no longer leaking file descriptors or go threads when you create or delete pods. (NETOBSERV-1805)
- Previously, the ICMP type and value were displaying 'n/a' in the Traffic flows table even when related data was available in the flow JSON. With this fix, ICMP columns display related values as expected in the flow table. (NETOBSERV-1806)
- Previously in the console plugin, it wasn’t always possible to filter for unset fields, such as unset DNS latency. With this fix, filtering on unset fields is now possible. (NETOBSERV-1816)
- Previously, when you cleared filters in the OpenShift web console plugin, sometimes the filters reappeared after you navigated to another page and returned to the page with filters. With this fix, filters do not unexpectedly reappear after they are cleared. (NETOBSERV-1733)
2.1.32. Network Observability Operator 1.7.0 known issues
You can review the following known issues for the Network Observability Operator 1.7.0 release.
- When you use the must-gather tool with network observability, logs are not collected when the cluster has FIPS enabled. (NETOBSERV-1830)
When the
spec.networkPolicyis enabled in theFlowCollector, which installs a network policy on thenetobservnamespace, it is impossible to use theFlowMetricsAPI. The network policy blocks calls to the validation webhook. As a workaround, use the following network policy:kind: NetworkPolicy apiVersion: networking.k8s.io/v1 metadata: name: allow-from-hostnetwork namespace: netobserv spec: podSelector: matchLabels: app: netobserv-operator ingress: - from: - namespaceSelector: matchLabels: policy-group.network.openshift.io/host-network: '' policyTypes: - Ingress
2.1.33. Network Observability Operator release notes 1.6.2 advisory
You can review the advisory for the Network Observability Operator 1.6.2 release.
2.1.34. Network Observability Operator release notes 1.6.2 CVEs
You can review the CVEs for the Network Observability Operator 1.6.2 release.
2.1.35. Network Observability Operator release notes 1.6.2 fixed issues
You can review the fixed issues for the Network Observability Operator 1.6.2 release.
- When the secondary interface support was added, there was a need to iterate multiple times to register the per network namespace with the netlink to learn about interface notifications. At the same time, unsuccessful handlers caused a leaking file descriptor because with TCX hook, unlike TC, handlers needed to be explicitly removed when the interface went down. Now, there are no longer leaking file descriptors when creating and deleting pods. (NETOBSERV-1805)
2.1.36. Network Observability Operator release notes 1.6.2 known issues
You can review the known issues for the Network Observability Operator 1.6.2 release.
- There was a compatibility issue with console plugins that would have prevented network observability from being installed on future versions of an OpenShift Container Platform cluster. By upgrading to 1.6.2, the compatibility issue is resolved and network observability can be installed as expected. (NETOBSERV-1737)
2.1.37. Network Observability Operator release notes 1.6.1 advisory
You can review the advisory for the Network Observability Operator 1.6.1 release.
2.1.38. Network Observability Operator release notes 1.6.1 CVEs
You can review the CVEs for the Network Observability Operator 1.6.1 release.
2.1.39. Network Observability Operator release notes 1.6.1 fixed issues
You can review the fixed issues for the Network Observability Operator 1.6.1 release.
- Previously, information about packet drops, such as the cause and TCP state, was only available in the Loki datastore and not in Prometheus. For that reason, the drop statistics in the OpenShift web console plugin Overview was only available with Loki. With this fix, information about packet drops is also added to metrics, so you can view drops statistics when Loki is disabled. (NETOBSERV-1649)
-
When the eBPF agent
PacketDropfeature was enabled, and sampling was configured to a value greater than1, reported dropped bytes and dropped packets ignored the sampling configuration. While this was done on purpose, so as not to miss any drops, a side effect was that the reported proportion of drops compared with non-drops became biased. For example, at a very high sampling rate, such as1:1000, it was likely that almost all the traffic appears to be dropped when observed from the console plugin. With this fix, the sampling configuration is honored with dropped bytes and packets. (NETOBSERV-1676) - Previously, the SR-IOV secondary interface was not detected if the interface was created first and then the eBPF agent was deployed. It was only detected if the agent was deployed first and then the SR-IOV interface was created. With this fix, the SR-IOV secondary interface is detected no matter the sequence of the deployments. (NETOBSERV-1697)
- Previously, when Loki was disabled, the Topology view in the OpenShift web console displayed the Cluster and Zone aggregation options in the slider beside the network topology diagram, even when the related features were not enabled. With this fix, the slider now only displays options according to the enabled features. (NETOBSERV-1705)
-
Previously, when Loki was disabled, and the OpenShift web console was first loading, an error would occur:
Request failed with status code 400 Loki is disabled. With this fix, the errors no longer occur. (NETOBSERV-1706) - Previously, in the Topology view of the OpenShift web console, when clicking on the Step into icon next to any graph node, the filters were not applied as required in order to set the focus to the selected graph node, resulting in showing a wide view of the Topology view in the OpenShift web console. With this fix, the filters are correctly set, effectively narrowing down the Topology. As part of this change, clicking the Step into icon on a Node now brings you to the Resource scope instead of the Namespaces scope. (NETOBSERV-1720)
- Previously, when Loki was disabled, in the Topology view of the OpenShift web console with the Scope set to Owner, clicking on the Step into icon next to any graph node would bring the Scope to Resource, which is not available without Loki, so an error message was shown. With this fix, the Step into icon is hidden in the Owner scope when Loki is disabled, so this scenario no longer occurs. (NETOBSERV-1721)
- Previously, when Loki was disabled, an error was displayed in the Topology view of the OpenShift web console when a group was set, but then the scope was changed so that the group becomes invalid. With this fix, the invalid group is removed, preventing the error. (NETOBSERV-1722)
-
When creating a
FlowCollectorresource from the OpenShift web console Form view, as opposed to the YAML view, the following settings were incorrectly managed by the web console:agent.ebpf.metrics.enableandprocessor.subnetLabels.openShiftAutoDetect. These settings can only be disabled in the YAML view, not in the Form view. To avoid any confusion, these settings have been removed from the Form view. They are still accessible in the YAML view. (NETOBSERV-1731) - Previously, the eBPF agent was unable to clean up traffic control flows installed before an ungraceful crash, for example a crash due to a SIGTERM signal. This led to the creation of multiple traffic control flow filters with the same name, since the older ones were not removed. With this fix, all previously installed traffic control flows are cleaned up when the agent starts, before installing new ones. (NETOBSERV-1732)
- Previously, when configuring custom subnet labels and keeping the OpenShift subnets auto-detection enabled, OpenShift subnets would take precedence over the custom ones, preventing the definition of custom labels for in cluster subnets. With this fix, custom defined subnets take precedence, allowing the definition of custom labels for in cluster subnets. (NETOBSERV-1734)
2.1.40. Network Observability Operator release notes 1.6.0 advisory
You can review the advisory for the Network Observability Operator 1.6.0 release.
2.1.41. Network Observability Operator 1.6.0 new features and enhancements
You can review the following new features and enhancements for the Network Observability Operator 1.6.0.
2.1.41.1. Enhanced use of Network Observability Operator without Loki
You can now use Prometheus metrics and rely less on Loki for storage when using the Network Observability Operator.
For more information, see:
2.1.41.2. Custom metrics API
You can create custom metrics out of flowlogs data by using the FlowMetrics API. Flowlogs data can be used with Prometheus labels to customize cluster information on your dashboards. You can add custom labels for any subnet that you want to identify in your flows and metrics. This enhancement can also be used to more easily identify external traffic by using the new labels SrcSubnetLabel and DstSubnetLabel, which exists both in flow logs and in metrics. Those fields are empty when there is external traffic, which gives a way to identify it.
For more information, see:
2.1.41.3. eBPF performance enhancements
Experience improved performances of the eBPF agent, in terms of CPU and memory, with the following updates:
- The eBPF agent now uses TCX webhooks instead of TC.
The NetObserv / Health dashboard has a new section that shows eBPF metrics.
- Based on the new eBPF metrics, an alert notifies you when the eBPF agent is dropping flows.
- Loki storage demand decreases significantly now that duplicated flows are removed. Instead of having multiple, individual duplicated flows per network interface, there is one de-duplicated flow with a list of related network interfaces.
With the duplicated flows update, the Interface and Interface Direction fields in the Network Traffic table are renamed to Interfaces and Interface Directions, so any bookmarked Quick filter queries using these fields need to be updated to interfaces and ifdirections.
For more information, see:
2.1.41.4. eBPF collection rule-based filtering
You can use rule-based filtering to reduce the volume of created flows. When this option is enabled, the Netobserv / Health dashboard for eBPF agent statistics has the Filtered flows rate view.
For more information, see:
2.1.42. Network Observability Operator 1.6.0 fixed issues
You can review the following fixed issues for the Network Observability Operator 1.6.0.
-
Previously, a dead link to the OpenShift Container Platform documentation was displayed in the Operator Lifecycle Manager (OLM) form for the
FlowMetricsAPI creation. Now the link has been updated to point to a valid page. (NETOBSERV-1607) - Previously, the Network Observability Operator description in the Operator Hub displayed a broken link to the documentation. With this fix, this link is restored. (NETOBSERV-1544)
-
Previously, if Loki was disabled and the Loki
Modewas set toLokiStack, or if Loki manual TLS configuration was configured, the Network Observability Operator still tried to read the Loki CA certificates. With this fix, when Loki is disabled, the Loki certificates are not read, even if there are settings in the Loki configuration. (NETOBSERV-1647) -
Previously, the
ocmust-gatherplugin for the Network Observability Operator was only working on theamd64architecture and failing on all others because the plugin was usingamd64for theocbinary. Now, the Network Observability Operatorocmust-gatherplugin collects logs on any architecture platform. -
Previously, when filtering on IP addresses using
not equal to, the Network Observability Operator would return a request error. Now, the IP filtering works in bothequalandnot equal tocases for IP addresses and ranges. (NETOBSERV-1630) -
Previously, when a user was not an admin, the error messages were not consistent with the selected tab of the Network Traffic view in the web console. Now, the
user not adminerror displays on any tab with improved display.(NETOBSERV-1621)
2.1.43. Network Observability Operator 1.6.0 known issues
You can review the following known issues for the Network Observability Operator 1.6.0.
-
When the eBPF agent
PacketDropfeature is enabled, and sampling is configured to a value greater than1, reported dropped bytes and dropped packets ignore the sampling configuration. While this is done on purpose to not miss any drops, a side effect is that the reported proportion of drops compared to non-drops becomes biased. For example, at a very high sampling rate, such as1:1000, it is likely that almost all the traffic appears to be dropped when observed from the console plugin. (NETOBSERV-1676) - In the Manage panels window in the Overview tab, filtering on total, bar, donut, or line does not show any result. (NETOBSERV-1540)
- The SR-IOV secondary interface is not detected if the interface was created first and then the eBPF agent was deployed. It is only detected if the agent was deployed first and then the SR-IOV interface is created. (NETOBSERV-1697)
- When Loki is disabled, the Topology view in the OpenShift web console always shows the Cluster and Zone aggregation options in the slider beside the network topology diagram, even when the related features are not enabled. There is no specific workaround, besides ignoring these slider options. (NETOBSERV-1705)
-
When Loki is disabled, and the OpenShift web console first loads, it might display an error:
Request failed with status code 400 Loki is disabled. As a workaround, you can continue switching content on the Network Traffic page, such as clicking between the Topology and the Overview tabs. The error should disappear. (NETOBSERV-1706)
2.1.44. Network Observability Operator 1.5.0 advisory
You can view the following advisory for the Network Observability Operator 1.5 release.
2.1.45. Network Observability Operator 1.5.0 new features and enhancements
You can view the following new features and enhancements for the Network Observability Operator 1.5 release.
2.1.45.1. DNS tracking enhancements
In 1.5, the TCP protocol is now supported in addition to UDP. New dashboards are also added to the Overview view of the Network Traffic page.
For more information, see:
2.1.45.2. Round-trip time (RTT)
You can use TCP handshake Round-Trip Time (RTT) captured from the fentry/tcp_rcv_established Extended Berkeley Packet Filter (eBPF) hookpoint to read smoothed round-trip time (SRTT) and analyze network flows. In the Overview, Network Traffic, and Topology pages in web console, you can monitor network traffic and troubleshoot with RTT metrics, filtering, and edge labeling.
For more information, see:
2.1.45.3. Metrics, dashboards, and alerts enhancements
The network observability metrics dashboards in Observe → Dashboards → NetObserv have new metrics types you can use to create Prometheus alerts. You can now define available metrics in the includeList specification. In previous releases, these metrics were defined in the ignoreTags specification.
For a complete list of these metrics, see:
2.1.45.4. Improvements for network observability without Loki
You can create Prometheus alerts for the Netobserv dashboard using DNS, Packet drop, and RTT metrics, even if you don’t use Loki. In the previous version of network observability, 1.4, these metrics were only available for querying and analysis in the Network Traffic, Overview, and Topology views, which are not available without Loki.
For more information, see:
2.1.45.5. Availability zones
You can configure the FlowCollector resource to collect information about the cluster availability zones. This configuration enriches the network flow data with the topology.kubernetes.io/zone label value applied to the nodes.
For more information, see:
2.1.45.6. Notable enhancements
The 1.5 release of the Network Observability Operator adds improvements and new capabilities to the OpenShift Container Platform web console plugin and the Operator configuration.
2.1.45.7. Performance enhancements
The
spec.agent.ebpf.kafkaBatchSizedefault is changed from10MBto1MBto enhance eBPF performance when using Kafka.ImportantWhen upgrading from an existing installation, this new value is not set automatically in the configuration. If you monitor a performance regression with the eBPF Agent memory consumption after upgrading, you might consider reducing the
kafkaBatchSizeto the new value.
2.1.45.8. Web console enhancements:
- There are new panels added to the Overview view for DNS and RTT: Min, Max, P90, P99.
There are new panel display options added:
- Focus on one panel while keeping others viewable but with smaller focus.
- Switch graph type.
- Show Top and Overall.
- A collection latency warning is shown in the Custom time range window.
- There is enhanced visibility for the contents of the Manage panels and Manage columns pop-up windows.
- The Differentiated Services Code Point (DSCP) field for egress QoS is available for filtering QoS DSCP in the web console Network Traffic page.
2.1.45.9. Configuration enhancements:
-
The
LokiStackmode in thespec.loki.modespecification simplifies installation by automatically setting URLs, TLS, cluster roles and a cluster role binding, as well as theauthTokenvalue. TheManualmode allows more control over configuration of these settings. -
The API version changes from
flows.netobserv.io/v1beta1toflows.netobserv.io/v1beta2.
2.1.46. Network Observability Operator 1.5.0 fixed issues
You can view the following fixed issues for the Network Observability Operator 1.5 release.
-
Previously, it was not possible to register the console plugin manually in the web console interface if the automatic registration of the console plugin was disabled. If the
spec.console.registervalue was set tofalsein theFlowCollectorresource, the Operator would override and erase the plugin registration. With this fix, setting thespec.console.registervalue tofalsedoes not impact the console plugin registration or registration removal. As a result, the plugin can be safely registered manually. (NETOBSERV-1134) -
Previously, using the default metrics settings, the NetObserv/Health dashboard was showing an empty graph named Flows Overhead. This metric was only available by removing "namespaces-flows" and "namespaces" from the
ignoreTagslist. With this fix, this metric is visible when you use the default metrics setting. (NETOBSERV-1351) - Previously, the node on which the eBPF Agent was running would not resolve with a specific cluster configuration. This resulted in cascading consequences that culminated in a failure to provide some of the traffic metrics. With this fix, the eBPF agent’s node IP is safely provided by the Operator, inferred from the pod status. Now, the missing metrics are restored. (NETOBSERV-1430)
- Previously, the Loki error 'Input size too long' error for the Loki Operator did not include additional information to troubleshoot the problem. With this fix, help is directly displayed in the web console next to the error with a direct link for more guidance. (NETOBSERV-1464)
-
Previously, the console plugin read timeout was forced to 30s. With the
FlowCollectorv1beta2API update, you can configure thespec.loki.readTimeoutspecification to update this value according to the Loki OperatorqueryTimeoutlimit. (NETOBSERV-1443) -
Previously, the Operator bundle did not display some of the supported features by CSV annotations as expected, such as
features.operators.openshift.io/…With this fix, these annotations are set in the CSV as expected. (NETOBSERV-1305) -
Previously, the
FlowCollectorstatus sometimes oscillated betweenDeploymentInProgressandReadystates during reconciliation. With this fix, the status only becomesReadywhen all of the underlying components are fully ready. (NETOBSERV-1293)
2.1.47. Network Observability Operator 1.5.0 known issues
You can view the following known issues for the Network Observability Operator 1.5 release.
-
When trying to access the web console, cache issues on OCP 4.14.10 prevent access to the Observe view. The web console shows the error message:
Failed to get a valid plugin manifest from /api/plugins/monitoring-plugin/. The recommended workaround is to update the cluster to the latest minor version. If this does not work, you need to apply the workarounds described in this Red Hat Knowledgebase article.(NETOBSERV-1493) -
Since the 1.3.0 release of the Network Observability Operator, installing the Operator causes a warning kernel taint to appear. The reason for this error is that the network observability eBPF agent has memory constraints that prevent preallocating the entire hashmap table. The Operator eBPF agent sets the
BPF_F_NO_PREALLOCflag so that pre-allocation is disabled when the hashmap is too memory expansive.
2.1.48. Network Observability Operator 1.4.2 advisory
The following advisory is available for the Network Observability Operator 1.4.2:
2.1.49. Network Observability Operator 1.4.2 CVEs
You can review the following CVEs in the Network Observability Operator 1.4.2 release.
2.1.50. Network Observability Operator 1.4.1 advisory
You can review the following advisory for the Network Observability Operator 1.4.1.
2.1.51. Network Observability Operator release 1.4.1 CVEs
You can review the following CVEs in the Network Observability Operator 1.4.1 release.
2.1.52. Network Observability Operator release notes 1.4.1 fixed issues
You can review the following fixed issues in the Network Observability Operator 1.4.1 release.
- In 1.4, there was a known issue when sending network flow data to Kafka. The Kafka message key was ignored, causing an error with connection tracking. Now the key is used for partitioning, so each flow from the same connection is sent to the same processor. (NETOBSERV-926)
-
In 1.4, the
Innerflow direction was introduced to account for flows between pods running on the same node. Flows with theInnerdirection were not taken into account in the generated Prometheus metrics derived from flows, resulting in under-evaluated bytes and packets rates. Now, derived metrics are including flows with theInnerdirection, providing correct bytes and packets rates. (NETOBSERV-1344)
2.1.53. Network observability release notes 1.4.0 advisory
You can review the following advisory for the Network Observability Operator 1.4.0 release.
2.1.54. Network observability release notes 1.4.0 new features and enhancements
You can review the following new features and enhancements in the Network Observability Operator 1.4.0 release.
2.1.54.1. Notable enhancements
The 1.4 release of the Network Observability Operator adds improvements and new capabilities to the OpenShift Container Platform web console plugin and the Operator configuration.
2.1.54.2. Web console enhancements:
- In the Query Options, the Duplicate flows checkbox is added to choose whether or not to show duplicated flows.
-
You can now filter source and destination traffic with
 One-way,
 Back-and-forth, and Swap filters.
The network observability metrics dashboards in Observe → Dashboards → NetObserv and NetObserv / Health are modified as follows:
- The NetObserv dashboard shows top bytes, packets sent, packets received per nodes, namespaces, and workloads. Flow graphs are removed from this dashboard.
- The NetObserv / Health dashboard shows flows overhead as well as top flow rates per nodes, namespaces, and workloads.
- Infrastructure and Application metrics are shown in a split-view for namespaces and workloads.
For more information, see:
2.1.54.3. Configuration enhancements:
- You now have the option to specify different namespaces for any configured ConfigMap or Secret reference, such as in certificates configuration.
-
The
spec.processor.clusterNameparameter is added so that the name of the cluster appears in the flows data. This is useful in a multi-cluster context. When using OpenShift Container Platform, leave empty to make it automatically determined.
For more information, see:
2.1.54.4. Network observability without Loki
The Network Observability Operator is now functional and usable without Loki. If Loki is not installed, it can only export flows to KAFKA or IPFIX format and provide metrics in the network observability metrics dashboards.
For more information, see:
2.1.54.5. DNS tracking
In 1.4, the Network Observability Operator makes use of eBPF tracepoint hooks to enable DNS tracking. You can monitor your network, conduct security analysis, and troubleshoot DNS issues in the Network Traffic and Overview pages in the web console.
For more information, see:
2.1.54.6. SR-IOV support
You can now collect traffic from a cluster with Single Root I/O Virtualization (SR-IOV) device.
For more information, see:
2.1.54.7. IPFIX exporter support
You can now export eBPF-enriched network flows to the IPFIX collector.
For more information, see:
2.1.54.8. Packet drops
In the 1.4 release of the Network Observability Operator, eBPF tracepoint hooks are used to enable packet drop tracking. You can now detect and analyze the cause for packet drops and make decisions to optimize network performance. In OpenShift Container Platform 4.14 and later, both host drops and OVS drops are detected. In OpenShift Container Platform 4.13, only host drops are detected.
For more information, see:
2.1.54.9. s390x architecture support
Network Observability Operator can now run on s390x architecture. Previously it ran on amd64, ppc64le, or arm64.
2.1.55. Network observability release notes 1.4.0 removed features
You can review the following removed features from the Network Observability Operator 1.4.0 release.
2.1.55.1. Channel removal
You must switch your channel from v1.0.x to stable to receive the latest Operator updates. The v1.0.x channel is now removed.
2.1.56. Network observability release notes 1.4.0 fixed issues
You can review the following fixed issues in the Network Observability Operator 1.4.0 release.
- Previously, the Prometheus metrics exported by network observability were computed out of potentially duplicated network flows. In the related dashboards, from Observe → Dashboards, this could result in potentially doubled rates. Note that dashboards from the Network Traffic view were not affected. Now, network flows are filtered to eliminate duplicates before metrics calculation, which results in correct traffic rates displayed in the dashboards. (NETOBSERV-1131)
-
Previously, the Network Observability Operator agents were not able to capture traffic on network interfaces when configured with Multus or SR-IOV, non-default network namespaces. Now, all available network namespaces are recognized and used for capturing flows, allowing capturing traffic for SR-IOV. There are configurations needed for the
FlowCollectorandSRIOVnetworkcustom resource to collect traffic. (NETOBSERV-1283)
-
Previously, in the Network Observability Operator details from Operators → Installed Operators, the
FlowCollectorStatus field might have reported incorrect information about the state of the deployment. The status field now shows the proper conditions with improved messages. The history of events is kept, ordered by event date. (NETOBSERV-1224) -
Previously, during spikes of network traffic load, certain eBPF pods were OOM-killed and went into a
CrashLoopBackOffstate. Now, theeBPFagent memory footprint is improved, so pods are not OOM-killed and entering aCrashLoopBackOffstate. (NETOBSERV-975) -
Previously when
processor.metrics.tlswas set toPROVIDEDtheinsecureSkipVerifyoption value was forced to betrue. Now you can setinsecureSkipVerifytotrueorfalse, and provide a CA certificate if needed. (NETOBSERV-1087)
2.1.57. Network observability release notes 1.4.0 known issues
You can review the following known issues in the Network Observability Operator 1.4.0 release.
-
Since the 1.2.0 release of the Network Observability Operator, using Loki Operator 5.6, a Loki certificate change periodically affects the
flowlogs-pipelinepods and results in dropped flows rather than flows written to Loki. The problem self-corrects after some time, but it still causes temporary flow data loss during the Loki certificate change. This issue has only been observed in large-scale environments of 120 nodes or greater. (NETOBSERV-980) -
Currently, when
spec.agent.ebpf.featuresincludes DNSTracking, larger DNS packets require theeBPFagent to look for DNS header outside of the 1st socket buffer (SKB) segment. A neweBPFagent helper function needs to be implemented to support it. Currently, there is no workaround for this issue. (NETOBSERV-1304) -
Currently, when
spec.agent.ebpf.featuresincludes DNSTracking, DNS over TCP packets requires theeBPFagent to look for DNS header outside of the 1st SKB segment. A neweBPFagent helper function needs to be implemented to support it. Currently, there is no workaround for this issue. (NETOBSERV-1245) -
Currently, when using a
KAFKAdeployment model, if conversation tracking is configured, conversation events might be duplicated across Kafka consumers, resulting in inconsistent tracking of conversations, and incorrect volumetric data. For that reason, it is not recommended to configure conversation tracking whendeploymentModelis set toKAFKA. (NETOBSERV-926) -
Currently, when the
processor.metrics.server.tls.typeis configured to use aPROVIDEDcertificate, the operator enters an unsteady state that might affect its performance and resource consumption. It is recommended to not use aPROVIDEDcertificate until this issue is resolved, and instead using an auto-generated certificate, settingprocessor.metrics.server.tls.typetoAUTO. (NETOBSERV-1293 -
Since the 1.3.0 release of the Network Observability Operator, installing the Operator causes a warning kernel taint to appear. The reason for this error is that the network observability eBPF agent has memory constraints that prevent preallocating the entire hashmap table. The Operator eBPF agent sets the
BPF_F_NO_PREALLOCflag so that pre-allocation is disabled when the hashmap is too memory expansive.
2.1.58. Network Observability Operator 1.3.0 advisory
You can review the following advisory in the Network Observability Operator 1.3.0 release.
2.1.59. Network Observability Operator 1.3.0 new features and enhancements
You can review the following new features and enhancements in the Network Observability Operator 1.3.0 release.
2.1.59.1. Multi-tenancy in network observability
- System administrators can allow and restrict individual user access, or group access, to the flows stored in Loki. For more information, see "Multi-tenancy in network observability".
2.1.59.2. Flow-based metrics dashboard
- This release adds a new dashboard, which provides an overview of the network flows in your OpenShift Container Platform cluster. For more information, see "Network observability metrics dashboards".
2.1.59.3. Troubleshooting with the must-gather tool
- Information about the Network Observability Operator can now be included in the must-gather data for troubleshooting. For more information, see "Network observability must-gather".
2.1.59.4. Multiple architectures now supported
-
Network Observability Operator can now run on an
amd64,ppc64le, orarm64architectures. Previously, it only ran onamd64.
2.1.60. Network Observability Operator 1.3.0 deprecated features
You can review the following deprecated features in the Network Observability Operator 1.3.0 release.
2.1.60.1. Channel deprecation
You must switch your channel from v1.0.x to stable to receive future Operator updates. The v1.0.x channel is deprecated and planned for removal in the next release.
2.1.60.2. Deprecated configuration parameter setting
The release of Network Observability Operator 1.3 deprecates the spec.Loki.authToken HOST setting. When using the Loki Operator, you must now only use the FORWARD setting.
2.1.61. Network Observability Operator 1.3.0 fixed issues
You can review the following fixed issues in the Network Observability Operator 1.3.0 release.
-
Previously, when the Operator was installed from the CLI, the
RoleandRoleBindingthat are necessary for the Cluster Monitoring Operator to read the metrics were not installed as expected. The issue did not occur when the operator was installed from the web console. Now, either way of installing the Operator installs the requiredRoleandRoleBinding. (NETOBSERV-1003) -
Since version 1.2, the Network Observability Operator can raise alerts when a problem occurs with the flows collection. Previously, due to a bug, the related configuration to disable alerts,
spec.processor.metrics.disableAlertswas not working as expected and sometimes ineffectual. Now, this configuration is fixed so that it is possible to disable the alerts. (NETOBSERV-976) -
Previously, when network observability was configured with
spec.loki.authTokenset toDISABLED, only akubeadmincluster administrator was able to view network flows. Other types of cluster administrators received authorization failure. Now, any cluster administrator is able to view network flows. (NETOBSERV-972) -
Previously, a bug prevented users from setting
spec.consolePlugin.portNaming.enabletofalse. Now, this setting can be set tofalseto disable port-to-service name translation. (NETOBSERV-971) - Previously, the metrics exposed by the console plugin were not collected by the Cluster Monitoring Operator (Prometheus), due to an incorrect configuration. Now the configuration has been fixed so that the console plugin metrics are correctly collected and accessible from the OpenShift Container Platform web console. (NETOBSERV-765)
-
Previously, when
processor.metrics.tlswas set toAUTOin theFlowCollector, theflowlogs-pipeline servicemonitordid not adapt the appropriate TLS scheme, and metrics were not visible in the web console. Now the issue is fixed for AUTO mode. (NETOBSERV-1070) -
Previously, certificate configuration, such as used for Kafka and Loki, did not allow specifying a namespace field, implying that the certificates had to be in the same namespace where network observability is deployed. Moreover, when using Kafka with TLS/mTLS, the user had to manually copy the certificate(s) to the privileged namespace where the
eBPFagent pods are deployed and manually manage certificate updates, such as in the case of certificate rotation. Now, network observability setup is simplified by adding a namespace field for certificates in theFlowCollectorresource. As a result, users can now install Loki or Kafka in different namespaces without needing to manually copy their certificates in the network observability namespace. The original certificates are watched so that the copies are automatically updated when needed. (NETOBSERV-773) - Previously, the SCTP, ICMPv4 and ICMPv6 protocols were not covered by the network observability agents, resulting in a less comprehensive network flows coverage. These protocols are now recognized to improve the flows coverage. (NETOBSERV-934)
2.1.62. Network Observability Operator 1.3.0 known issues
You can review the following issues and their workarounds, if available, to troubleshoot issues with the Network Observability Operator 1.3.0 release.
-
When
processor.metrics.tlsis set toPROVIDEDin theFlowCollector, theflowlogs-pipelineservicemonitoris not adapted to the TLS scheme. (NETOBSERV-1087) -
Since the 1.2.0 release of the Network Observability Operator, using Loki Operator 5.6, a Loki certificate change periodically affects the
flowlogs-pipelinepods and results in dropped flows rather than flows written to Loki. The problem self-corrects after some time, but it still causes temporary flow data loss during the Loki certificate change. This issue has only been observed in large-scale environments of 120 nodes or greater.(NETOBSERV-980) -
When you install the Operator, a warning kernel taint can appear. The reason for this error is that the network observability eBPF agent has memory constraints that prevent preallocating the entire hashmap table. The Operator eBPF agent sets the
BPF_F_NO_PREALLOCflag so that pre-allocation is disabled when the hashmap is too memory expansive.
2.1.63. Network observability release notes 1.2.0 preparing for the next update
Switch the Network Observability Operator’s update channel from the deprecated v1.0.x to the stable channel to continue receiving future releases and updates.
The subscription of an installed Operator specifies an update channel that tracks and receives updates for the Operator. Until the 1.2 release of the Network Observability Operator, the only channel available was v1.0.x. The 1.2 release of the Network Observability Operator introduces the stable update channel for tracking and receiving updates. You must switch your channel from v1.0.x to stable to receive future Operator updates. The v1.0.x channel is deprecated and planned for removal in a following release.
2.1.64. Network Observability Operator 1.2.0 advisory
You can view the following advisory for the Network Observability Operator 1.2.0 release.
2.1.65. Network Observability Operator 1.2.0 new features and enhancements
You can view the following new features and enhancements for the Network Observability Operator 1.2.0 release.
2.1.65.1. Histogram in Traffic Flows view
You can now choose to show a histogram of flows over time. The histogram enables you to visualize the history of flows without hitting the Loki query limit. For more information, see "Using the histogram".
2.1.65.2. Conversation tracking
You can now query flows by Log Type, which enables grouping network flows that are part of the same conversation. For more information, see "Working with conversations".
2.1.65.3. Network observability health alerts
The Network Observability Operator now creates automatic alerts if the flowlogs-pipeline is dropping flows because of errors at the write stage or if the Loki ingestion rate limit has been reached. For more information, see "Health dashboards".
2.1.66. Network Observability Operator 1.2.0 bug fixes
You can view the following fixed issues for the Network Observability Operator 1.2.0 release.
-
Previously, after changing the
namespacevalue in the FlowCollector spec,eBPFagent pods running in the previous namespace were not appropriately deleted. Now, the pods running in the previous namespace are appropriately deleted. (NETOBSERV-774) -
Previously, after changing the
caCert.namevalue in the FlowCollector spec (such as in Loki section), FlowLogs-Pipeline pods and Console plug-in pods were not restarted, therefore they were unaware of the configuration change. Now, the pods are restarted, so they get the configuration change. (NETOBSERV-772) - Previously, network flows between pods running on different nodes were sometimes not correctly identified as being duplicates because they are captured by different network interfaces. This resulted in over-estimated metrics displayed in the console plug-in. Now, flows are correctly identified as duplicates, and the console plug-in displays accurate metrics. (NETOBSERV-755)
- The "reporter" option in the console plug-in is used to filter flows based on the observation point of either source node or destination node. Previously, this option mixed the flows regardless of the node observation point. This was due to network flows being incorrectly reported as Ingress or Egress at the node level. Now, the network flow direction reporting is correct. The "reporter" option filters for source observation point, or destination observation point, as expected. (NETOBSERV-696)
- Previously, for agents configured to send flows directly to the processor as gRPC+protobuf requests, the submitted payload could be too large and is rejected by the processors' GRPC server. This occurred under very-high-load scenarios and with only some configurations of the agent. The agent logged an error message, such as: grpc: received message larger than max. As a consequence, there was information loss about those flows. Now, the gRPC payload is split into several messages when the size exceeds a threshold. As a result, the server maintains connectivity. (NETOBSERV-617)
2.1.67. Network Observability Operator 1.2.0 known issues
You can review the following issues and their workarounds, if available, to troubleshoot issues with the Network Observability Operator 1.2.0 release.
-
In the 1.2.0 release of the Network Observability Operator, using Loki Operator 5.6, a Loki certificate transition periodically affects the
flowlogs-pipelinepods and results in dropped flows rather than flows written to Loki. The problem self-corrects after some time, but it still causes temporary flow data loss during the Loki certificate transition. (NETOBSERV-980)
2.1.68. Network Observability Operator 1.2.0 notable technical changes
The Network Observability Operator 1.2.0 release requires installation in the openshift-netobserv-operator namespace due to new technical changes. Users who previously used a custom namespace must delete the old instance and reinstall the Operator.
Previously, you could install the Network Observability Operator using a custom namespace. This release introduces the conversion webhook which changes the ClusterServiceVersion. Because of this change, all the available namespaces are no longer listed. Additionally, to enable Operator metrics collection, namespaces that are shared with other Operators, like the openshift-operators namespace, cannot be used.
Now, the Operator must be installed in the openshift-netobserv-operator namespace.
You cannot automatically upgrade to the new Operator version if you previously installed the Network Observability Operator using a custom namespace. If you previously installed the Operator using a custom namespace, you must delete the instance of the Operator that was installed and re-install your operator in the openshift-netobserv-operator namespace. It is important to note that custom namespaces, such as the commonly used netobserv namespace, are still possible for the FlowCollector, Loki, Kafka, and other plug-ins.
2.1.69. Network Observability Operator 1.1.0 enhancements
You can view the following advisory for the Network Observability Operator 1.1.0:
The Network Observability Operator is now stable and the release channel is upgraded to v1.1.0.
2.1.70. Network Observability Operator 1.1.0 fixed issues
You can view the following fixed issues for the Network Observability Operator 1.1.0 release.
-
Previously, unless the Loki
authTokenconfiguration was set toFORWARDmode, authentication was not enforced, allowing unauthorized users to retrieve flows. Now, regardless of the LokiauthTokenmode, only cluster administrators can retrieve flows. (BZ#2169468)
Chapter 3. About network observability
Use the Network Observability Operator to observe network traffic via eBPF technology, providing troubleshooting insights through Prometheus metrics and Loki logs.
You can view and analyze this stored information in the OpenShift Container Platform console for further insight and troubleshooting.
3.1. Network Observability Operator
The Network Observability Operator provides the FlowCollector API custom resource. A FlowCollector instance is a cluster-scoped resource that enables configuration of network flow collection. This instance deploys pods and services that form a monitoring pipeline.
The eBPF agent is deployed as a daemonset object and creates the network flows. The pipeline collects and enriches network flows with Kubernetes metadata before storing them in Loki or generating Prometheus metrics.
3.2. Optional dependencies of the Network Observability Operator
You can optionally integrate the Network Observability Operator with other components to enhance its functionality and scalability. Supported optional dependencies include the Loki Operator for flow storage, and AMQ Streams for large-scale data handling with Kafka.
- Loki Operator
- You can use Loki as the backend to store all collected flows with a maximal level of details. It is recommended to use the Red Hat supported Loki Operator to install Loki. You can also choose to use network observability without Loki, but you need to consider some factors. For more information, see "Network observability without Loki".
- AMQ Streams Operator
Kafka provides scalability, resiliency and high availability in the OpenShift Container Platform cluster for large scale deployments.
NoteIf you choose to use Kafka, it is recommended to use Red Hat supported AMQ Streams Operator.
3.3. OpenShift Container Platform console integration
OpenShift Container Platform console integration offers an overview, a topology view, and traffic flow tables. The Network observability metrics dashboards in Observe → Dashboards are available only to users with administrator access.
To enable multi-tenancy for developer access and for administrators with limited access to namespaces, you must specify permissions by defining roles. For more information, see "Enabling multi-tenancy in network observability".
3.3.1. Network observability metrics dashboards
In the OpenShift Container Platform console on the Overview tab, you can view the overall aggregated metrics of the network traffic flow on the cluster. You can choose to display the information by cluster, node, namespace, owner, pod, and service. Filters and display options can further refine the metrics. For more information, see "Observing the network traffic from the Overview view".
In Observe → Dashboards, the Netobserv dashboards provide a quick overview of the network flows in your OpenShift Container Platform cluster. The Netobserv/Health dashboard provides metrics about the health of the Operator. For more information, see "Network observability metrics" and "Viewing health information".
3.3.2. Network observability topology views
The OpenShift Container Platform console offers the Topology tab which displays a graphical representation of the network flows and the amount of traffic. The topology view represents traffic between the OpenShift Container Platform components as a network graph. You can refine the graph by using the filters and display options. You can access the information for cluster, zone, udn, node, namespace, owner, pod, and service.
3.3.3. Traffic flow tables
The Traffic flow table view provides a view for raw flows, non aggregated filtering options, and configurable columns. The OpenShift Container Platform console offers the Traffic flows tab which displays the data of the network flows and the amount of traffic.
3.4. Network Observability CLI
You can quickly debug and troubleshoot networking issues with network observability by using the Network Observability command-line interface (CLI), oc netobserv. The Network Observability CLI is a flow and packet visualization tool that relies on eBPF agents to stream collected data to an ephemeral collector pod. It requires no persistent storage during the capture. After the run, the output is transferred to your local machine. This enables quick, live insight into packets and flow data without installing the Network Observability Operator.
Chapter 4. Installing the Network Observability Operator
Installing the Loki Operator is recommended before using the Network Observability Operator. You can use network observability without Loki, but special considerations apply if you only need metrics or external exporters.
The Loki Operator integrates a gateway that implements multi-tenancy and authentication with Loki for data flow storage. The LokiStack resource manages Loki, which is a scalable, highly-available, multi-tenant log aggregation system, and a web proxy with OpenShift Container Platform authentication. The LokiStack proxy uses OpenShift Container Platform authentication to enforce multi-tenancy and facilitate the saving and indexing of data in Loki log stores.
The Loki Operator can also be used for configuring the LokiStack log store. The Network Observability Operator requires a dedicated LokiStack separate from the logging.
4.1. Network observability without Loki
You can use network observability without Loki by not performing the Loki installation steps and skipping directly to "Installing the Network Observability Operator". If you only want to export flows to a Kafka consumer or IPFIX collector, or you only need dashboard metrics, then you do not need to install Loki or provide storage for Loki. The following table compares available features with and without Loki.
| With Loki | Without Loki | |
|---|---|---|
| Exporters | X | X |
| Multi-tenancy | X | X |
| Complete filtering and aggregations capabilities [1] | X | |
| Partial filtering and aggregations capabilities [2] | X | X |
| Flow-based metrics and dashboards | X | X |
| Traffic flows view overview [3] | X | X |
| Traffic flows view table | X | |
| Topology view | X | X |
| OpenShift Container Platform console Network Traffic tab integration | X | X |
- Such as per pod.
- Such as per workload or namespace.
- Statistics on packet drops are only available with Loki.
4.2. Installing the Loki Operator
The Loki Operator versions 6.0+ are the supported Loki Operator versions for Network Observability; these versions provide the ability to create a LokiStack instance using the openshift-network tenant configuration mode and provide fully-automatic, in-cluster authentication and authorization support for Network Observability. There are several ways you can install Loki. One way is by using the OpenShift Container Platform web console Operator Hub.
Prerequisites
- You have administrator permissions.
- You have access to the OpenShift Container Platform web console.
- You have access to a supported object store. For example: AWS S3, Google Cloud Storage, Azure, Swift, Minio, or OpenShift Data Foundation.
Procedure
- In the OpenShift Container Platform web console, click Operators → OperatorHub.
- Choose Loki Operator from the list of available Operators, and click Install.
- Under Installation Mode, select All namespaces on the cluster.
Verification
- Verify that you installed the Loki Operator. Visit the Operators → Installed Operators page and look for Loki Operator.
- Verify that Loki Operator is listed with Status as Succeeded in all the projects.
To uninstall Loki, refer to the uninstallation process that corresponds with the method you used to install Loki. You might have remaining ClusterRoles and ClusterRoleBindings, data stored in object store, and persistent volume that must be removed.
4.2.1. Creating a secret for Loki storage
The Loki Operator supports a few log storage options, such as AWS S3, Google Cloud Storage, Azure, Swift, Minio, OpenShift Data Foundation. The following example shows how to create a secret for AWS S3 storage. The secret created in this example, loki-s3, is referenced in "Creating a LokiStack resource". You can create this secret in the web console or CLI.
-
Using the web console, navigate to the Project → All Projects dropdown and select Create Project. Name the project
netobservand click Create. Navigate to the Import icon, +, in the top right corner. Paste your YAML file into the editor.
The following shows an example secret YAML file for S3 storage:
apiVersion: v1 kind: Secret metadata: name: loki-s3 namespace: netobserv1 stringData: access_key_id: QUtJQUlPU0ZPRE5ON0VYQU1QTEUK access_key_secret: d0phbHJYVXRuRkVNSS9LN01ERU5HL2JQeFJmaUNZRVhBTVBMRUtFWQo= bucketnames: s3-bucket-name endpoint: https://s3.eu-central-1.amazonaws.com region: eu-central-1- 1
- The installation examples in this documentation use the same namespace,
netobserv, across all components. You can optionally use a different namespace for the different components
Verification
- Once you create the secret, you should see it listed under Workloads → Secrets in the web console.
4.2.2. Creating a LokiStack custom resource
You can deploy a LokiStack custom resource (CR) by using the web console or OpenShift CLI (oc) to create a namespace, or new project.
Procedure
- Navigate to Operators → Installed Operators, viewing All projects from the Project dropdown.
- Look for Loki Operator. In the details, under Provided APIs, select LokiStack.
- Click Create LokiStack.
Ensure the following fields are specified in either Form View or YAML view:
apiVersion: loki.grafana.com/v1 kind: LokiStack metadata: name: loki namespace: netobserv1 spec: size: 1x.small2 storage: schemas: - version: v13 effectiveDate: '2022-06-01' secret: name: loki-s3 type: s3 storageClassName: gp33 tenants: mode: openshift-network- 1
- The installation examples in this documentation use the same namespace,
netobserv, across all components. You can optionally use a different namespace. - 2
- Specify the deployment size. In the Loki Operator 5.8 and later versions, the supported size options for production instances of Loki are
1x.extra-small,1x.small, or1x.medium.ImportantIt is not possible to change the number
1xfor the deployment size. - 3
- Use a storage class name that is available on the cluster for
ReadWriteOnceaccess mode. For best performance, specify a storage class that allocates block storage. You can useoc get storageclassesto see what is available on your cluster.ImportantYou must not reuse the same
LokiStackCR that is used for logging.
- Click Create.
4.2.3. Creating a new group for the cluster-admin user role
Querying application logs for multiple namespaces as a cluster-admin user, where the sum total of characters of all of the namespaces in the cluster is greater than 5120, results in the error Parse error: input size too long (XXXX > 5120). For better control over access to logs in LokiStack, make the cluster-admin user a member of the cluster-admin group. If the cluster-admin group does not exist, create it and add the desired users to it.
Use the following procedure to create a new group for users with cluster-admin permissions.
Procedure
Enter the following command to create a new group:
$ oc adm groups new cluster-adminEnter the following command to add the desired user to the
cluster-admingroup:$ oc adm groups add-users cluster-admin <username>Enter the following command to add
cluster-adminuser role to the group:$ oc adm policy add-cluster-role-to-group cluster-admin cluster-admin
4.2.4. Custom admin group access
If you need to see cluster-wide logs without necessarily being an administrator, or if you already have any group defined that you want to use here, you can specify a custom group using the adminGroup field. Users who are members of any group specified in the adminGroups field of the LokiStack custom resource (CR) have the same read access to logs as administrators.
Administrator users have access to all network logs across the cluster.
Example LokiStack CR
apiVersion: loki.grafana.com/v1
kind: LokiStack
metadata:
name: loki
namespace: netobserv
spec:
tenants:
mode: openshift-network
openshift:
adminGroups:
- cluster-admin
- custom-admin-group 4.2.5. Loki deployment sizing
Sizing for Loki follows the format of 1x.<size> where the value 1x is number of instances and <size> specifies performance capabilities.
It is not possible to change the number 1x for the deployment size.
| 1x.demo | 1x.extra-small | 1x.small | 1x.medium | |
|---|---|---|---|---|
| Data transfer | Demo use only | 100GB/day | 500GB/day | 2TB/day |
| Queries per second (QPS) | Demo use only | 1-25 QPS at 200ms | 25-50 QPS at 200ms | 25-75 QPS at 200ms |
| Replication factor | None | 2 | 2 | 2 |
| Total CPU requests | None | 14 vCPUs | 34 vCPUs | 54 vCPUs |
| Total memory requests | None | 31Gi | 67Gi | 139Gi |
| Total disk requests | 40Gi | 430Gi | 430Gi | 590Gi |
4.2.6. LokiStack ingestion limits and health alerts
The LokiStack instance comes with default settings according to the configured size. It is possible to override some of these settings, such as the ingestion and query limits. An automatic alert in the web console notifies you when these limits are reached.
You might want to update the ingestion and query limits if you get Loki errors showing up in the Console plugin, or in flowlogs-pipeline logs.
Here is an example of configured limits:
spec:
limits:
global:
ingestion:
ingestionBurstSize: 40
ingestionRate: 20
maxGlobalStreamsPerTenant: 25000
queries:
maxChunksPerQuery: 2000000
maxEntriesLimitPerQuery: 10000
maxQuerySeries: 3000For more information about these settings, see the LokiStack API reference.
4.3. Installing the Network Observability Operator
You can install the Network Observability Operator using the OpenShift Container Platform web console Operator Hub. When you install the Operator, it provides the FlowCollector custom resource definition (CRD). You can set specifications in the web console when you create the FlowCollector.
The actual memory consumption of the Operator depends on your cluster size and the number of resources deployed. Memory consumption might need to be adjusted accordingly. For more information refer to "Network Observability controller manager pod runs out of memory" in the "Important Flow Collector configuration considerations" section.
Prerequisites
- If you choose to use Loki, install the Loki Operator version 5.7+.
-
You must have
cluster-adminprivileges. -
One of the following supported architectures is required:
amd64,ppc64le,arm64, ors390x. - Any CPU supported by Red Hat Enterprise Linux (RHEL) 9.
- Must be configured with OVN-Kubernetes or OpenShift SDN as the main network plugin, and optionally using secondary interfaces with Multus and SR-IOV.
Additionally, this installation example uses the netobserv namespace, which is used across all components. You can optionally use a different namespace.
Procedure
- In the OpenShift Container Platform web console, click Operators → OperatorHub.
- Choose Network Observability Operator from the list of available Operators in the OperatorHub, and click Install.
-
Select the checkbox
Enable Operator recommended cluster monitoring on this Namespace. - Navigate to Operators → Installed Operators. Under Provided APIs for Network Observability, select the Flow Collector link.
- Follow the Network Observability FlowCollector setup wizard.
- Click Create.
Verification
To confirm this was successful, when you navigate to Observe you should see Network Traffic listed in the options.
In the absence of Application Traffic within the OpenShift Container Platform cluster, default filters might show that there are "No results", which results in no visual flow. Beside the filter selections, select Clear all filters to see the flow.
4.4. Enabling multi-tenancy in network observability
Multi-tenancy in the Network Observability Operator allows and restricts individual user access, or group access, to the flows stored in Loki and or Prometheus. Access is enabled for project administrators. Project administrators who have limited access to some namespaces can access flows for only those namespaces.
For Developers, multi-tenancy is available for both Loki and Prometheus but requires different access rights.
Prerequisite
- If you are using Loki, you have installed at least Loki Operator version 5.7.
- You must be logged in as a project administrator.
Procedure
For per-tenant access, you must have the
netobserv-readercluster role and thenetobserv-metrics-readernamespace role to use the developer perspective. Run the following commands for this level of access:$ oc adm policy add-cluster-role-to-user netobserv-reader <user_group_or_name>$ oc adm policy add-role-to-user netobserv-metrics-reader <user_group_or_name> -n <namespace>For cluster-wide access, non-cluster-administrators must have the
netobserv-reader,cluster-monitoring-view, andnetobserv-metrics-readercluster roles. In this scenario, you can use either the admin perspective or the developer perspective. Run the following commands for this level of access:$ oc adm policy add-cluster-role-to-user netobserv-reader <user_group_or_name>$ oc adm policy add-cluster-role-to-user cluster-monitoring-view <user_group_or_name>$ oc adm policy add-cluster-role-to-user netobserv-metrics-reader <user_group_or_name>
4.6. Installing Kafka (optional)
The Kafka Operator is supported for large scale environments. Kafka provides high-throughput and low-latency data feeds for forwarding network flow data in a more resilient, scalable way. You can install the Kafka Operator as Red Hat AMQ Streams from the Operator Hub, just as the Loki Operator and Network Observability Operator were installed. Refer to "Configuring the FlowCollector resource with Kafka" to configure Kafka as a storage option.
To uninstall Kafka, refer to the uninstallation process that corresponds with the method you used to install.
4.7. Uninstalling the Network Observability Operator
You can uninstall the Network Observability Operator using the OpenShift Container Platform web console Operator Hub, working in the Operators → Installed Operators area.
Procedure
Remove the
FlowCollectorcustom resource.- Click Flow Collector, which is next to the Network Observability Operator in the Provided APIs column.
-
Click the options menu
 for the cluster and select Delete FlowCollector.
Uninstall the Network Observability Operator.
- Navigate back to the Operators → Installed Operators area.
-
Click the options menu
next to the Network Observability Operator and select Uninstall Operator.
-
Home → Projects and select
openshift-netobserv-operator - Navigate to Actions and select Delete Project
Remove the
FlowCollectorcustom resource definition (CRD).- Navigate to Administration → CustomResourceDefinitions.
-
Look for FlowCollector and click the options menu
.
Select Delete CustomResourceDefinition.
ImportantThe Loki Operator and Kafka remain if they were installed and must be removed separately. Additionally, you might have remaining data stored in an object store, and a persistent volume that must be removed.
Chapter 5. Network Observability Operator in OpenShift Container Platform
The Network Observability Operator for OpenShift Container Platform deploys a monitoring pipeline. This pipeline collects and enriches network traffic flows generated by the eBPF agent.
5.1. Viewing statuses
The Network Observability Operator provides the Flow Collector API. When a Flow Collector resource is created, it deploys pods and services to create and store network flows in the Loki log store, as well as to display dashboards, metrics, and flows in the OpenShift Container Platform web console.
Procedure
Run the following command to view the state of
FlowCollector:$ oc get flowcollector/clusterExample output
NAME AGENT SAMPLING (EBPF) DEPLOYMENT MODEL STATUS cluster EBPF 50 DIRECT ReadyCheck the status of pods running in the
netobservnamespace by entering the following command:$ oc get pods -n netobservExample output
NAME READY STATUS RESTARTS AGE flowlogs-pipeline-56hbp 1/1 Running 0 147m flowlogs-pipeline-9plvv 1/1 Running 0 147m flowlogs-pipeline-h5gkb 1/1 Running 0 147m flowlogs-pipeline-hh6kf 1/1 Running 0 147m flowlogs-pipeline-w7vv5 1/1 Running 0 147m netobserv-plugin-cdd7dc6c-j8ggp 1/1 Running 0 147mThe
flowlogs-pipelinepods collect flows, enriches the collected flows, then send flows to the Loki storage.netobserv-pluginpods create a visualization plugin for the OpenShift Container Platform Console.Check the status of pods running in the namespace
netobserv-privilegedby entering the following command:$ oc get pods -n netobserv-privilegedExample output
NAME READY STATUS RESTARTS AGE netobserv-ebpf-agent-4lpp6 1/1 Running 0 151m netobserv-ebpf-agent-6gbrk 1/1 Running 0 151m netobserv-ebpf-agent-klpl9 1/1 Running 0 151m netobserv-ebpf-agent-vrcnf 1/1 Running 0 151m netobserv-ebpf-agent-xf5jh 1/1 Running 0 151mThe
netobserv-ebpf-agentpods monitor network interfaces of the nodes to get flows and send them toflowlogs-pipelinepods.If you are using the Loki Operator, check the status of the
componentpods ofLokiStackcustom resource in thenetobservnamespace by entering the following command:$ oc get pods -n netobservExample output
NAME READY STATUS RESTARTS AGE lokistack-compactor-0 1/1 Running 0 18h lokistack-distributor-654f87c5bc-qhkhv 1/1 Running 0 18h lokistack-distributor-654f87c5bc-skxgm 1/1 Running 0 18h lokistack-gateway-796dc6ff7-c54gz 2/2 Running 0 18h lokistack-index-gateway-0 1/1 Running 0 18h lokistack-index-gateway-1 1/1 Running 0 18h lokistack-ingester-0 1/1 Running 0 18h lokistack-ingester-1 1/1 Running 0 18h lokistack-ingester-2 1/1 Running 0 18h lokistack-querier-66747dc666-6vh5x 1/1 Running 0 18h lokistack-querier-66747dc666-cjr45 1/1 Running 0 18h lokistack-querier-66747dc666-xh8rq 1/1 Running 0 18h lokistack-query-frontend-85c6db4fbd-b2xfb 1/1 Running 0 18h lokistack-query-frontend-85c6db4fbd-jm94f 1/1 Running 0 18h
5.2. Network Observablity Operator architecture
The Network Observability Operator provides the FlowCollector API, which is instantiated at installation and configured to reconcile the eBPF agent, the flowlogs-pipeline, and the netobserv-plugin components. Only a single FlowCollector per cluster is supported.
The eBPF agent runs on each cluster node with some privileges to collect network flows. The flowlogs-pipeline receives the network flows data and enriches the data with Kubernetes identifiers. If you choose to use Loki, the flowlogs-pipeline sends flow logs data to Loki for storing and indexing. The netobserv-plugin, which is a dynamic OpenShift Container Platform web console plugin, queries Loki to fetch network flows data. Cluster-admins can view the data in the web console.
If you do not use Loki, you can generate metrics with Prometheus. Those metrics and their related dashboards are accessible in the web console. For more information, see "Network Observability without Loki".
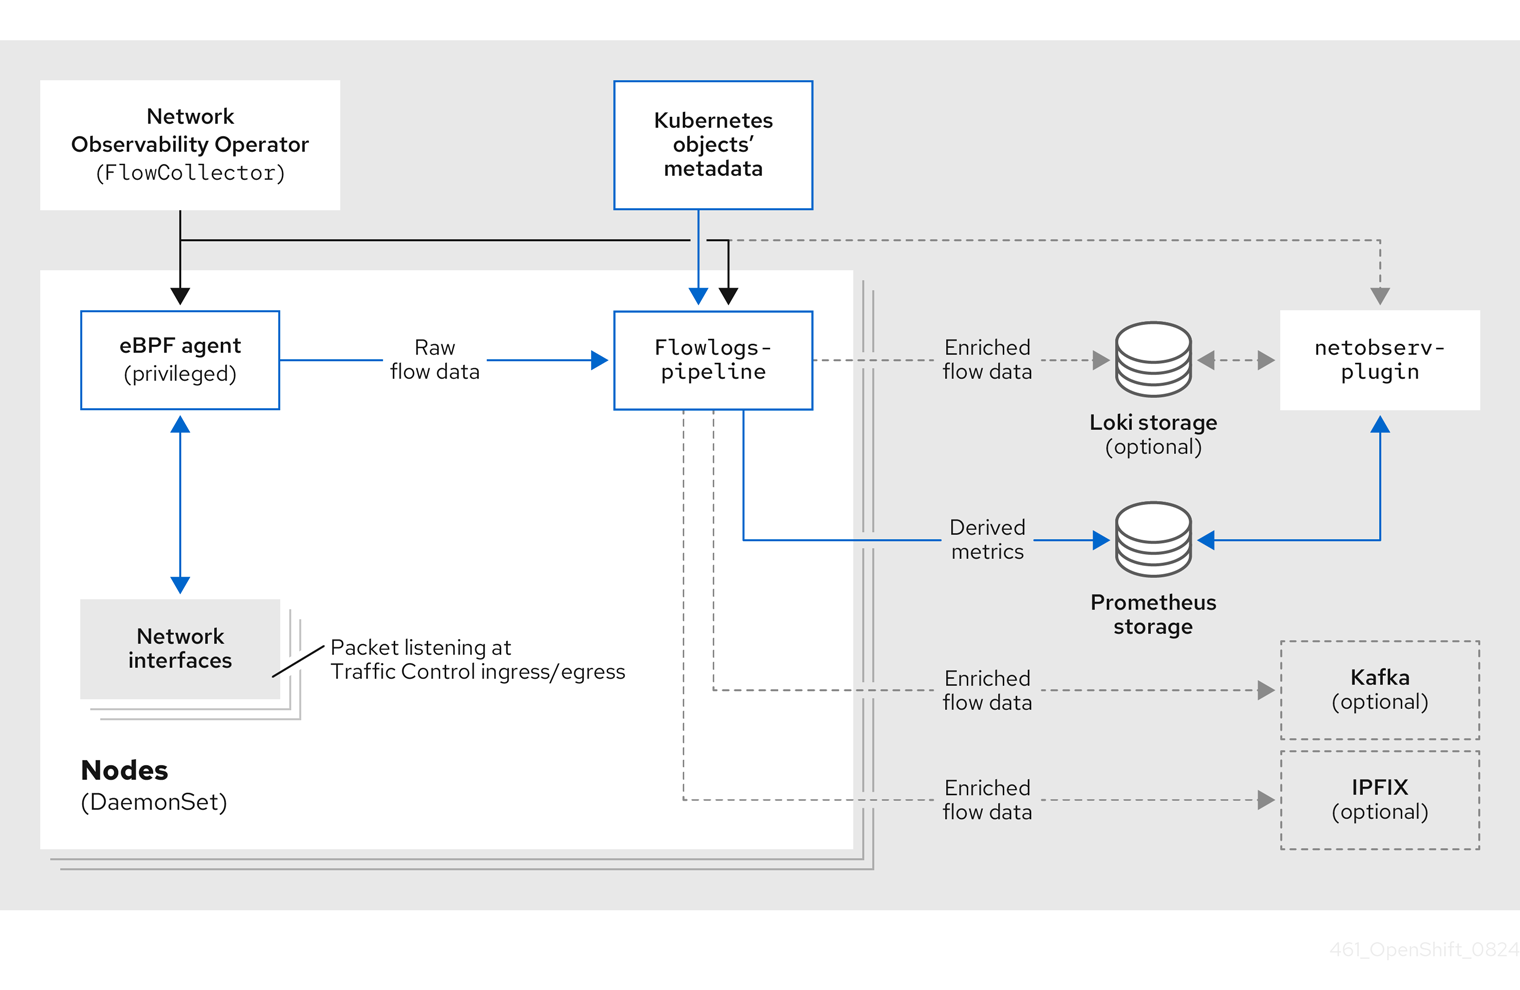
There are three deployment model options for the Network Observability Operator.
The Network Observability Operator does not manage Loki or other data stores. You must install Loki separately by using the Loki Operator. If you use Kafka, you must install it separately by using the Kafka Operator.
- Service deployment model
-
When the
spec.deploymentModelfield in theFlowCollectorresource is set toService, agents are deployed per node as daemon sets. Theflowlogs-pipelineis a standard deployment with a service. You can scale theflowlogs-pipelinecomponent by using thespec.processor.consumerReplicasfield. - Direct deployment model
-
When the
spec.deploymentModelfield is set toDirect, agents and theflowlogs-pipelineare both deployed per node as daemon sets. This model is suitable for technology assessments and small clusters. However, it is less memory-efficient in large clusters because each instance offlowlogs-pipelinecaches the same cluster information. - Kafka deployment model (optional)
If you use the Kafka option, the
eBPF agentsends the network flow data to Kafka. You can scale theflowlogs-pipelinecomponent by using thespec.processor.consumerReplicasfield. Theflowlogs-pipelinecomponent reads from the Kafka topic before sending data to Loki, as shown in the following diagram.
5.3. Viewing Network Observability Operator status and configuration
You can inspect the status and view the details of the FlowCollector using the oc describe command.
Procedure
Run the following command to view the status and configuration of the Network Observability Operator:
$ oc describe flowcollector/cluster
Chapter 6. Configuring the Network Observability Operator
Configure the Network Observability Operator by updating the cluster-wide FlowCollector API resource (cluster) to manage component configurations and flow collection settings.
The FlowCollector is explicitly created during installation. Since this resource operates cluster-wide, only a single FlowCollector is allowed, and it must be named cluster. For more information, see the FlowCollector API reference.
6.1. View the FlowCollector resource
The FlowCollector resource can be viewed and modified in the OpenShift Container Platform web console through the integrated setup, advanced form, or by editing the YAML directly.
Procedure
- In the web console, navigate to Operators → Installed Operators.
- Under the Provided APIs heading for the NetObserv Operator, select Flow Collector.
-
Select cluster then select the YAML tab. There, you can modify the
FlowCollectorresource to configure the Network Observability Operator.
The following example shows a sample FlowCollector resource for OpenShift Container Platform Network Observability Operator:
Sample FlowCollector resource
apiVersion: flows.netobserv.io/v1beta2
kind: FlowCollector
metadata:
name: cluster
spec:
namespace: netobserv
deploymentModel: Service
agent:
type: eBPF
ebpf:
sampling: 50
logLevel: info
privileged: false
resources:
requests:
memory: 50Mi
cpu: 100m
limits:
memory: 800Mi
processor:
logLevel: info
resources:
requests:
memory: 100Mi
cpu: 100m
limits:
memory: 800Mi
logTypes: Flows
advanced:
conversationEndTimeout: 10s
conversationHeartbeatInterval: 30s
loki:
mode: LokiStack
consolePlugin:
register: true
logLevel: info
portNaming:
enable: true
portNames:
"3100": loki
quickFilters:
- name: Applications
filter:
src_namespace!: 'openshift-,netobserv'
dst_namespace!: 'openshift-,netobserv'
default: true
- name: Infrastructure
filter:
src_namespace: 'openshift-,netobserv'
dst_namespace: 'openshift-,netobserv'
- name: Pods network
filter:
src_kind: 'Pod'
dst_kind: 'Pod'
default: true
- name: Services network
filter:
dst_kind: 'Service'- 1
- The Agent specification,
spec.agent.type, must beEBPF. eBPF is the only OpenShift Container Platform supported option. - 2
- You can set the Sampling specification,
spec.agent.ebpf.sampling, to manage resources. By default, eBPF sampling is set to50, so a flow has a 1 in 50 chance of being sampled. A lower sampling interval value requires more computational, memory, and storage resources. A value of0or1means all flows are sampled. It is recommended to start with the default value and refine it empirically to determine the optimal setting for your cluster. - 3
- The Processor specification
spec.processor.can be set to enable conversation tracking. When enabled, conversation events are queryable in the web console. Thespec.processor.logTypesvalue isFlows. Thespec.processor.advancedvalues areConversations,EndedConversations, orALL. Storage requirements are highest forAlland lowest forEndedConversations. - 4
- The Loki specification,
spec.loki, specifies the Loki client. The default values match the Loki install paths mentioned in the Installing the Loki Operator section. If you used another installation method for Loki, specify the appropriate client information for your install. - 5
- The
LokiStackmode automatically sets a few configurations:querierUrl,ingesterUrlandstatusUrl,tenantID, and corresponding TLS configuration. Cluster roles and a cluster role binding are created for reading and writing logs to Loki. AndauthTokenis set toForward. You can set these manually using theManualmode. - 6
- The
spec.quickFiltersspecification defines filters that show up in the web console. TheApplicationfilter keys,src_namespaceanddst_namespace, are negated (!), so theApplicationfilter shows all traffic that does not originate from, or have a destination to, anyopenshift-ornetobservnamespaces. For more information, see Configuring quick filters below.
6.2. Configuring the Flow Collector resource with Kafka
You can configure the FlowCollector resource to use Kafka for high-throughput and low-latency data feeds. A Kafka instance needs to be running, and a Kafka topic dedicated to OpenShift Container Platform Network Observability must be created in that instance. For more information, see Kafka documentation with AMQ Streams.
Prerequisites
- Kafka is installed. Red Hat supports Kafka with AMQ Streams Operator.
Procedure
- In the web console, navigate to Operators → Installed Operators.
- Under the Provided APIs heading for the Network Observability Operator, select Flow Collector.
- Select the cluster and then click the YAML tab.
-
Modify the
FlowCollectorresource for OpenShift Container Platform Network Observability Operator to use Kafka, as shown in the following sample YAML:
Sample Kafka configuration in FlowCollector resource
apiVersion: flows.netobserv.io/v1beta2
kind: FlowCollector
metadata:
name: cluster
spec:
deploymentModel: Kafka
kafka:
address: "kafka-cluster-kafka-bootstrap.netobserv"
topic: network-flows
tls:
enable: false - 1
- Set
spec.deploymentModeltoKafkainstead ofDirectto enable the Kafka deployment model. - 2
spec.kafka.addressrefers to the Kafka bootstrap server address. You can specify a port if needed, for instancekafka-cluster-kafka-bootstrap.netobserv:9093for using TLS on port 9093.- 3
spec.kafka.topicshould match the name of a topic created in Kafka.- 4
spec.kafka.tlscan be used to encrypt all communications to and from Kafka with TLS or mTLS. When enabled, the Kafka CA certificate must be available as a ConfigMap or a Secret, both in the namespace where theflowlogs-pipelineprocessor component is deployed (default:netobserv) and where the eBPF agents are deployed (default:netobserv-privileged). It must be referenced withspec.kafka.tls.caCert. When using mTLS, client secrets must be available in these namespaces as well (they can be generated for instance using the AMQ Streams User Operator) and referenced withspec.kafka.tls.userCert.
6.3. Export enriched network flow data
You can send network flows to Kafka, IPFIX, the Red Hat build of OpenTelemetry, or all three at the same time. For Kafka or IPFIX, any processor or storage that supports those inputs, such as Splunk, Elasticsearch, or Fluentd, can consume the enriched network flow data. For OpenTelemetry, network flow data and metrics can be exported to a compatible OpenTelemetry endpoint, such as Red Hat build of OpenTelemetry or Prometheus.
Prerequisites
-
Your Kafka, IPFIX, or OpenTelemetry collector endpoints are available from Network Observability
flowlogs-pipelinepods.
Procedure
- In the web console, navigate to Operators → Installed Operators.
- Under the Provided APIs heading for the NetObserv Operator, select Flow Collector.
- Select cluster and then select the YAML tab.
Edit the
FlowCollectorto configurespec.exportersas follows:apiVersion: flows.netobserv.io/v1beta2 kind: FlowCollector metadata: name: cluster spec: exporters: - type: Kafka1 kafka: address: "kafka-cluster-kafka-bootstrap.netobserv" topic: netobserv-flows-export2 tls: enable: false3 - type: IPFIX4 ipfix: targetHost: "ipfix-collector.ipfix.svc.cluster.local" targetPort: 4739 transport: tcp or udp5 - type: OpenTelemetry6 openTelemetry: targetHost: my-otelcol-collector-headless.otlp.svc targetPort: 4317 type: grpc7 logs:8 enable: true metrics:9 enable: true prefix: netobserv pushTimeInterval: 20s10 expiryTime: 2m # fieldsMapping:11 # input: SrcAddr # output: source.address- 1 4 6
- You can export flows to IPFIX, OpenTelemetry, and Kafka individually or concurrently.
- 2
- The Network Observability Operator exports all flows to the configured Kafka topic.
- 3
- You can encrypt all communications to and from Kafka with SSL/TLS or mTLS. When enabled, the Kafka CA certificate must be available as a ConfigMap or a Secret, both in the namespace where the
flowlogs-pipelineprocessor component is deployed (default: netobserv). It must be referenced withspec.exporters.tls.caCert. When using mTLS, client secrets must be available in these namespaces as well (they can be generated for instance using the AMQ Streams User Operator) and referenced withspec.exporters.tls.userCert. - 5
- You have the option to specify transport. The default value is
tcpbut you can also specifyudp. - 7
- The protocol of OpenTelemetry connection. The available options are
httpandgrpc. - 8
- OpenTelemetry configuration for exporting logs, which are the same as the logs created for Loki.
- 9
- OpenTelemetry configuration for exporting metrics, which are the same as the metrics created for Prometheus. These configurations are specified in the
spec.processor.metrics.includeListparameter of theFlowCollectorcustom resource, along with any custom metrics you defined using theFlowMetricscustom resource. - 10
- The time interval that metrics are sent to the OpenTelemetry collector.
- 11
- Optional:Network Observability network flows formats get automatically renamed to an OpenTelemetry compliant format. The
fieldsMappingspecification gives you the ability to customize the OpenTelemetry format output. For example in the YAML sample,SrcAddris the Network Observability input field, and it is being renamedsource.addressin OpenTelemetry output. You can see both Network Observability and OpenTelemetry formats in the "Network flows format reference".
After configuration, network flows data can be sent to an available output in a JSON format. For more information, see "Network flows format reference".
6.4. Updating the Flow Collector resource
As an alternative to editing YAML in the OpenShift Container Platform web console, you can configure specifications, such as eBPF sampling, by patching the flowcollector custom resource (CR):
Procedure
Run the following command to patch the
flowcollectorCR and update thespec.agent.ebpf.samplingvalue:$ oc patch flowcollector cluster --type=json -p "[{"op": "replace", "path": "/spec/agent/ebpf/sampling", "value": <new value>}] -n netobserv"
6.5. Configuring quick filters
You can modify the filters in the FlowCollector resource. Exact matches are possible using double-quotes around values. Otherwise, partial matches are used for textual values. The bang (!) character, placed at the end of a key, means negation. See the sample FlowCollector resource for more context about modifying the YAML.
The filter matching types "all of" or "any of" is a UI setting that the users can modify from the query options. It is not part of this resource configuration.
Here is a list of all available filter keys:
| Universal* | Source | Destination | Description |
|---|---|---|---|
| namespace |
|
| Filter traffic related to a specific namespace. |
| name |
|
| Filter traffic related to a given leaf resource name, such as a specific pod, service, or node (for host-network traffic). |
| kind |
|
| Filter traffic related to a given resource kind. The resource kinds include the leaf resource (Pod, Service or Node), or the owner resource (Deployment and StatefulSet). |
| owner_name |
|
| Filter traffic related to a given resource owner; that is, a workload or a set of pods. For example, it can be a Deployment name, a StatefulSet name, etc. |
| resource |
|
|
Filter traffic related to a specific resource that is denoted by its canonical name, that identifies it uniquely. The canonical notation is |
| address |
|
| Filter traffic related to an IP address. IPv4 and IPv6 are supported. CIDR ranges are also supported. |
| mac |
|
| Filter traffic related to a MAC address. |
| port |
|
| Filter traffic related to a specific port. |
| host_address |
|
| Filter traffic related to the host IP address where the pods are running. |
| protocol | N/A | N/A | Filter traffic related to a protocol, such as TCP or UDP. |
-
Universal keys filter for any of source or destination. For example, filtering
name: 'my-pod'means all traffic frommy-podand all traffic tomy-pod, regardless of the matching type used, whether Match all or Match any.
6.6. Resource management and performance considerations
The amount of resources required by network observability depends on the size of your cluster and your requirements for the cluster to ingest and store observability data. To manage resources and set performance criteria for your cluster, consider configuring the following settings. Configuring these settings might meet your optimal setup and observability needs.
The following settings can help you manage resources and performance from the outset:
- eBPF Sampling
-
You can set the Sampling specification,
spec.agent.ebpf.sampling, to manage resources. By default, eBPF sampling is set to50, so a flow has a 1 in 50 chance of being sampled. A lower sampling interval value requires more computational, memory, and storage resources. A value of0or1means all flows are sampled. It is recommended to start with the default value and refine it empirically to determine the optimal setting for your cluster. - eBPF features
- The more features that are enabled, the more CPU and memory are impacted. See "Observing the network traffic" for a complete list of these features.
- Without Loki
- You can reduce the amount of resources that network observability requires by not using Loki and instead relying on Prometheus. For example, when network observability is configured without Loki, the total savings of memory usage are in the 20-65% range and CPU utilization is lower by 10-30%, depending upon the sampling interval value. See "Network observability without Loki" for more information.
- Restricting or excluding interfaces
-
Reduce the overall observed traffic by setting the values for
spec.agent.ebpf.interfacesandspec.agent.ebpf.excludeInterfaces. By default, the agent fetches all the interfaces in the system, except the ones listed inexcludeInterfacesandlo(local interface). Note that the interface names might vary according to the Container Network Interface (CNI) used. - Performance fine-tuning
The following settings can be used to fine-tune performance after the Network Observability has been running for a while:
-
Resource requirements and limits: Adapt the resource requirements and limits to the load and memory usage you expect on your cluster by using the
spec.agent.ebpf.resourcesandspec.processor.resourcesspecifications. The default limits of 800MB might be sufficient for most medium-sized clusters. -
Cache max flows timeout: Control how often flows are reported by the agents by using the eBPF agent’s
spec.agent.ebpf.cacheMaxFlowsandspec.agent.ebpf.cacheActiveTimeoutspecifications. A larger value results in less traffic being generated by the agents, which correlates with a lower CPU load. However, a larger value leads to a slightly higher memory consumption, and might generate more latency in the flow collection.
-
Resource requirements and limits: Adapt the resource requirements and limits to the load and memory usage you expect on your cluster by using the
6.6.1. Resource considerations
The Network Observability Operator configuration can be adjusted based on the cluster workload size. Use the following baseline examples to determine the appropriate resource limits and configuration settings for the environment.
The examples outlined in the table demonstrate scenarios that are tailored to specific workloads. Consider each example only as a baseline from which adjustments can be made to accommodate your workload needs.
The test beds used for these recommendations are:
-
Extra small: 10-node cluster, 4 vCPUs and 16 GiB memory per worker,
LokiStacksize1x.extra-small, tested on AWS M6i instances. -
Small: 25-node cluster, 16 vCPUs and 64 GiB memory per worker,
LokiStacksize1x.small, tested on AWS M6i instances. -
Large: 250-node cluster, 16 vCPUs and 64 GiB memory per worker,
LokiStacksize1x.medium, tested on AWS M6i instances. In addition to the worker and controller nodes, three infrastructure nodes (sizeM6i.12xlarge) and one workload node (sizeM6i.8xlarge) were tested.
| Criterion | Extra small (10 nodes) | Small (25 nodes) | Large (250 nodes) |
|---|---|---|---|
|
Operator memory limit: |
|
|
|
|
eBPF agent sampling interval: |
|
|
|
|
eBPF agent memory limit: |
|
|
|
|
eBPF agent cache size: |
|
|
|
|
Processor memory limit: |
|
|
|
|
Processor replicas: |
|
|
|
|
Deployment model: |
|
|
|
| Kafka partitions: Kafka installation | N/A |
|
|
| Kafka brokers: Kafka installation | N/A |
|
|
6.6.2. Total average memory and CPU usage
The following table outlines averages of total resource usage for clusters with a sampling value of 1 and 50 for two different tests: Test 1 and Test 2. The tests differ in the following ways:
-
Test 1takes into account high ingress traffic volume in addition to the total number of namespace, pods and services in an OpenShift Container Platform cluster, places load on the eBPF agent, and represents use cases with a high number of workloads for a given cluster size. For example,Test 1consists of 76 Namespaces, 5153 Pods, and 2305 Services with a network traffic scale of ~350 MB/s. -
Test 2takes into account high ingress traffic volume in addition to the total number of namespace, pods and services in an OpenShift Container Platform cluster and represents use cases with a high number of workloads for a given cluster size. For example,Test 2consists of 553 Namespaces, 6998 Pods, and 2508 Services with a network traffic scale of ~950 MB/s.
Since different types of cluster use cases are exemplified in the different tests, the numbers in this table do not scale linearly when compared side-by-side. Instead, they are intended to be used as a benchmark for evaluating your personal cluster usage. The examples outlined in the table demonstrate scenarios that are tailored to specific workloads. Consider each example only as a baseline from which adjustments can be made to accommodate your workload needs.
Metrics exported to Prometheus can impact the resource usage. Cardinality values for the metrics can help determine how much resources are impacted. For more information, see "Network Flows format" in the Additional resources section.
| Sampling value | Resources used | Test 1 (25 nodes) | Test 2 (250 nodes) |
|---|---|---|---|
| Sampling = 50 | Total NetObserv CPU Usage | 1.35 | 5.39 |
| Total NetObserv RSS (Memory) Usage | 16 GB | 63 GB | |
| Sampling = 1 | Total NetObserv CPU Usage | 1.82 | 11.99 |
| Total NetObserv RSS (Memory) Usage | 22 GB | 87 GB |
Summary: This table shows average total resource usage of Network Observability, which includes Agents, FLP, Kafka, and Loki with all features enabled. For details about what features are enabled, see the features covered in "Observing the network traffic", which comprises all the features that are enabled for this testing.
Chapter 7. Network observability per-tenant model
Use the FlowCollectorSlice resource to delegate network traffic analysis management to project administrators while maintaining global cluster governance.
7.1. Per-tenant hierarchical governance and tenant autonomy
Cluster administrators can maintain global governance while allowing project administrators to manage network traffic observability within their specific namespaces.
The Network Observability Operator uses a hierarchical configuration model to support multitenancy. This architecture is beneficial for large-scale deployments and hosted control planes environments where individual teams require self-service visibility without cluster administrator intervention.
The hierarchical model consists of the following components:
- Global governance
-
The cluster administrator manages the global
FlowCollectorresource. This resource defines the observability infrastructure and determines if per-tenant configuration is permitted. - Tenant autonomy
-
The project administrator manages the
FlowCollectorSliceresource. This namespace-scoped custom resource (CR) allows teams to define specific observability settings for their workloads.
7.2. FlowCollectorSlice resource for granular flow collection
The FlowCollectorSlice is a custom resource definition (CRD) that enables granular, multi-tenant network flow collection. By defining logical slices based on namespaces or subnets, you can selectively collect traffic and apply custom sampling to specific workloads rather than the entire cluster.
It complements the existing FlowCollector custom resource by enabling granular, selective, and multi-tenant-aware flow collection, instead of a single global configuration that applies uniformly to all traffic.
When slice-based collection is enabled, only traffic that matches at least one FlowCollectorSlice is collected, allowing administrators to precisely control which network flows are observed.
7.2.1. Benefits of FlowCollectorSlice
By default, network flow collection applies uniformly to all traffic in the cluster. This can result in excessive data volume and limited flexibility.
Using FlowCollectorSlice provides the following benefits:
- Enables selective flow collection for specific namespaces or workloads.
- Supports multi-tenant and environment-based observability.
- Reduces storage and processing costs by filtering irrelevant traffic.
- Preserves backward compatibility through opt-in configuration.
7.2.2. Relationship between FlowCollector and FlowCollectorSlice
While the FlowCollector resource defines global flow collection behavior for the cluster, the FlowCollectorSlice resource defines which traffic is eligible for collection when slice-based filtering is enabled.
The FlowCollector.spec.slicesConfig field controls how slice definitions are applied.
7.2.3. Collection modes
Slice behavior is governed by the FlowCollector.spec.slicesConfig.collectionMode field. Set the field to one of the following collection modes:
- AlwaysCollect
- Collects network flows from all cluster namespaces.
-
Applies the subnet and sampling configurations defined in
FlowCollectorSliceresources. -
Ignores the namespace selection logic in
FlowCollectorSliceresources. - Maintains the default collection behavior for backward compatibility.
- AllowList
-
Collects only traffic that matches at least one
FlowCollectorSliceresource. - An optional namespace allow list includes selected namespaces in the collection.
-
Collects only traffic that matches at least one
7.2.4. FlowCollectorSlice status
Each FlowCollectorSlice resource exposes a status subresource that reports:
- Validation results.
- Reconciliation state.
- Whether the slice is successfully applied.
This status allows administrators to verify that slice definitions are active and functioning as expected.
7.3. Enable the Network Observability Operator FlowCollectorSlice
Enabling the FlowCollectorSlice feature in the FlowCollector resource allows cluster administrators to delegate flow collection and data enrichment management to specific namespaces.
Before project administrators can manage their own settings, a cluster administrator must enable the FlowCollector custom resource to watch for the FlowCollectorSlice custom resource.
Prerequisites
- The Network Observability Operator is installed.
-
A
FlowCollectorcustom resource exists in the cluster. -
You have
cluster-adminprivileges.
Procedure
Edit the
FlowCollectorcustom resource by running the following command:$ oc edit flowcollector clusterConfigure the
spec.processor.slicesConfigfield to define which namespaces are permitted to use slices:apiVersion: flows.netobserv.io/v1beta2 kind: FlowCollector metadata: name: cluster spec: processor: slicesConfig: enable: true collectionMode: AllowList namespacesAllowList: - /openshift-.*|netobserv.*/where:
spec.processor.sliceConfig.enable-
Specifies if the
FlowCollectorSlicefeature is enabled. If not, all resources of kindFlowCollectorSliceare ignored. spec.processor.sliceConfig.collectionMode-
Specifies how the
FlowCollectorSlicecustom resources impacts the flow collection process. When set toAlwaysCollect, all flows are collected regardless of the presence ofFlowCollectorSlice. When set toAllowList, only the flows related to namespaces where aFlowCollectorSliceresource is present, or configured via the globalnamespacesAllowList, are collected. spec.processor.sliceConfig.namespacesAllowListSpecifies a list of namespaces for which flows are always collected, regardless of the presence of
FlowCollectorSlicein those namespaces.NoteThe
namespacesAllowListfield supports regular expressions, such as/openshift-.*/to capture multiple namespaces, or strict equality, such asnetobserv, to match a specific namespace.
- Save the changes and exit the editor.
Verification
-
Verify that only network flows from the
netobservnamespace and namespaces starting withopenshift-are displayed in the Network Traffic page of the web console.
7.3.1. Disable the Network Observability Operator FlowCollectorSlice
Disable slice-based filtering in the Network Observability Operator to resume global flow collection while preserving existing FlowCollectorSlice resources.
Procedure
Edit the
FlowCollectorresource by running the following command:$ oc edit flowcollector clusterSet the
spec.processor.slicesConfig.collectionModefield toAlwaysCollect:apiVersion: flows.netobserv.io/v1beta2 kind: FlowCollector metadata: name: cluster spec: processor: slicesConfig: enable: true collectionMode: AlwaysCollect ...Save the changes.
Flow collection resumes for all traffic, and existing
FlowCollectorSliceresources remain available for future use.
7.4. Configure the FlowCollectorSlice as a project administrator
Project administrators can manage flow collection and data enrichment within their own namespaces by configuring a FlowCollectorSlice custom resource for decentralized network traffic analysis.
Prerequisites
- The Network Observability Operator is installed.
-
You have
project-adminpermissions for the namespace.
Procedure
Create a YAML file named
flowCollectorSlice.yaml:apiVersion: flows.netobserv.io/v1alpha1 kind: FlowCollectorSlice metadata: name: flowcollectorslice-sample namespace: my-app spec: sampling: 1 subnetLabels: - name: EXT:Database cidrs: - 192.168.50.0/24Apply the configuration by running the following command:
$ oc apply -f flowCollectorSlice.yaml
Verification
- In the OpenShift Container Platform console, navigate to Observe → Network Traffic.
-
Ensure flows to
192.168.50.0/24subnet are observed with theEXT:Databaselabel.
7.5. FlowCollectorSlice [flows.netobserv.io/v1alpha1]
- Description
- FlowCollectorSlice is the API allowing to decentralize some of the FlowCollector configuration per namespace tenant.
- Type
-
object
| Property | Type | Description |
|---|---|---|
|
|
| APIVersion defines the versioned schema of this representation of an object. Servers should convert recognized schemas to the latest internal value, and might reject unrecognized values. More info: https://git.k8s.io/community/contributors/devel/sig-architecture/api-conventions.md#resources |
|
|
| Kind is a string value representing the REST resource this object represents. Servers might infer this from the endpoint the client submits requests to. Cannot be updated. In CamelCase. More info: https://git.k8s.io/community/contributors/devel/sig-architecture/api-conventions.md#types-kinds |
|
|
| Standard object’s metadata. More info: https://git.k8s.io/community/contributors/devel/sig-architecture/api-conventions.md#metadata |
|
|
| FlowCollectorSliceSpec defines the desired state of FlowCollectorSlice |
7.5.1. .metadata
- Description
- Standard object’s metadata. More info: https://git.k8s.io/community/contributors/devel/sig-architecture/api-conventions.md#metadata
- Type
-
object
7.5.2. .spec
- Description
- FlowCollectorSliceSpec defines the desired state of FlowCollectorSlice
- Type
-
object
| Property | Type | Description |
|---|---|---|
|
|
|
|
|
|
|
Beware that the subnet labels configured in FlowCollectorSlice are not limited to the flows of the related namespace: any flow in the whole cluster can be labeled using this configuration. However, subnet labels defined in the cluster-scoped FlowCollector take precedence in case of conflicting rules. |
7.5.3. .spec.subnetLabels
- Description
subnetLabelsallows you to customize subnets and IPs labeling, such as to identify cluster external workloads or web services. External subnets must be labeled with the prefixEXT:, or not labeled at all, in order to work with default quick filters and some metrics examples provided.
Beware that the subnet labels configured in FlowCollectorSlice are not limited to the flows of the related namespace: any flow in the whole cluster can be labeled using this configuration. However, subnet labels defined in the cluster-scoped FlowCollector take precedence in case of conflicting rules.
- Type
-
array
7.5.4. .spec.subnetLabels[]
- Description
- SubnetLabel allows to label subnets and IPs, such as to identify cluster-external workloads or web services.
- Type
-
object - Required
-
cidrs -
name
-
| Property | Type | Description |
|---|---|---|
|
|
|
List of CIDRs, such as |
|
|
|
Label name, used to flag matching flows. External subnets must be labeled with the prefix |
Chapter 8. Network Policy
As an administrator, you can create a network policy for the netobserv namespace. This policy secures inbound and outbound access to the Network Observability Operator.
8.1. Configuring network policy by using the FlowCollector custom resource
You can set up ingress and egress network policies to control pod traffic. This enhances security and collects only the network flow data you need. This reduces noise, supports compliance, and improves visibility into network communication.
You can configure the FlowCollector custom resource (CR) to deploy an egress and ingress network policy for network observability. By default, the spec.NetworkPolicy.enable specification is set to true.
If you have installed Loki, Kafka or any exporter in a different namespace that also has a network policy, you must ensure that the network observability components can communicate with them. Consider the following about your setup:
-
Connection to Loki (as defined in the
FlowCollectorCRspec.lokiparameter) -
Connection to Kafka (as defined in the
FlowCollectorCRspec.kafkaparameter) -
Connection to any exporter (as defined in FlowCollector CR
spec.exportersparameter) -
If you are using Loki and including it in the policy target, connection to an external object storage (as defined in your
LokiStackrelated secret)
Procedure
- . In the web console, go to Operators → Installed Operators page.
- Under the Provided APIs heading for Network Observability, select Flow Collector.
- Select cluster then select the YAML tab.
Configure the
FlowCollectorCR. A sample configuration is as follows:Example
FlowCollectorCR for network policyapiVersion: flows.netobserv.io/v1beta2 kind: FlowCollector metadata: name: cluster spec: namespace: netobserv networkPolicy: enable: true1 additionalNamespaces: ["openshift-console", "openshift-monitoring"]2 # ...
Chapter 9. Network observability DNS resolution analysis
Learn how DNS resolution analysis uses eBPF-based decoding to identify service discovery issues and follow the steps to enable DNS tracking in the FlowCollector resource to enrich network flow records with domain names.
9.1. Strategic benefits of DNS resolution analysis
Use DNS resolution analysis to differentiate between network transport failures and service discovery issues by enriching eBPF flow records with domain names and status codes.
Standard flow logs only show that traffic occurred on port 53. DNS resolution analysis allows you to complete the following tasks:
-
Reduced Mean time to identify (Mtti): Distinguish immediately between a network routing failure and a DNS resolution failure, such as an
NXDOMAINerror. -
Measure internal service latency: Track the time it takes for CoreDNS to respond to specific internal lookups (e.g.,
my-service.namespace.svc.cluster.local). - Audit external dependencies: Audit which external APIs or third-party domains your workloads are communicating with without requiring sidecars or manual packet captures.
- Improved security posture: Detect potential data exfiltration or Command and Control (C2) activity by auditing the Fully Qualified Domain Names (FQDNs) queried by internal workloads.
9.1.1. DNS flow enrichment
When this feature is active, the eBPF agent enriches the flow records. This metadata allows you to group and filter traffic by the intent of the connection (the domain) rather than just the source IP.
Enhanced DNS decoding allows the eBPF agent to inspect UDP and TCP DNS traffic on port 53 along with the query names for the DNS request.
9.2. Configure DNS domain tracking for network observability
Enable DNS tracking in the Network Observability Operator to monitor DNS query names, response codes, and latency for network flows within the cluster.
Prerequisites
- The Network Observability Operator is installed.
-
You have
cluster-adminprivileges. -
You are familiar with the
FlowCollectorcustom resource.
Procedure
Edit the
FlowCollectorresource by running the following command:$ oc edit flowcollector clusterConfigure the eBPF agent to enable the DNS tracking feature:
apiVersion: flows.netobserv.io/v1alpha1 kind: FlowCollector metadata: name: cluster spec: agent: type: eBPF ebpf: features: - DNSTrackingwhere:
spec.agent.type.ebpf.features-
Specifies the list of features to enable for the eBPF agent. To enable DNS tracking, add
DNSTrackingto this list.
- Save and exit the editor.
Verification
- In the OpenShift Container Platform web console, navigate to Observe → Network Traffic.
- In the Traffic Flows view, click the Manage columns icon.
- Ensure that the DNS Query Name, DNS Response Code, and DNS Latency columns are selected.
-
Filter the results by setting Port to
53. - Confirm that the flow table columns are populated with domain names and DNS metadata.
9.3. DNS flow enrichment and analysis reference
Identify metadata added to network flows, leverage DNS data for network optimization, and understand the performance and storage impacts on the cluster.
The following table describes the metadata fields added to network flows when DNS tracking is enabled.
Query names might be missing or truncated because of compression pointers or cache limitations.
| Field | Description | Example |
|---|---|---|
|
| The Fully Qualified Domain Name (FQDN) being queried. |
|
|
| The status code returned by the DNS server. |
|
|
| The transaction ID used to match queries with responses. |
|
9.3.1. Leverage DNS data for network optimization
Use the captured DNS metadata for the following operational outcomes:
- Audit external dependencies: Ensure workloads are not reaching out to unauthorized external APIs or high-risk domains.
-
Performance tuning: Monitor
DNS Latencyto identify ifCoreDNSpods require additional scaling or if upstream DNS providers are lagging.
9.3.2. Identify misconfiguration errors
A high frequency of NXDOMAIN responses typically indicates service discovery errors in application code or stale environment variables.
NXDOMAIN errors can be frequent in Kubernetes because of DNS searches on services and pods. While these results do not necessarily indicate a misconfiguration or broken URL, they can negatively impact performance.
When NXDOMAIN errors are returned despite an apparently valid Service or Pod host name, such as my-svc.my-namespace.svc, the resolver is likely configured to query DNS for different suffixes. You can optimize this by adding a trailing dot to fully qualified domain names to tell the resolver that the name is unambiguous.
For example, instead of https://my-svc.my-namespace.svc, use https://my-svc.my-namespace.svc.cluster.local. with a trailing dot.
9.3.3. Loki storage considerations
DNS tracking increases the number of labels and the amount of metadata per flow. Ensure that the Loki storage is sized to accommodate the increased log volume.
Chapter 10. Observing the network traffic
As an administrator, you can observe the network traffic in the OpenShift Container Platform web console for detailed troubleshooting and analysis. This feature helps you get insights from different graphical representations of traffic flow.
10.1. Observing the network traffic from the Overview view
The Overview view displays the overall aggregated metrics of the network traffic flow on the cluster. As an administrator, you can monitor the statistics with the available display options.
10.1.1. Working with the Overview view
As an administrator, you can navigate to the Overview view to see the graphical representation of the flow rate statistics.
Procedure
- Navigate to Observe → Network Traffic.
- In the Network Traffic page, click the Overview tab.
You can configure the scope of each flow rate data by clicking the menu icon.
10.1.2. Configuring advanced options for the Overview view
You can customize the graphical view by using advanced options. To access the advanced options, click Show advanced options. You can configure the details in the graph by using the Display options drop-down menu. The options available are as follows:
- Scope: Select to view the components that network traffic flows between. You can set the scope to Node, Namespace, Owner, Zones, Cluster or Resource. Owner is an aggregation of resources. Resource can be a pod, service, node, in case of host-network traffic, or an unknown IP address. The default value is Namespace.
- Truncate labels: Select the required width of the label from the drop-down list. The default value is M.
10.1.2.1. Managing panels and display
You can select the required panels to be displayed, reorder them, and focus on a specific panel. To add or remove panels, click Manage panels.
The following panels are shown by default:
- Top X average bytes rates
- Top X bytes rates stacked with total
Other panels can be added in Manage panels:
- Top X average packets rates
- Top X packets rates stacked with total
Query options allows you to choose whether to show the Top 5, Top 10, or Top 15 rates.
10.1.3. Packet drop tracking
You can configure graphical representation of network flow records with packet loss in the Overview view. By employing eBPF tracepoint hooks, you can gain valuable insights into packet drops for TCP, UDP, SCTP, ICMPv4, and ICMPv6 protocols, which can result in the following actions:
- Identification: Pinpoint the exact locations and network paths where packet drops are occurring. Determine whether specific devices, interfaces, or routes are more prone to drops.
- Root cause analysis: Examine the data collected by the eBPF program to understand the causes of packet drops. For example, are they a result of congestion, buffer issues, or specific network events?
- Performance optimization: With a clearer picture of packet drops, you can take steps to optimize network performance, such as adjust buffer sizes, reconfigure routing paths, or implement Quality of Service (QoS) measures.
When packet drop tracking is enabled, you can see the following panels in the Overview by default:
- Top X packet dropped state stacked with total
- Top X packet dropped cause stacked with total
- Top X average dropped packets rates
- Top X dropped packets rates stacked with total
Other packet drop panels are available to add in Manage panels:
- Top X average dropped bytes rates
- Top X dropped bytes rates stacked with total
10.1.3.1. Types of packet drops
Two kinds of packet drops are detected by Network Observability: host drops and OVS drops. Host drops are prefixed with SKB_DROP and OVS drops are prefixed with OVS_DROP. Dropped flows are shown in the side panel of the Traffic flows table along with a link to a description of each drop type. Examples of host drop reasons are as follows:
-
SKB_DROP_REASON_NO_SOCKET: the packet dropped due to a missing socket. -
SKB_DROP_REASON_TCP_CSUM: the packet dropped due to a TCP checksum error.
Examples of OVS drops reasons are as follows:
-
OVS_DROP_LAST_ACTION: OVS packets dropped due to an implicit drop action, for example due to a configured network policy. -
OVS_DROP_IP_TTL: OVS packets dropped due to an expired IP TTL.
See the Additional resources of this section for more information about enabling and working with packet drop tracking.
10.1.4. DNS tracking
You can configure graphical representation of Domain Name System (DNS) tracking of network flows in the Overview view. Using DNS tracking with extended Berkeley Packet Filter (eBPF) tracepoint hooks can serve various purposes:
- Network Monitoring: Gain insights into DNS queries and responses, helping network administrators identify unusual patterns, potential bottlenecks, or performance issues.
- Security Analysis: Detect suspicious DNS activities, such as domain name generation algorithms (DGA) used by malware, or identify unauthorized DNS resolutions that might indicate a security breach.
- Troubleshooting: Debug DNS-related issues by tracing DNS resolution steps, tracking latency, and identifying misconfigurations.
By default, when DNS tracking is enabled, you can see the following non-empty metrics represented in a donut or line chart in the Overview:
- Top X DNS Response Code
- Top X average DNS latencies with overall
- Top X 90th percentile DNS latencies
Other DNS tracking panels can be added in Manage panels:
- Bottom X minimum DNS latencies
- Top X maximum DNS latencies
- Top X 99th percentile DNS latencies
This feature is supported for IPv4 and IPv6 UDP and TCP protocols.
See the Additional resources in this section for more information about enabling and working with this view.
10.1.5. Round-Trip Time
You can use TCP smoothed Round-Trip Time (sRTT) to analyze network flow latencies. You can use RTT captured from the fentry/tcp_rcv_established eBPF hookpoint to read sRTT from the TCP socket to help with the following:
- Network Monitoring: Gain insights into TCP latencies, helping network administrators identify unusual patterns, potential bottlenecks, or performance issues.
- Troubleshooting: Debug TCP-related issues by tracking latency and identifying misconfigurations.
By default, when RTT is enabled, you can see the following TCP RTT metrics represented in the Overview:
- Top X 90th percentile TCP Round Trip Time with overall
- Top X average TCP Round Trip Time with overall
- Bottom X minimum TCP Round Trip Time with overall
Other RTT panels can be added in Manage panels:
- Top X maximum TCP Round Trip Time with overall
- Top X 99th percentile TCP Round Trip Time with overall
See the Additional resources in this section for more information about enabling and working with this view.
10.1.6. eBPF flow rule filter
You can use rule-based filtering to control the volume of packets cached in the eBPF flow table. For example, a filter can specify that only packets coming from port 100 should be recorded. Then only the packets that match the filter are cached and the rest are not cached.
You can apply multiple filter rules.
10.1.6.1. Ingress and egress traffic filtering
CIDR notation efficiently represents IP address ranges by combining the base IP address with a prefix length. For both ingress and egress traffic, the source IP address is first used to match filter rules configured with CIDR notation. If there is a match, then the filtering proceeds. If there is no match, then the destination IP is used to match filter rules configured with CIDR notation.
After matching either the source IP or the destination IP CIDR, you can pinpoint specific endpoints using the peerIP to differentiate the destination IP address of the packet. Based on the provisioned action, the flow data is either cached in the eBPF flow table or not cached.
10.1.6.2. Dashboard and metrics integrations
When this option is enabled, the Netobserv/Health dashboard for eBPF agent statistics now has the Filtered flows rate view. Additionally, in Observe → Metrics you can query netobserv_agent_filtered_flows_total to observe metrics with the reason in FlowFilterAcceptCounter, FlowFilterNoMatchCounter or FlowFilterRecjectCounter.
10.1.6.3. Flow filter configuration parameters
The flow filter rules consist of required and optional parameters.
| Parameter | Description |
|---|---|
|
|
Set |
|
|
Provides the IP address and CIDR mask for the flow filter rule. Supports both IPv4 and IPv6 address format. If you want to match against any IP, you can use |
|
|
Describes the action that is taken for the flow filter rule. The possible values are
|
| Parameter | Description |
|---|---|
|
|
Defines the direction of the flow filter rule. Possible values are |
|
|
Defines the protocol of the flow filter rule. Possible values are |
|
|
Defines the TCP flags to filter flows. Possible values are |
|
|
Defines the ports to use for filtering flows. It can be used for either source or destination ports. To filter a single port, set a single port as an integer value. For example |
|
|
Defines the source port to use for filtering flows. To filter a single port, set a single port as an integer value, for example |
|
|
DestPorts defines the destination ports to use for filtering flows. To filter a single port, set a single port as an integer value, for example |
|
| Defines the ICMP type to use for filtering flows. |
|
| Defines the ICMP code to use for filtering flows. |
|
|
Defines the IP address to use for filtering flows, for example: |
10.2. Observing the network traffic from the Traffic flows view
The Traffic flows view displays the data of the network flows and the amount of traffic in a table. As an administrator, you can monitor the amount of traffic across the application by using the traffic flow table.
10.2.1. Working with the Traffic flows view
As an administrator, you can navigate to Traffic flows table to see network flow information.
Procedure
- Navigate to Observe → Network Traffic.
- In the Network Traffic page, click the Traffic flows tab.
You can click on each row to get the corresponding flow information.
10.2.2. Configuring advanced options for the Traffic flows view
You can customize and export the view by using Show advanced options. You can set the row size by using the Display options drop-down menu. The default value is Normal.
10.2.2.1. Managing columns
You can select the required columns to be displayed, and reorder them. To manage columns, click Manage columns.
10.2.2.2. Exporting the traffic flow data
You can export data from the Traffic flows view.
Procedure
- Click Export data.
- In the pop-up window, you can select the Export all data checkbox to export all the data, and clear the checkbox to select the required fields to be exported.
- Click Export.
10.2.3. Working with conversation tracking
As an administrator, you can group network flows that are part of the same conversation. A conversation is defined as a grouping of peers that are identified by their IP addresses, ports, and protocols, resulting in an unique Conversation Id. You can query conversation events in the web console. These events are represented in the web console as follows:
- Conversation start: This event happens when a connection is starting or TCP flag intercepted
-
Conversation tick: This event happens at each specified interval defined in the
FlowCollectorspec.processor.conversationHeartbeatIntervalparameter while the connection is active. -
Conversation end: This event happens when the
FlowCollectorspec.processor.conversationEndTimeoutparameter is reached or the TCP flag is intercepted. - Flow: This is the network traffic flow that occurs within the specified interval.
Procedure
- In the web console, navigate to Operators → Installed Operators.
- Under the Provided APIs heading for the NetObserv Operator, select Flow Collector.
- Select cluster then select the YAML tab.
Configure the
FlowCollectorcustom resource so thatspec.processor.logTypes,conversationEndTimeout, andconversationHeartbeatIntervalparameters are set according to your observation needs. A sample configuration is as follows:Configure
FlowCollectorfor conversation trackingapiVersion: flows.netobserv.io/v1beta2 kind: FlowCollector metadata: name: cluster spec: processor: logTypes: Flows1 advanced: conversationEndTimeout: 10s2 conversationHeartbeatInterval: 30s3 - 1
- When
logTypesis set toFlows, only the Flow event is exported. If you set the value toAll, both conversation and flow events are exported and visible in the Network Traffic page. To focus only on conversation events, you can specifyConversationswhich exports the Conversation start, Conversation tick and Conversation end events; orEndedConversationsexports only the Conversation end events. Storage requirements are highest forAlland lowest forEndedConversations. - 2
- The Conversation end event represents the point when the
conversationEndTimeoutis reached or the TCP flag is intercepted. - 3
- The Conversation tick event represents each specified interval defined in the
FlowCollectorconversationHeartbeatIntervalparameter while the network connection is active.
NoteIf you update the
logTypeoption, the flows from the previous selection do not clear from the console plugin. For example, if you initially setlogTypetoConversationsfor a span of time until 10 AM and then move toEndedConversations, the console plugin shows all conversation events before 10 AM and only ended conversations after 10 AM.-
Refresh the Network Traffic page on the Traffic flows tab. Notice there are two new columns, Event/Type and Conversation Id. All the Event/Type fields are
Flowwhen Flow is the selected query option. - Select Query Options and choose the Log Type, Conversation. Now the Event/Type shows all of the desired conversation events.
- Next you can filter on a specific conversation ID or switch between the Conversation and Flow log type options from the side panel.
10.2.4. Working with packet drops
Packet loss occurs when one or more packets of network flow data fail to reach their destination. You can track these drops by editing the FlowCollector to the specifications in the following YAML example.
CPU and memory usage increases when this feature is enabled.
Procedure
- In the web console, navigate to Operators → Installed Operators.
- Under the Provided APIs heading for the NetObserv Operator, select Flow Collector.
- Select cluster, and then select the YAML tab.
Configure the
FlowCollectorcustom resource for packet drops, for example:Example
FlowCollectorconfigurationapiVersion: flows.netobserv.io/v1beta2 kind: FlowCollector metadata: name: cluster spec: namespace: netobserv agent: type: eBPF ebpf: features: - PacketDrop1 privileged: true2
Verification
When you refresh the Network Traffic page, the Overview, Traffic Flow, and Topology views display new information about packet drops:
- Select new choices in Manage panels to choose which graphical visualizations of packet drops to display in the Overview.
Select new choices in Manage columns to choose which packet drop information to display in the Traffic flows table.
-
In the Traffic Flows view, you can also expand the side panel to view more information about packet drops. Host drops are prefixed with
SKB_DROPand OVS drops are prefixed withOVS_DROP.
-
In the Traffic Flows view, you can also expand the side panel to view more information about packet drops. Host drops are prefixed with
- In the Topology view, red lines are displayed where drops are present.
10.2.5. Working with DNS tracking
Using DNS tracking, you can monitor your network, conduct security analysis, and troubleshoot DNS issues. You can track DNS by editing the FlowCollector to the specifications in the following YAML example.
CPU and memory usage increases are observed in the eBPF agent when this feature is enabled.
Procedure
- In the web console, navigate to Operators → Installed Operators.
- Under the Provided APIs heading for Network Observability, select Flow Collector.
- Select cluster then select the YAML tab.
Configure the
FlowCollectorcustom resource. A sample configuration is as follows:Configure
FlowCollectorfor DNS trackingapiVersion: flows.netobserv.io/v1beta2 kind: FlowCollector metadata: name: cluster spec: namespace: netobserv agent: type: eBPF ebpf: features: - DNSTracking1 sampling: 12 - 1
- You can set the
spec.agent.ebpf.featuresparameter list to enable DNS tracking of each network flow in the web console. - 2
- You can set
samplingto a value of1for more accurate metrics and to capture DNS latency. For asamplingvalue greater than 1, you can observe flows with DNS Response Code and DNS Id, and it is unlikely that DNS Latency can be observed.
When you refresh the Network Traffic page, there are new DNS representations you can choose to view in the Overview and Traffic Flow views and new filters you can apply.
- Select new DNS choices in Manage panels to display graphical visualizations and DNS metrics in the Overview.
- Select new choices in Manage columns to add DNS columns to the Traffic Flows view.
- Filter on specific DNS metrics, such as DNS Id, DNS Error DNS Latency and DNS Response Code, and see more information from the side panel. The DNS Latency and DNS Response Code columns are shown by default.
TCP handshake packets do not have DNS headers. TCP protocol flows without DNS headers are shown in the traffic flow data with DNS Latency, ID, and Response code values of "n/a". You can filter out flow data to view only flows that have DNS headers using the Common filter "DNSError" equal to "0".
10.2.6. Working with RTT tracing
You can track RTT by editing the FlowCollector to the specifications in the following YAML example.
Procedure
- In the web console, navigate to Operators → Installed Operators.
- In the Provided APIs heading for the NetObserv Operator, select Flow Collector.
- Select cluster, and then select the YAML tab.
Configure the
FlowCollectorcustom resource for RTT tracing, for example:Example
FlowCollectorconfigurationapiVersion: flows.netobserv.io/v1beta2 kind: FlowCollector metadata: name: cluster spec: namespace: netobserv agent: type: eBPF ebpf: features: - FlowRTT1 - 1
- You can start tracing RTT network flows by listing the
FlowRTTparameter in thespec.agent.ebpf.featuresspecification list.
Verification
When you refresh the Network Traffic page, the Overview, Traffic Flow, and Topology views display new information about RTT:
- In the Overview, select new choices in Manage panels to choose which graphical visualizations of RTT to display.
- In the Traffic flows table, the Flow RTT column can be seen, and you can manage display in Manage columns.
In the Traffic Flows view, you can also expand the side panel to view more information about RTT.
Example filtering
- Click the Common filters → Protocol.
- Filter the network flow data based on TCP, Ingress direction, and look for FlowRTT values greater than 10,000,000 nanoseconds (10ms).
- Remove the Protocol filter.
- Filter for Flow RTT values greater than 0 in the Common filters.
- In the Topology view, click the Display option dropdown. Then click RTT in the edge labels drop-down list.
10.2.6.1. Using the histogram
You can click Show histogram to display a toolbar view for visualizing the history of flows as a bar chart. The histogram shows the number of logs over time. You can select a part of the histogram to filter the network flow data in the table that follows the toolbar.
10.2.7. Working with availability zones
You can configure the FlowCollector to collect information about the cluster availability zones. This allows you to enrich network flow data with the topology.kubernetes.io/zone label value applied to the nodes.
Procedure
- In the web console, go to Operators → Installed Operators.
- Under the Provided APIs heading for the NetObserv Operator, select Flow Collector.
- Select cluster then select the YAML tab.
Configure the
FlowCollectorcustom resource so that thespec.processor.addZoneparameter is set totrue. A sample configuration is as follows:Configure
FlowCollectorfor availability zones collectionapiVersion: flows.netobserv.io/v1beta2 kind: FlowCollector metadata: name: cluster spec: # ... processor: addZone: true # ...
Verification
When you refresh the Network Traffic page, the Overview, Traffic Flow, and Topology views display new information about availability zones:
- In the Overview tab, you can see Zones as an available Scope.
- In Network Traffic → Traffic flows, Zones are viewable under the SrcK8S_Zone and DstK8S_Zone fields.
- In the Topology view, you can set Zones as Scope or Group.
10.2.8. Filtering eBPF flow data using multiple rules
You can configure the FlowCollector custom resource to filter eBPF flows using multiple rules to control the flow of packets cached in the eBPF flow table.
- You cannot use duplicate Classless Inter-Domain Routing (CIDRs) in filter rules.
- When an IP address matches multiple filter rules, the rule with the most specific CIDR prefix (longest prefix) takes precedence.
Procedure
- In the web console, navigate to Ecosystem → Installed Operators.
- Under the Provided APIs heading for Network Observability, select Flow Collector.
- Select cluster, then select the YAML tab.
-
Configure the
FlowCollectorcustom resource, similar to the following sample configurations:
Example YAML to sample all North-South traffic, and 1:50 East-West traffic
By default, all other flows are rejected.
apiVersion: flows.netobserv.io/v1beta2
kind: FlowCollector
metadata:
name: cluster
spec:
namespace: netobserv
deploymentModel: Direct
agent:
type: eBPF
ebpf:
flowFilter:
enable: true
rules:
- action: Accept
cidr: 0.0.0.0/0
sampling: 1
- action: Accept
cidr: 10.128.0.0/14
peerCIDR: 10.128.0.0/14
- action: Accept
cidr: 172.30.0.0/16
peerCIDR: 10.128.0.0/14
sampling: 50- 1
- To enable eBPF flow filtering, set
spec.agent.ebpf.flowFilter.enabletotrue. - 2
- To define the action for the flow filter rule, set the required
actionparameter. Valid values areAcceptorReject. - 3
- To define the IP address and CIDR mask for the flow filter rule, set the required
cidrparameter. This parameter supports both IPv4 and IPv6 address formats. To match any IP address, use0.0.0.0/0for IPv4 or`::/0for IPv6. - 4
- To define the sampling interval for matched flows and override the global sampling setting
spec.agent.ebpf.sampling, set thesamplingparameter. - 5
- To filter flows by Peer IP CIDR, set the
peerCIDRparameter.
Example YAML to filter flows with packet drops
By default, all other flows are rejected.
apiVersion: flows.netobserv.io/v1beta2
kind: FlowCollector
metadata:
name: cluster
spec:
namespace: netobserv
deploymentModel: Direct
agent:
type: eBPF
ebpf:
privileged: true
features:
- PacketDrop
flowFilter:
enable: true
rules:
- action: Accept
cidr: 172.30.0.0/16
pktDrops: true - 1
- To enable packet drops, set
spec.agent.ebpf.privilegedtotrue. - 2
- To report packet drops for each network flow, add the
PacketDropvalue to thespec.agent.ebpf.featureslist. - 3
- To enable eBPF flow filtering, set
spec.agent.ebpf.flowFilter.enabletotrue. - 4
- To define the action for the flow filter rule, set the required
actionparameter. Valid values areAcceptorReject. - 5
- To filter flows containing drops, set
pktDropstotrue.
10.2.9. Endpoint translation (xlat)
You can gain visibility into the endpoints serving traffic in a consolidated view using network observability and extended Berkeley Packet Filter (eBPF). Typically, when traffic flows through a service, egressIP, or load balancer, the traffic flow information is abstracted as it is routed to one of the available pods. If you try to get information about the traffic, you can only view service related info, such as service IP and port, and not information about the specific pod that is serving the request. Often the information for both the service traffic and the virtual service endpoint is captured as two separate flows, which complicates troubleshooting.
To solve this, endpoint xlat can help in the following ways:
- Capture the network flows at the kernel level, which has a minimal impact on performance.
- Enrich the network flows with translated endpoint information, showing not only the service but also the specific backend pod, so you can see which pod served a request.
As network packets are processed, the eBPF hook enriches flow logs with metadata about the translated endpoint that includes the following pieces of information that you can view in the Network Traffic page in a single row:
- Source Pod IP
- Source Port
- Destination Pod IP
- Destination Port
- Conntrack Zone ID
10.2.10. Working with endpoint translation (xlat)
You can use network observability and eBPF to enrich network flows from a Kubernetes service with translated endpoint information, gaining insight into the endpoints serving traffic.
Procedure
- In the web console, navigate to Operators → Installed Operators.
- In the Provided APIs heading for the NetObserv Operator, select Flow Collector.
- Select cluster, and then select the YAML tab.
Configure the
FlowCollectorcustom resource forPacketTranslation, for example:Example
FlowCollectorconfigurationapiVersion: flows.netobserv.io/v1beta2 kind: FlowCollector metadata: name: cluster spec: namespace: netobserv agent: type: eBPF ebpf: features: - PacketTranslation1 - 1
- You can start enriching network flows with translated packet information by listing the
PacketTranslationparameter in thespec.agent.ebpf.featuresspecification list.
Example filtering
When you refresh the Network Traffic page you can filter for information about translated packets:
- Filter the network flow data based on Destination kind: Service.
You can see the xlat column, which distinguishes where translated information is displayed, and the following default columns:
- Xlat Zone ID
- Xlat Src Kubernetes Object
- Xlat Dst Kubernetes Object
You can manage the display of additional xlat columns in Manage columns.
10.3. Observing the network traffic from the Topology view
The Topology view provides a graphical representation of the network flows and the amount of traffic. As an administrator, you can monitor the traffic data across the application by using the Topology view.
10.3.1. Working with the Topology view
As an administrator, you can navigate to the Topology view to see the details and metrics of the component.
Procedure
- Navigate to Observe → Network Traffic.
- In the Network Traffic page, click the Topology tab.
You can click each component in the Topology to view the details and metrics of the component.
10.3.2. Configuring the advanced options for the Topology view
You can customize and export the view by using Show advanced options. The advanced options view has the following features:
- Find in view: To search the required components in the view.
Display options: To configure the following options:
- Edge labels: To show the specified measurements as edge labels. The default is to show the Average rate in Bytes.
- Scope: To select the scope of components between which the network traffic flows. The default value is Namespace.
- Groups: To enhance the understanding of ownership by grouping the components. The default value is None.
- Layout: To select the layout of the graphical representation. The default value is ColaNoForce.
- Show: To select the details that need to be displayed. All the options are checked by default. The options available are: Edges, Edges label, and Badges.
- Truncate labels: To select the required width of the label from the drop-down list. The default value is M.
- Collapse groups: To expand or collapse the groups. The groups are expanded by default. This option is disabled if Groups has the value of None.
10.3.2.1. Exporting the topology view
To export the view, click Export topology view. The view is downloaded in PNG format.
10.4. Filtering the network traffic
By default, the Network Traffic page displays the traffic flow data in the cluster based on the default filters configured in the FlowCollector instance. You can use the filter options to observe the required data by changing the preset filter.
Alternatively, you can access the traffic flow data in the Network Traffic tab of the Namespaces, Services, Routes, Nodes, and Workloads pages which provide the filtered data of the corresponding aggregations.
- Query Options
You can use Query Options to optimize the search results, as listed below:
- Log Type: The available options Conversation and Flows provide the ability to query flows by log type, such as flow log, new conversation, completed conversation, and a heartbeat, which is a periodic record with updates for long conversations. A conversation is an aggregation of flows between the same peers.
- Match filters: You can determine the relation between different filter parameters selected in the advanced filter. The available options are Match all and Match any. Match all provides results that match all the values, and Match any provides results that match any of the values entered. The default value is Match all.
- Datasource: You can choose the datasource to use for queries: Loki, Prometheus, or Auto. Notable performance improvements can be realized when using Prometheus as a datasource rather than Loki, but Prometheus supports a limited set of filters and aggregations. The default datasource is Auto, which uses Prometheus on supported queries or uses Loki if the query does not support Prometheus.
Drops filter: You can view different levels of dropped packets with the following query options:
- Fully dropped shows flow records with fully dropped packets.
- Containing drops shows flow records that contain drops but can be sent.
- Without drops shows records that contain sent packets.
- All shows all the aforementioned records.
- Limit: The data limit for internal backend queries. Depending upon the matching and the filter settings, the number of traffic flow data is displayed within the specified limit.
- Quick filters
-
The default values in Quick filters drop-down menu are defined in the
FlowCollectorconfiguration. You can modify the options from console. - Advanced filters
- You can set the advanced filters, Common, Source, or Destination, by selecting the parameter to be filtered from the dropdown list. The flow data is filtered based on the selection. To enable or disable the applied filter, you can click on the applied filter listed below the filter options.
You can toggle between
![]() One way and
One way and
![]()
![]() Back and forth filtering. The
Back and forth filtering. The
![]() One way filter shows only Source and Destination traffic according to your filter selections. You can use Swap to change the directional view of the Source and Destination traffic. The
One way filter shows only Source and Destination traffic according to your filter selections. You can use Swap to change the directional view of the Source and Destination traffic. The
![]()
![]() Back and forth filter includes return traffic with the Source and Destination filters. The directional flow of network traffic is shown in the Direction column in the Traffic flows table as
Back and forth filter includes return traffic with the Source and Destination filters. The directional flow of network traffic is shown in the Direction column in the Traffic flows table as Ingress`or `Egress for inter-node traffic and `Inner`for traffic inside a single node.
You can click Reset defaults to remove the existing filters, and apply the filter defined in FlowCollector configuration.
To understand the rules of specifying the text value, click Learn More.
Chapter 11. Network observability health rules
The Network Observability Operator provides alerts by using built-in metrics and the OpenShift Container Platform monitoring stack to report cluster network health.
Network observability health alerts require OpenShift Container Platform 4.16 or later.
11.1. Network observability rules for health and performance
Network observability includes a system for managing Prometheus-based rules. Use these rules to monitor the health and performance of OpenShift Container Platform applications and infrastructure.
The Network Observability Operator converts these rules into a PrometheusRule resource. The Network Observability Operator supports the following rule types:
-
Alerting rules: Specifies rules managed by the Prometheus
AlertManagerto provide notification of network anomalies or infrastructure failures. - Recording rules: Specifies pre-compute complex Prometheus Query Language (PromQL) expressions into new time series to improve dashboard performance and visualization.
View the PrometheusRule resource in the netobserv namespace by running the following command:
$ oc get prometheusrules -n netobserv -o yaml11.1.1. Network health monitoring and alerting rules
The Network Observability Operator includes a rule-based system to detect network anomalies and infrastructure failures. By converting configurations into alerting rules, the Operator enables automated monitoring and troubleshooting through the OpenShift Container Platform web console.
11.1.1.1. Monitoring outcomes
The Network Observability Operator surfaces network status in the following areas:
- Alerting UI
-
Specific alerts appear in Observe → Alerting, where notifications are managed through the Prometheus
AlertManager. - Network Health dashboard
- A specialized dashboard in Observe → Network Health provides a high-level summary of cluster network status.
The Network Health dashboard categorizes violations into tabs to isolate the scope of an issue:
- Global: Aggregate health of the entire cluster.
- Nodes: Violations specific to infrastructure nodes.
- Namespaces: Violations specific to individual namespaces.
-
Workloads: Violations specific to resources, such as
DeploymentsorDaemonSets.
11.1.1.2. Predefined health rules
The Network Observability Operator provides default rules for common networking scenarios. These rules are active only if the corresponding feature is enabled in the FlowCollector custom resource (CR).
The following list contains a subset of available default rules:
PacketDropsByDevice-
Triggers on a high percentage of packet drops from network devices. It is based on standard node-exporter metrics and does not require the
PacketDropagent feature. PacketDropsByKernel-
Triggers on a high percentage of packet drops by the kernel. Requires the
PacketDropagent feature. IPsecErrors-
Triggers when IPsec encryption errors are detected. Requires the
IPSecagent feature. NetpolDenied-
Triggers when traffic denied by network policies is detected. Requires the
NetworkEventsagent feature. LatencyHighTrend-
Triggers when a significant increase in TCP latency is detected. Requires the
FlowRTTagent feature. DNSErrors-
Triggers when DNS errors are detected. Requires the
DNSTrackingagent feature.
Operational alerts for the Network Observability Operator:
NetObservNoFlows- Triggers when the pipeline is active but no flows are observed.
NetObservLokiError- Triggers when flows are dropped because of Loki errors.
For a complete list of rules and runbooks, see the Network Observability Operator runbooks.
11.1.1.3. Rule dependencies and feature requirements
The Network Observability Operator creates rules based on the features enabled in the FlowCollector custom resource (CR).
For example, packet drop-related rules are created only if the PacketDrop agent feature is enabled. Rules are built on metrics; if the required metrics are missing, configuration warnings might appear. Configure metrics in the spec.processor.metrics.includeList object of the FlowCollector resource.
11.2. Performance optimization with recording rules
For large-scale clusters, recording rules optimize how Prometheus handles network data. Recording rules improve dashboard responsiveness and reduce the computational overhead of complex queries.
11.2.1. Optimization benefits
Recording rules pre-compute complex Prometheus Query Language (PromQL) expressions and save the results as new time series. Unlike alerting rules, recording rules do not monitor thresholds.
Using recording rules provides the following advantages:
- Improved performance
- Pre-computing Prometheus queries allows dashboards to load faster by avoiding on-demand calculations for long-term trends.
- Resource efficiency
- Calculating data at fixed intervals reduces CPU load on the Prometheus server compared to recalculating data on every dashboard refresh.
- Simplified queries
-
Using short metric names, such as
cluster:network_traffic:rate_5m, simplifies complex aggregate calculations in custom dashboards.
11.2.2. Comparison of rule modes
The following table compares rule modes based on the expected outcome:
| Description | Alerting rules | Recording rules |
|---|---|---|
| Goal | Issue notification. | Save history of high level metrics. |
| Data result | Generates an alerting state. | Creates a persistent metric. |
| Visibility | Alerting UI and Network Health view. | Metrics Explorer and Network Health view. |
| Notifications |
Triggers | Does not trigger notifications. |
11.3. Network observability health rule structure and customization
Health rules in the Network Observability Operator are defined using rule templates and variants in the spec.processor.metrics.healthRules object of the FlowCollector custom resource (CR). You can customize the default templates and variants for flexible, fine-grained alerting.
For each template, you can define a list of variants, each with their own thresholds and grouping configurations. For more information, see "List of default alert templates".
The following example shows an alert:
apiVersion: flows.netobserv.io/v1beta1
kind: FlowCollector
metadata:
name: flow-collector
spec:
processor:
metrics:
healthRules:
- template: PacketDropsByKernel
mode: Alert # or Recording
variants:
# triggered when the whole cluster traffic (no grouping) reaches 10% of drops
- thresholds:
critical: "10"
# triggered when per-node traffic reaches 5% of drops, with gradual severity
- thresholds:
critical: "15"
warning: "10"
info: "5"
groupBy: Nodewhere:
spec.processor.metrics.healthRules.template- Specifies the name of the predefined rule template.
spec.processor.metrics.healthRules.mode-
Specifies whether the rule functions as an
Alertor aRecordingrule. This setting can either be defined per variant, or for the whole template. spec.processor.metrics.healthRules.variants.thresholds-
Specifies the numerical values that trigger the rule. You can define multiple severity levels, such as
critical,warning, orinfo, within a single variant. cluster-wide variant-
Specifies a variant defined without a
groupBysetting. In the provided example, this variant triggers when the total cluster traffic reaches 10% drops. spec.processor.metrics.healthRules.variants.groupBy- Specifies the dimension used to aggregate the metric. In the provided example, the alert is evaluated independently for each *Node8.
Customizing a rule replaces the default configuration for that template. If you want to keep the default configurations, you must manually replicate them.
11.3.1. PromQL expressions and metadata for health rules
Learn about the base query for Prometheus Query Language (PromQL), and how to customize it so you can configure network observability alerts for your specific needs.
The health rule API in the network observability FlowCollector custom resource (CR) is mapped to the Prometheus Operator API, generating a PrometheusRule. You can see the PrometheusRule in the default netobserv namespace by running the following command:
$ oc get prometheusrules -n netobserv -oyaml11.3.1.1. An example query for an alert in a surge of incoming traffic
This example provides the base PromQL query pattern for an alert about a surge in incoming traffic:
sum(rate(netobserv_workload_ingress_bytes_total{SrcK8S_Namespace="openshift-ingress"}[30m])) by (DstK8S_Namespace)
This query calculates the byte rate coming from the openshift-ingress namespace to any of your workloads' namespaces over the past 30 minutes.
You can customize the query, including retaining only some rates, running the query for specific time periods, and setting a final threshold.
- Filtering noise
Appending
> 1000to this query retains only the rates observed that are greater than1 KB/s, which eliminates noise from low-bandwidth consumers.(sum(rate(netobserv_workload_ingress_bytes_total{SrcK8S_Namespace="openshift-ingress"}[30m])) by (DstK8S_Namespace) > 1000)The byte rate is relative to the sampling interval defined in the
FlowCollectorcustom resource (CR) configuration. If the sampling interval is1:100, the actual traffic might be approximately 100 times higher than the reported metrics.- Time comparison
You can run the same query for a particular period of time using the
offsetmodifier. For example, a query for one day earlier can be run usingoffset 1d, and a query for five hours ago can be run usingoffset 5h.sum(rate(netobserv_workload_ingress_bytes_total{SrcK8S_Namespace="openshift-ingress"}[30m] offset 1d)) by (DstK8S_Namespace))You can use the formula
100 * (<query now> - <query from the previous day>) / <query from the previous day>to calculate the percentage of increase compared to the previous day. This value can be negative if the byte rate today is lower than the previous day.- Final threshold
-
You can apply a final threshold to filter increases that are lower than the desired percentage. For example,
> 100eliminates increases that are lower than 100%.
Together, the complete expression for the PrometheusRule looks like the following:
...
expr: |-
(100 *
(
(sum(rate(netobserv_workload_ingress_bytes_total{SrcK8S_Namespace="openshift-ingress"}[30m])) by (DstK8S_Namespace) > 1000)
- sum(rate(netobserv_workload_ingress_bytes_total{SrcK8S_Namespace="openshift-ingress"}[30m] offset 1d)) by (DstK8S_Namespace)
)
/ sum(rate(netobserv_workload_ingress_bytes_total{SrcK8S_Namespace="openshift-ingress"}[30m] offset 1d)) by (DstK8S_Namespace))
> 10011.3.1.2. Alert metadata fields
The Network Observability Operator uses components from other OpenShift Container Platform features, such as the monitoring stack, to enhance visibility into network traffic. For more information, see: "Monitoring stack architecture".
Some metadata must be configured for the rule definitions. This metadata is used by Prometheus and the Alertmanager service from the monitoring stack, or by the Network Health dashboard.
The following example shows an AlertingRule resource with the configured metadata:
apiVersion: monitoring.openshift.io/v1
kind: AlertingRule
metadata:
name: netobserv-alerts
namespace: openshift-monitoring
spec:
groups:
- name: NetObservAlerts
rules:
- alert: NetObservIncomingBandwidth
annotations:
netobserv_io_network_health: '{"namespaceLabels":["DstK8S_Namespace"],"threshold":"100","unit":"%","upperBound":"500"}'
message: |-
NetObserv is detecting a surge of incoming traffic: current traffic to {{ $labels.DstK8S_Namespace }} has increased by more than 100% since yesterday.
summary: "Surge in incoming traffic"
expr: |-
(100 *
(
(sum(rate(netobserv_workload_ingress_bytes_total{SrcK8S_Namespace="openshift-ingress"}[30m])) by (DstK8S_Namespace) > 1000)
- sum(rate(netobserv_workload_ingress_bytes_total{SrcK8S_Namespace="openshift-ingress"}[30m] offset 1d)) by (DstK8S_Namespace)
)
/ sum(rate(netobserv_workload_ingress_bytes_total{SrcK8S_Namespace="openshift-ingress"}[30m] offset 1d)) by (DstK8S_Namespace))
> 100
for: 1m
labels:
app: netobserv
netobserv: "true"
severity: warningwhere:
spec.groups.rules.alert.labels.netobserv-
Specifies the alert for the Network Health dashboard to detect when set to
true. spec.groups.rules.alert.labels.severity-
Specifies the severity of the alert. The following values are valid:
critical,warning, orinfo.
You can leverage the output labels from the defined PromQL expression in the message annotation. In the example, since results are grouped per DstK8S_Namespace, the expression {{ $labels.DstK8S_Namespace }} is used in the message text.
The netobserv_io_network_health annotation is optional, and controls how the alert is rendered on the Network Health page.
The netobserv_io_network_health annotation is a JSON string consisting of the following fields:
| Field | Type | Description |
|---|---|---|
|
| List of strings | One or more labels that hold namespaces. When provided, the alert appears under the Namespaces tab. |
|
| List of strings | One or more labels that hold node names. When provided, the alert appears under the Nodes tab. |
|
| List of strings |
One or more labels that hold owner/workload names. When provided alongside with |
|
| List of strings |
One or more labels that hold owner/workload kinds. When provided alongside with |
|
| String |
The alert threshold, expected to match the threshold defined in the |
|
| String | The data unit, used only for display purposes. |
|
| String | An upper bound value used to compute the score on a closed scale. Metric values exceeding this bound are clamped. |
|
| List of objects |
A list of links to display contextually with the alert. Each link requires a |
|
| String |
Information related to the link to the Network Traffic page, for URL building. Some filters will be set automatically, such as the |
The namespaceLabels and nodeLabels are mutually exclusive. If neither is provided, the alert appears under the Global tab.
| Field | Description |
|---|---|
|
| Additional filter to inject (for example, a DNS response code for DNS-related alerts). |
|
|
Whether the filter should include return traffic ( |
|
|
Whether the filter should target the destination of the traffic instead of the source ( |
11.3.2. Custom health rule configuration
Use the Prometheus Query Language (PromQL) to define a custom AlertingRule resource to trigger alerts based on specific network metrics (e.g., traffic surges).
Prerequisites
-
Familiarity with
PromQL. - You have installed OpenShift Container Platform 4.16 or later.
-
You have access to the cluster as a user with the
cluster-adminrole. - You have installed the Network Observability Operator.
Procedure
-
Create a YAML file named
custom-alert.yamlthat contains yourAlertingRuleresource. Apply the custom alert rule by running the following command:
$ oc apply -f custom-alert.yaml
Verification
Verify that the
PrometheusRuleresource was created in thenetobservnamespace by running the following command:$ oc get prometheusrules -n netobserv -oyamlThe output should include the
netobserv-alertsrule you just created, confirming that the resource was generated correctly.- Confirm the rule is active by checking the Network Health dashboard in the OpenShift Container Platform web console → Observe.
11.4. Disable predefined rules
Rule templates can be disabled in the spec.processor.metrics.disableAlerts field of the FlowCollector custom resource (CR). This setting accepts a list of rule template names. For a list of alert template names, see "List of default rules".
If a template is disabled and overridden in the spec.processor.metrics.healthRules field, the disable setting takes precedence and the alert rule is not created.
Chapter 12. Using metrics with dashboards and alerts
The Network Observability Operator uses the flowlogs-pipeline component to generate metrics from flow logs. Use these metrics to set custom alerts and view dashboards for network activity analysis.
12.1. Viewing network observability metrics dashboards
On the Overview tab in the OpenShift Container Platform console, you can view the overall aggregated metrics of the network traffic flow on the cluster. You can choose to display the information by node, namespace, owner, pod, and service. You can also use filters and display options to further refine the metrics.
Procedure
- In the web console Observe → Dashboards, select the Netobserv dashboard.
View network traffic metrics in the following categories, with each having the subset per node, namespace, source, and destination:
- Byte rates
- Packet drops
- DNS
- RTT
- Select the Netobserv/Health dashboard.
View metrics about the health of the Operator in the following categories, with each having the subset per node, namespace, source, and destination.
- Flows
- Flows Overhead
- Flow rates
- Agents
- Processor
- Operator
Infrastructure and Application metrics are shown in a split-view for namespace and workloads.
12.2. Predefined metrics
Metrics generated by the flowlogs-pipeline are configurable in the spec.processor.metrics.includeList of the FlowCollector custom resource to add or remove metrics.
12.3. Network observability metrics
You can also create alerts by using the includeList metrics in Prometheus rules, as shown in the example "Creating alerts".
When looking for these metrics in Prometheus, such as in the Console through Observe → Metrics, or when defining alerts, all the metrics names are prefixed with netobserv_. For example, netobserv_namespace_flows_total. Available metrics names are as follows:
- includeList metrics names
Names followed by an asterisk
*are enabled by default.-
namespace_egress_bytes_total -
namespace_egress_packets_total -
namespace_ingress_bytes_total -
namespace_ingress_packets_total -
namespace_flows_total* -
node_egress_bytes_total -
node_egress_packets_total -
node_ingress_bytes_total* -
node_ingress_packets_total -
node_flows_total -
workload_egress_bytes_total -
workload_egress_packets_total -
workload_ingress_bytes_total* -
workload_ingress_packets_total -
workload_flows_total
-
- PacketDrop metrics names
When the
PacketDropfeature is enabled inspec.agent.ebpf.features(withprivilegedmode), the following additional metrics are available:-
namespace_drop_bytes_total -
namespace_drop_packets_total* -
node_drop_bytes_total -
node_drop_packets_total -
workload_drop_bytes_total -
workload_drop_packets_total
-
- DNS metrics names
When the
DNSTrackingfeature is enabled inspec.agent.ebpf.features, the following additional metrics are available:-
namespace_dns_latency_seconds* -
node_dns_latency_seconds -
workload_dns_latency_seconds
-
- FlowRTT metrics names
When the
FlowRTTfeature is enabled inspec.agent.ebpf.features, the following additional metrics are available:-
namespace_rtt_seconds* -
node_rtt_seconds -
workload_rtt_seconds
-
12.4. Creating alerts
You can create custom alerting rules for the Netobserv dashboard metrics to trigger alerts when some defined conditions are met.
Prerequisites
- You have access to the cluster as a user with the cluster-admin role or with view permissions for all projects.
- You have the Network Observability Operator installed.
Procedure
- Create a YAML file by clicking the import icon, +.
Add an alerting rule configuration to the YAML file. In the YAML sample that follows, an alert is created for when the cluster ingress traffic reaches a given threshold of 10 MBps per destination workload.
apiVersion: monitoring.openshift.io/v1 kind: AlertingRule metadata: name: netobserv-alerts namespace: openshift-monitoring spec: groups: - name: NetObservAlerts rules: - alert: NetObservIncomingBandwidth annotations: message: |- {{ $labels.job }}: incoming traffic exceeding 10 MBps for 30s on {{ $labels.DstK8S_OwnerType }} {{ $labels.DstK8S_OwnerName }} ({{ $labels.DstK8S_Namespace }}). summary: "High incoming traffic." expr: sum(rate(netobserv_workload_ingress_bytes_total {SrcK8S_Namespace="openshift-ingress"}[1m])) by (job, DstK8S_Namespace, DstK8S_OwnerName, DstK8S_OwnerType) > 100000001 for: 30s labels: severity: warning- 1
- The
netobserv_workload_ingress_bytes_totalmetric is enabled by default inspec.processor.metrics.includeList.
- Click Create to apply the configuration file to the cluster.
12.5. Custom metrics
You can create custom metrics out of the flowlogs data using the FlowMetric API. In every flowlogs data that is collected, there are a number of fields labeled per log, such as source name and destination name. These fields can be leveraged as Prometheus labels to enable the customization of cluster information on your dashboard.
12.6. Configuring custom metrics by using FlowMetric API
You can configure the FlowMetric API to create custom metrics by using flowlogs data fields as Prometheus labels. You can add multiple FlowMetric resources to a project to see multiple dashboard views.
Procedure
- In the web console, navigate to Operators → Installed Operators.
- In the Provided APIs heading for the NetObserv Operator, select FlowMetric.
- In the Project: dropdown list, select the project of the Network Observability Operator instance.
- Click Create FlowMetric.
Configure the
FlowMetricresource, similar to the following sample configurations:Example 12.1. Generate a metric that tracks ingress bytes received from cluster external sources
apiVersion: flows.netobserv.io/v1alpha1 kind: FlowMetric metadata: name: flowmetric-cluster-external-ingress-traffic namespace: netobserv1 spec: metricName: cluster_external_ingress_bytes_total2 type: Counter3 valueField: Bytes direction: Ingress4 labels: [DstK8S_HostName,DstK8S_Namespace,DstK8S_OwnerName,DstK8S_OwnerType]5 filters:6 - field: SrcSubnetLabel matchType: Absence- 1
- The
FlowMetricresources need to be created in the namespace defined in theFlowCollectorspec.namespace, which isnetobservby default. - 2
- The name of the Prometheus metric, which in the web console appears with the prefix
netobserv-<metricName>. - 3
- The
typespecifies the type of metric. TheCountertypeis useful for counting bytes or packets. - 4
- The direction of traffic to capture. If not specified, both ingress and egress are captured, which can lead to duplicated counts.
- 5
- Labels define what the metrics look like and the relationship between the different entities and also define the metrics cardinality. For example,
SrcK8S_Nameis a high cardinality metric. - 6
- Refines results based on the listed criteria. In this example, selecting only the cluster external traffic is done by matching only flows where
SrcSubnetLabelis absent. This assumes the subnet labels feature is enabled (viaspec.processor.subnetLabels), which is done by default.
Verification
- Once the pods refresh, navigate to Observe → Metrics.
-
In the Expression field, type the metric name to view the corresponding result. You can also enter an expression, such as
topk(5, sum(rate(netobserv_cluster_external_ingress_bytes_total{DstK8S_Namespace="my-namespace"}[2m])) by (DstK8S_HostName, DstK8S_OwnerName, DstK8S_OwnerType))
Example 12.2. Show RTT latency for cluster external ingress traffic
apiVersion: flows.netobserv.io/v1alpha1 kind: FlowMetric metadata: name: flowmetric-cluster-external-ingress-rtt namespace: netobserv1 spec: metricName: cluster_external_ingress_rtt_seconds type: Histogram2 valueField: TimeFlowRttNs direction: Ingress labels: [DstK8S_HostName,DstK8S_Namespace,DstK8S_OwnerName,DstK8S_OwnerType] filters: - field: SrcSubnetLabel matchType: Absence - field: TimeFlowRttNs matchType: Presence divider: "1000000000"3 buckets: [".001", ".005", ".01", ".02", ".03", ".04", ".05", ".075", ".1", ".25", "1"]4 - 1
- The
FlowMetricresources need to be created in the namespace defined in theFlowCollectorspec.namespace, which isnetobservby default. - 2
- The
typespecifies the type of metric. TheHistogramtypeis useful for a latency value (TimeFlowRttNs). - 3
- Since the Round-trip time (RTT) is provided as nanos in flows, use a divider of 1 billion to convert into seconds, which is standard in Prometheus guidelines.
- 4
- The custom buckets specify precision on RTT, with optimal precision ranging between 5ms and 250ms.
Verification
- Once the pods refresh, navigate to Observe → Metrics.
- In the Expression field, you can type the metric name to view the corresponding result.
High cardinality can affect the memory usage of Prometheus. You can check whether specific labels have high cardinality in the Network Flows format reference.
12.7. Configuring custom charts using FlowMetric API
You can generate charts for dashboards in the OpenShift Container Platform web console, which you can view as an administrator in the Dashboard menu by defining the charts section of the FlowMetric resource.
Procedure
- In the web console, navigate to Operators → Installed Operators.
- In the Provided APIs heading for the NetObserv Operator, select FlowMetric.
- In the Project: dropdown list, select the project of the Network Observability Operator instance.
- Click Create FlowMetric.
-
Configure the
FlowMetricresource, similar to the following sample configurations:
Example 12.3. Chart for tracking ingress bytes received from cluster external sources
apiVersion: flows.netobserv.io/v1alpha1
kind: FlowMetric
metadata:
name: flowmetric-cluster-external-ingress-traffic
namespace: netobserv
# ...
charts:
- dashboardName: Main
title: External ingress traffic
unit: Bps
type: SingleStat
queries:
- promQL: "sum(rate($METRIC[2m]))"
legend: ""
- dashboardName: Main
sectionName: External
title: Top external ingress traffic per workload
unit: Bps
type: StackArea
queries:
- promQL: "sum(rate($METRIC{DstK8S_Namespace!=\"\"}[2m])) by (DstK8S_Namespace, DstK8S_OwnerName)"
legend: "{{DstK8S_Namespace}} / {{DstK8S_OwnerName}}"
# ...- 1
- The
FlowMetricresources need to be created in the namespace defined in theFlowCollectorspec.namespace, which isnetobservby default.
Verification
- Once the pods refresh, navigate to Observe → Dashboards.
Search for the NetObserv / Main dashboard. View two panels under the NetObserv / Main dashboard, or optionally a dashboard name that you create:
- A textual single statistic showing the global external ingress rate summed across all dimensions
- A timeseries graph showing the same metric per destination workload
For more information about the query language, refer to the Prometheus documentation.
Example 12.4. Chart for RTT latency for cluster external ingress traffic
apiVersion: flows.netobserv.io/v1alpha1
kind: FlowMetric
metadata:
name: flowmetric-cluster-external-ingress-traffic
namespace: netobserv
# ...
charts:
- dashboardName: Main
title: External ingress TCP latency
unit: seconds
type: SingleStat
queries:
- promQL: "histogram_quantile(0.99, sum(rate($METRIC_bucket[2m])) by (le)) > 0"
legend: "p99"
- dashboardName: Main
sectionName: External
title: "Top external ingress sRTT per workload, p50 (ms)"
unit: seconds
type: Line
queries:
- promQL: "histogram_quantile(0.5, sum(rate($METRIC_bucket{DstK8S_Namespace!=\"\"}[2m])) by (le,DstK8S_Namespace,DstK8S_OwnerName))*1000 > 0"
legend: "{{DstK8S_Namespace}} / {{DstK8S_OwnerName}}"
- dashboardName: Main
sectionName: External
title: "Top external ingress sRTT per workload, p99 (ms)"
unit: seconds
type: Line
queries:
- promQL: "histogram_quantile(0.99, sum(rate($METRIC_bucket{DstK8S_Namespace!=\"\"}[2m])) by (le,DstK8S_Namespace,DstK8S_OwnerName))*1000 > 0"
legend: "{{DstK8S_Namespace}} / {{DstK8S_OwnerName}}"
# ...
This example uses the histogram_quantile function to show p50 and p99.
You can show averages of histograms by dividing the metric, $METRIC_sum, by the metric, $METRIC_count, which are automatically generated when you create a histogram. With the preceding example, the Prometheus query to do this is as follows:
promQL: "(sum(rate($METRIC_sum{DstK8S_Namespace!=\"\"}[2m])) by (DstK8S_Namespace,DstK8S_OwnerName) / sum(rate($METRIC_count{DstK8S_Namespace!=\"\"}[2m])) by (DstK8S_Namespace,DstK8S_OwnerName))*1000"Verification
- Once the pods refresh, navigate to Observe → Dashboards.
- Search for the NetObserv / Main dashboard. View the new panel under the NetObserv / Main dashboard, or optionally a dashboard name that you create.
For more information about the query language, refer to the Prometheus documentation.
12.8. Detecting SYN flooding using the FlowMetric API and TCP flags
You can create an AlertingRule resouce to alert for SYN flooding.
Procedure
- In the web console, navigate to Operators → Installed Operators.
- In the Provided APIs heading for the NetObserv Operator, select FlowMetric.
- In the Project dropdown list, select the project of the Network Observability Operator instance.
- Click Create FlowMetric.
Create
FlowMetricresources to add the following configurations:Configuration counting flows per destination host and resource, with TCP flags
apiVersion: flows.netobserv.io/v1alpha1 kind: FlowMetric metadata: name: flows-with-flags-per-destination spec: metricName: flows_with_flags_per_destination_total type: Counter labels: [SrcSubnetLabel,DstSubnetLabel,DstK8S_Name,DstK8S_Type,DstK8S_HostName,DstK8S_Namespace,Flags]Configuration counting flows per source host and resource, with TCP flags
apiVersion: flows.netobserv.io/v1alpha1 kind: FlowMetric metadata: name: flows-with-flags-per-source spec: metricName: flows_with_flags_per_source_total type: Counter labels: [DstSubnetLabel,SrcSubnetLabel,SrcK8S_Name,SrcK8S_Type,SrcK8S_HostName,SrcK8S_Namespace,Flags]Deploy the following
AlertingRuleresource to alert for SYN flooding:AlertingRulefor SYN floodingapiVersion: monitoring.openshift.io/v1 kind: AlertingRule metadata: name: netobserv-syn-alerts namespace: openshift-monitoring # ... spec: groups: - name: NetObservSYNAlerts rules: - alert: NetObserv-SYNFlood-in annotations: message: |- {{ $labels.job }}: incoming SYN-flood attack suspected to Host={{ $labels.DstK8S_HostName}}, Namespace={{ $labels.DstK8S_Namespace }}, Resource={{ $labels.DstK8S_Name }}. This is characterized by a high volume of SYN-only flows with different source IPs and/or ports. summary: "Incoming SYN-flood" expr: sum(rate(netobserv_flows_with_flags_per_destination_total{Flags="2"}[1m])) by (job, DstK8S_HostName, DstK8S_Namespace, DstK8S_Name) > 3001 for: 15s labels: severity: warning app: netobserv - alert: NetObserv-SYNFlood-out annotations: message: |- {{ $labels.job }}: outgoing SYN-flood attack suspected from Host={{ $labels.SrcK8S_HostName}}, Namespace={{ $labels.SrcK8S_Namespace }}, Resource={{ $labels.SrcK8S_Name }}. This is characterized by a high volume of SYN-only flows with different source IPs and/or ports. summary: "Outgoing SYN-flood" expr: sum(rate(netobserv_flows_with_flags_per_source_total{Flags="2"}[1m])) by (job, SrcK8S_HostName, SrcK8S_Namespace, SrcK8S_Name) > 3002 for: 15s labels: severity: warning app: netobserv # ...
Verification
- In the web console, click Manage Columns in the Network Traffic table view and click TCP flags.
- In the Network Traffic table view, filter on TCP protocol SYN TCPFlag. A large number of flows with the same byteSize indicates a SYN flood.
- Go to Observe → Alerting and select the Alerting Rules tab.
- Filter on netobserv-synflood-in alert. The alert should fire when SYN flooding occurs.
Chapter 13. Monitoring the Network Observability Operator
Use the OpenShift Container Platform web console to monitor alerts related to the Network Observability Operator’s health. This helps you maintain system stability and quickly detect operational issues.
13.1. Health dashboards
Metrics about health and resource usage of the Network Observability Operator are located in the Observe → Dashboards page in the web console. You can view metrics about the health of the Operator in the following categories:
- Flows per second
- Sampling
- Errors last minute
- Dropped flows per second
- Flowlogs-pipeline statistics
- Flowlogs-pipleine statistics views
- eBPF agent statistics views
- Operator statistics
- Resource usage
13.2. Health alerts
A health alert banner that directs you to the dashboard can appear on the Network Traffic and Home pages if an alert is triggered. Alerts are generated in the following cases:
-
The
NetObservLokiErroralert occurs if theflowlogs-pipelineworkload is dropping flows because of Loki errors, such as if the Loki ingestion rate limit has been reached. -
The
NetObservNoFlowsalert occurs if no flows are ingested for a certain amount of time. -
The
NetObservFlowsDroppedalert occurs if the Network Observability eBPF agent hashmap table is full, and the eBPF agent processes flows with degraded performance, or when the capacity limiter is triggered.
13.3. Viewing health information
You can access metrics about health and resource usage of the Network Observability Operator from the Dashboards page in the web console.
Prerequisites
- You have the Network Observability Operator installed.
-
You have access to the cluster as a user with the
cluster-adminrole or with view permissions for all projects.
Procedure
- From the Administrator perspective in the web console, navigate to Observe → Dashboards.
- From the Dashboards dropdown, select Netobserv/Health.
- View the metrics about the health of the Operator that are displayed on the page.
13.3.1. Disabling health alerts
You can opt out of health alerting by editing the FlowCollector resource:
- In the web console, navigate to Operators → Installed Operators.
- Under the Provided APIs heading for the NetObserv Operator, select Flow Collector.
- Select cluster then select the YAML tab.
Add
spec.processor.metrics.disableAlertsto disable health alerts, as in the following YAML sample:apiVersion: flows.netobserv.io/v1beta2 kind: FlowCollector metadata: name: cluster spec: processor: metrics: disableAlerts: [NetObservLokiError, NetObservNoFlows]1 - 1
- You can specify one or a list with both types of alerts to disable.
13.4. Creating Loki rate limit alerts for the NetObserv dashboard
You can create custom alerting rules for the Netobserv dashboard metrics to trigger alerts when Loki rate limits have been reached.
Prerequisites
- You have access to the cluster as a user with the cluster-admin role or with view permissions for all projects.
- You have the Network Observability Operator installed.
Procedure
- Create a YAML file by clicking the import icon, +.
Add an alerting rule configuration to the YAML file. In the YAML sample that follows, an alert is created for when Loki rate limits have been reached:
apiVersion: monitoring.openshift.io/v1 kind: AlertingRule metadata: name: loki-alerts namespace: openshift-monitoring spec: groups: - name: LokiRateLimitAlerts rules: - alert: LokiTenantRateLimit annotations: message: |- {{ $labels.job }} {{ $labels.route }} is experiencing 429 errors. summary: "At any number of requests are responded with the rate limit error code." expr: sum(irate(loki_request_duration_seconds_count{status_code="429"}[1m])) by (job, namespace, route) / sum(irate(loki_request_duration_seconds_count[1m])) by (job, namespace, route) * 100 > 0 for: 10s labels: severity: warning- Click Create to apply the configuration file to the cluster.
13.5. Using the eBPF agent alert
An alert, NetObservAgentFlowsDropped, is triggered when the network observability eBPF agent hashmap table is full or when the capacity limiter is triggered. If you see this alert, consider increasing the cacheMaxFlows in the FlowCollector, as shown in the following example.
Increasing the cacheMaxFlows might increase the memory usage of the eBPF agent.
Procedure
- In the web console, navigate to Operators → Installed Operators.
- Under the Provided APIs heading for the Network Observability Operator, select Flow Collector.
- Select cluster, and then select the YAML tab.
Increase the
spec.agent.ebpf.cacheMaxFlowsvalue, as shown in the following YAML sample:apiVersion: flows.netobserv.io/v1beta2 kind: FlowCollector metadata: name: cluster spec: namespace: netobserv deploymentModel: Service agent: type: eBPF ebpf: cacheMaxFlows: 2000001 - 1
- Increase the
cacheMaxFlowsvalue from its value at the time of theNetObservAgentFlowsDroppedalert.
Chapter 14. Scheduling resources
Taints and tolerations help you control which nodes host certain pods. Use these tools, along with node selectors, to guide the placement of network observability components.
A node selector specifies a map of key/value pairs that are defined using custom labels on nodes and selectors specified in pods.
For the pod to be eligible to run on a node, the pod must have the same key/value node selector as the label on the node.
14.1. Network observability deployment in specific nodes
You can configure the FlowCollector to control the deployment of network observability components in specific nodes. The spec.agent.ebpf.advanced.scheduling, spec.processor.advanced.scheduling, and spec.consolePlugin.advanced.scheduling specifications have the following configurable settings:
-
NodeSelector -
Tolerations -
Affinity -
PriorityClassName
Sample FlowCollector resource for spec.<component>.advanced.scheduling
apiVersion: flows.netobserv.io/v1beta2
kind: FlowCollector
metadata:
name: cluster
spec:
# ...
advanced:
scheduling:
tolerations:
- key: "<taint key>"
operator: "Equal"
value: "<taint value>"
effect: "<taint effect>"
nodeSelector:
<key>: <value>
affinity:
nodeAffinity:
requiredDuringSchedulingIgnoredDuringExecution:
nodeSelectorTerms:
- matchExpressions:
- key: name
operator: In
values:
- app-worker-node
priorityClassName: """
# ...Chapter 15. Secondary networks
You can configure the Network Observability Operator to collect and enrich network flow data from secondary networks, such as SR-IOV and OVN-Kubernetes.
15.1. Prerequisites
- Access to an OpenShift Container Platform cluster with an additional network interface, such as a secondary interface or an L2 network.
15.2. Configuring monitoring for SR-IOV interface traffic
In order to collect traffic from a cluster with a Single Root I/O Virtualization (SR-IOV) device, you must set the FlowCollector spec.agent.ebpf.privileged field to true. Then, the eBPF agent monitors other network namespaces in addition to the host network namespaces, which are monitored by default. When a pod with a virtual functions (VF) interface is created, a new network namespace is created. With SRIOVNetwork policy IPAM configurations specified, the VF interface is migrated from the host network namespace to the pod network namespace.
Prerequisites
- Access to an OpenShift Container Platform cluster with a SR-IOV device.
-
The
SRIOVNetworkcustom resource (CR)spec.ipamconfiguration must be set with an IP address from the range that the interface lists or from other plugins.
Procedure
- In the web console, navigate to Operators → Installed Operators.
- Under the Provided APIs heading for the NetObserv Operator, select Flow Collector.
- Select cluster and then select the YAML tab.
Configure the
FlowCollectorcustom resource. A sample configuration is as follows:Configure
FlowCollectorfor SR-IOV monitoringapiVersion: flows.netobserv.io/v1beta2 kind: FlowCollector metadata: name: cluster spec: namespace: netobserv deploymentModel: Service agent: type: eBPF ebpf: privileged: true1 - 1
- The
spec.agent.ebpf.privilegedfield value must be set totrueto enable SR-IOV monitoring.
15.3. Configuring virtual machine (VM) secondary network interfaces for Network Observability
You can observe network traffic on an OpenShift Virtualization setup by identifying eBPF-enriched network flows coming from VMs that are connected to secondary networks, such as through OVN-Kubernetes. Network flows coming from VMs that are connected to the default internal pod network are automatically captured by Network Observability.
Procedure
Get information about the virtual machine launcher pod by running the following command. This information is used in Step 5:
$ oc get pod virt-launcher-<vm_name>-<suffix> -n <namespace> -o yamlapiVersion: v1 kind: Pod metadata: annotations: k8s.v1.cni.cncf.io/network-status: |- [{ "name": "ovn-kubernetes", "interface": "eth0", "ips": [ "10.129.2.39" ], "mac": "0a:58:0a:81:02:27", "default": true, "dns": {} }, { "name": "my-vms/l2-network",1 "interface": "podc0f69e19ba2",2 "ips": [3 "10.10.10.15" ], "mac": "02:fb:f8:00:00:12",4 "dns": {} }] name: virt-launcher-fedora-aqua-fowl-13-zr2x9 namespace: my-vms spec: # ... status: # ...- In the web console, navigate to Operators → Installed Operators.
- Under the Provided APIs heading for the NetObserv Operator, select Flow Collector.
- Select cluster and then select the YAML tab.
Configure
FlowCollectorbased on the information you found from the additional network investigation:apiVersion: flows.netobserv.io/v1beta2 kind: FlowCollector metadata: name: cluster spec: agent: ebpf: privileged: true1 processor: advanced: secondaryNetworks: - index: \2 - MAC \3 name: my-vms/l2-network \4 # ...- 1
- Ensure that the eBPF agent is in
privilegedmode so that flows are collected for secondary interfaces. - 2
- Define the fields to use for indexing the virtual machine launcher pods. It is recommended to use the
MACaddress as the indexing field to get network flows enrichment for secondary interfaces. If you have overlapping MAC address between pods, then additional indexing fields, such asIPandInterface, could be added to have accurate enrichment. - 3
- If your additional network information has a MAC address, add
MACto the field list. - 4
- Specify the name of the network found in the
k8s.v1.cni.cncf.io/network-statusannotation. Usually <namespace>/<network_attachement_definition_name>.
Observe VM traffic:
- Navigate to the Network Traffic page.
-
Filter by Source IP using your virtual machine IP found in
k8s.v1.cni.cncf.io/network-statusannotation. - View both Source and Destination fields, which should be enriched, and identify the VM launcher pods and the VM instance as owners.
Chapter 16. Network Observability CLI
16.1. Installing the Network Observability CLI
The Network Observability CLI (oc netobserv) is deployed separately from the Network Observability Operator. The CLI is available as an OpenShift CLI (oc) plugin. It provides a lightweight way to quickly debug and troubleshoot with network observability.
16.1.1. About the Network Observability CLI
You can quickly debug and troubleshoot networking issues by using the Network Observability CLI (oc netobserv). The Network Observability CLI is a flow and packet visualization tool that relies on eBPF agents to stream collected data to an ephemeral collector pod. It requires no persistent storage during the capture. After the run, the output is transferred to your local machine. This enables quick, live insight into packets and flow data without installing the Network Observability Operator.
CLI capture is meant to run only for short durations, such as 8-10 minutes. If it runs for too long, it can be difficult to delete the running process.
16.1.2. Installing the Network Observability CLI
The Network Observability CLI gives you a lightweight way to quickly debug and troubleshoot network observability. It must be installed separately.
Installing the Network Observability CLI (oc netobserv) is a separate procedure from the Network Observability Operator installation. This means that, even if the Operator is installed from the software catalog, the CLI must be installed separately.
Users can optionally use Krew to install the netobserv CLI plugin. For more information, see "Installing a CLI plugin with Krew".
Prerequisites
-
You must install the OpenShift CLI (
oc). - You must have a macOS or Linux operating system.
-
You must install either
dockerorpodman.
You can use podman or docker to run the installation commands. This procedure uses podman.
Procedure
Log in to the Red Hat registry by running the following command:
$ podman login registry.redhat.ioExtract the
oc-netobservfile from the image by running the following commands:$ podman create --name netobserv-cli registry.redhat.io/network-observability/network-observability-cli-rhel9:1.11 $ podman cp netobserv-cli:/oc-netobserv . $ podman rm netobserv-cliMove the extracted file to a directory that is on the system’s
PATH, such as/usr/local/bin/, by running the following command:$ sudo mv oc-netobserv /usr/local/bin/
Verification
Verify that
oc netobservis available:$ oc netobserv versionThis command should produce an outcome similar to the following example:
Netobserv CLI version <version>16.2. Using the Network Observability CLI
You can visualize and filter the flows and packets data directly in the terminal to see specific usage, such as identifying who is using a specific port. The Network Observability CLI collects flows as JSON and database files or packets as a PCAP file, which you can use with third-party tools.
16.2.1. Capturing flows
You can capture flows and filter on any resource or zone in the data to solve use cases, such as displaying Round-Trip Time (RTT) between two zones. Table visualization in the CLI provides viewing and flow search capabilities.
Prerequisites
-
Install the OpenShift CLI (
oc). -
Install the Network Observability CLI (
oc netobserv) plugin.
Procedure
Capture flows with filters enabled by running the following command:
$ oc netobserv flows --enable_filter=true --action=Accept --cidr=0.0.0.0/0 --protocol=TCP --port=49051Add filters to the
live table filterprompt in the terminal to further refine the incoming flows. For example:live table filter: [SrcK8S_Zone:us-west-1b] press enter to match multiple regular expressions at once- Use the PageUp and PageDown keys to toggle between None, Resource, Zone, Host, Owner and all of the above.
-
To stop capturing, press Ctrl+C. The data that was captured is written to two separate files in an
./outputdirectory located in the same path used to install the CLI. View the captured data in the
./output/flow/<capture_date_time>.jsonJSON file, which contains JSON arrays of the captured data.Example JSON file
{ "AgentIP": "10.0.1.76", "Bytes": 561, "DnsErrno": 0, "Dscp": 20, "DstAddr": "f904:ece9:ba63:6ac7:8018:1e5:7130:0", "DstMac": "0A:58:0A:80:00:37", "DstPort": 9999, "Duplicate": false, "Etype": 2048, "Flags": 16, "FlowDirection": 0, "IfDirection": 0, "Interface": "ens5", "K8S_FlowLayer": "infra", "Packets": 1, "Proto": 6, "SrcAddr": "3e06:6c10:6440:2:a80:37:b756:270f", "SrcMac": "0A:58:0A:80:00:01", "SrcPort": 46934, "TimeFlowEndMs": 1709741962111, "TimeFlowRttNs": 121000, "TimeFlowStartMs": 1709741962111, "TimeReceived": 1709741964 }You can use SQLite to inspect the
./output/flow/<capture_date_time>.dbdatabase file. For example:Open the file by running the following command:
$ sqlite3 ./output/flow/<capture_date_time>.dbQuery the data by running a SQLite
SELECTstatement, for example:sqlite> SELECT DnsLatencyMs, DnsFlagsResponseCode, DnsId, DstAddr, DstPort, Interface, Proto, SrcAddr, SrcPort, Bytes, Packets FROM flow WHERE DnsLatencyMs >10 LIMIT 10;Example output
12|NoError|58747|10.128.0.63|57856||17|172.30.0.10|53|284|1 11|NoError|20486|10.128.0.52|56575||17|169.254.169.254|53|225|1 11|NoError|59544|10.128.0.103|51089||17|172.30.0.10|53|307|1 13|NoError|32519|10.128.0.52|55241||17|169.254.169.254|53|254|1 12|NoError|32519|10.0.0.3|55241||17|169.254.169.254|53|254|1 15|NoError|57673|10.128.0.19|59051||17|172.30.0.10|53|313|1 13|NoError|35652|10.0.0.3|46532||17|169.254.169.254|53|183|1 32|NoError|37326|10.0.0.3|52718||17|169.254.169.254|53|169|1 14|NoError|14530|10.0.0.3|58203||17|169.254.169.254|53|246|1 15|NoError|40548|10.0.0.3|45933||17|169.254.169.254|53|174|1
16.2.2. Capturing packets
You can capture packets using the Network Observability CLI.
Prerequisites
-
Install the OpenShift CLI (
oc). -
Install the Network Observability CLI (
oc netobserv) plugin.
Procedure
Run the packet capture with filters enabled:
$ oc netobserv packets --action=Accept --cidr=0.0.0.0/0 --protocol=TCP --port=49051Add filters to the
live table filterprompt in the terminal to refine the incoming packets. An example filter is as follows:live table filter: [SrcK8S_Zone:us-west-1b] press enter to match multiple regular expressions at once- Use the PageUp and PageDown keys to toggle between None, Resource, Zone, Host, Owner and all of the above.
- To stop capturing, press Ctrl+C.
View the captured data, which is written to a single file in an
./output/pcapdirectory located in the same path that was used to install the CLI:-
The
./output/pcap/<capture_date_time>.pcapfile can be opened with Wireshark.
-
The
16.2.3. Capturing metrics
You can generate on-demand dashboards in Prometheus by using a service monitor for network observability.
Prerequisites
-
Install the OpenShift CLI (
oc). -
Install the Network Observability CLI (
oc netobserv) plugin.
Procedure
Capture metrics with filters enabled by running the following command:
Example output
$ oc netobserv metrics --enable_filter=true --cidr=0.0.0.0/0 --protocol=TCP --port=49051Open the link provided in the terminal to view the NetObserv / On-Demand dashboard:
Example URL
https://console-openshift-console.apps.rosa...openshiftapps.com/monitoring/dashboards/netobserv-cliNoteFeatures that are not enabled present as empty graphs.
16.2.4. Cleaning the Network Observability CLI
You can manually clean the CLI workload by running oc netobserv cleanup. This command removes all the CLI components from your cluster.
When you end a capture, this command is run automatically by the client. You might be required to manually run it if you experience connectivity issues.
Procedure
Run the following command:
$ oc netobserv cleanup
Additional resources
16.3. Network Observability CLI (oc netobserv) reference
The Network Observability CLI (oc netobserv) has most features and filtering options that are available for the Network Observability Operator. You can pass command-line arguments to enable features or filtering options.
16.3.1. Network Observability CLI usage
You can use the Network Observability CLI (oc netobserv) to pass command line arguments to capture flows data, packets data, and metrics for further analysis and enable features supported by the Network Observability Operator.
16.3.1.1. Syntax
The basic syntax for oc netobserv commands:
oc netobserv syntax
$ oc netobserv [<command>] [<feature_option>] [<command_options>] - 1
- Feature options can only be used with the
oc netobserv flowscommand. They cannot be used with theoc netobserv packetscommand.
16.3.1.2. Basic commands
| Command | Description |
|---|---|
| flows | Capture flows information. For subcommands, see the "Flows capture options" table. |
| packets | Capture packets data. For subcommands, see the "Packets capture options" table. |
| metrics | Capture metrics data. For subcommands, see the "Metrics capture options" table. |
| follow | Follow collector logs when running in background. |
| stop | Stop collection by removing agent daemonset. |
| copy | Copy collector generated files locally. |
| cleanup | Remove the Network Observability CLI components. |
| version | Print the software version. |
| help | Show help. |
16.3.1.3. Flows capture options
Flows capture has mandatory commands as well as additional options, such as enabling extra features about packet drops, DNS latencies, Round-trip time, and filtering.
oc netobserv flows syntax
$ oc netobserv flows [<feature_option>] [<command_options>]| Option | Description | Default |
|---|---|---|
| --enable_all | enable all eBPF features | false |
| --enable_dns | enable DNS tracking | false |
| --enable_ipsec | enable IPsec tracking | false |
| --enable_network_events | enable network events monitoring | false |
| --enable_pkt_translation | enable packet translation | false |
| --enable_pkt_drop | enable packet drop | false |
| --enable_rtt | enable RTT tracking | false |
| --enable_udn_mapping | enable User Defined Network mapping | false |
| --get-subnets | get subnets information | false |
| --privileged | force eBPF agent privileged mode | auto |
| --sampling | packets sampling interval | 1 |
| --background | run in background | false |
| --copy | copy the output files locally | prompt |
| --log-level | components logs | info |
| --max-time | maximum capture time | 5m |
| --max-bytes | maximum capture bytes | 50000000 = 50MB |
| --action | filter action | Accept |
| --cidr | filter CIDR | 0.0.0.0/0 |
| --direction | filter direction | - |
| --dport | filter destination port | - |
| --dport_range | filter destination port range | - |
| --dports | filter on either of two destination ports | - |
| --drops | filter flows with only dropped packets | false |
| --icmp_code | filter ICMP code | - |
| --icmp_type | filter ICMP type | - |
| --node-selector | capture on specific nodes | - |
| --peer_ip | filter peer IP | - |
| --peer_cidr | filter peer CIDR | - |
| --port_range | filter port range | - |
| --port | filter port | - |
| --ports | filter on either of two ports | - |
| --protocol | filter protocol | - |
| --query | filter flows using a custom query | - |
| --sport_range | filter source port range | - |
| --sport | filter source port | - |
| --sports | filter on either of two source ports | - |
| --tcp_flags | filter TCP flags | - |
| --interfaces | list of interfaces to monitor, comma separated | - |
| --exclude_interfaces | list of interfaces to exclude, comma separated | lo |
Example running flows capture on TCP protocol and port 49051 with PacketDrop and RTT features enabled:
$ oc netobserv flows --enable_pkt_drop --enable_rtt --action=Accept --cidr=0.0.0.0/0 --protocol=TCP --port=4905116.3.1.4. Packets capture options
You can filter packets capture data the as same as flows capture by using the filters. Certain features, such as packets drop, DNS, RTT, and network events, are only available for flows and metrics capture.
oc netobserv packets syntax
$ oc netobserv packets [<option>]| Option | Description | Default |
|---|---|---|
| --background | run in background | false |
| --copy | copy the output files locally | prompt |
| --log-level | components logs | info |
| --max-time | maximum capture time | 5m |
| --max-bytes | maximum capture bytes | 50000000 = 50MB |
| --action | filter action | Accept |
| --cidr | filter CIDR | 0.0.0.0/0 |
| --direction | filter direction | - |
| --dport | filter destination port | - |
| --dport_range | filter destination port range | - |
| --dports | filter on either of two destination ports | - |
| --drops | filter flows with only dropped packets | false |
| --icmp_code | filter ICMP code | - |
| --icmp_type | filter ICMP type | - |
| --node-selector | capture on specific nodes | - |
| --peer_ip | filter peer IP | - |
| --peer_cidr | filter peer CIDR | - |
| --port_range | filter port range | - |
| --port | filter port | - |
| --ports | filter on either of two ports | - |
| --protocol | filter protocol | - |
| --query | filter flows using a custom query | - |
| --sport_range | filter source port range | - |
| --sport | filter source port | - |
| --sports | filter on either of two source ports | - |
| --tcp_flags | filter TCP flags | - |
Example running packets capture on TCP protocol and port 49051:
$ oc netobserv packets --action=Accept --cidr=0.0.0.0/0 --protocol=TCP --port=4905116.3.1.5. Metrics capture options
You can enable features and use filters on metrics capture, the same as flows capture. The generated graphs fill accordingly in the dashboard.
oc netobserv metrics syntax
$ oc netobserv metrics [<option>]| Option | Description | Default |
|---|---|---|
| --enable_all | enable all eBPF features | false |
| --enable_dns | enable DNS tracking | false |
| --enable_ipsec | enable IPsec tracking | false |
| --enable_network_events | enable network events monitoring | false |
| --enable_pkt_translation | enable packet translation | false |
| --enable_pkt_drop | enable packet drop | false |
| --enable_rtt | enable RTT tracking | false |
| --enable_udn_mapping | enable User Defined Network mapping | false |
| --get-subnets | get subnets information | false |
| --privileged | force eBPF agent privileged mode | auto |
| --sampling | packets sampling interval | 1 |
| --background | run in background | false |
| --log-level | components logs | info |
| --max-time | maximum capture time | 1h |
| --action | filter action | Accept |
| --cidr | filter CIDR | 0.0.0.0/0 |
| --direction | filter direction | - |
| --dport | filter destination port | - |
| --dport_range | filter destination port range | - |
| --dports | filter on either of two destination ports | - |
| --drops | filter flows with only dropped packets | false |
| --icmp_code | filter ICMP code | - |
| --icmp_type | filter ICMP type | - |
| --node-selector | capture on specific nodes | - |
| --peer_ip | filter peer IP | - |
| --peer_cidr | filter peer CIDR | - |
| --port_range | filter port range | - |
| --port | filter port | - |
| --ports | filter on either of two ports | - |
| --protocol | filter protocol | - |
| --query | filter flows using a custom query | - |
| --sport_range | filter source port range | - |
| --sport | filter source port | - |
| --sports | filter on either of two source ports | - |
| --tcp_flags | filter TCP flags | - |
| --include_list | list of metric names to generate, comma separated | namespace_flows_total,node_ingress_bytes_total,node_egress_bytes_total,workload_ingress_bytes_total |
| --interfaces | list of interfaces to monitor, comma separated | - |
| --exclude_interfaces | list of interfaces to exclude, comma separated | lo |
Example running metrics capture for TCP drops
$ oc netobserv metrics --enable_pkt_drop --protocol=TCPChapter 17. FlowCollector API reference
The FlowCollector API is the underlying schema used to pilot and configure the deployments for collecting network flows. This reference guide helps you manage those critical settings.
17.1. FlowCollector API specifications
- Description
-
FlowCollectoris the schema for the network flows collection API, which pilots and configures the underlying deployments. - Type
-
object
| Property | Type | Description |
|---|---|---|
|
|
| APIVersion defines the versioned schema of this representation of an object. Servers should convert recognized schemas to the latest internal value, and might reject unrecognized values. More info: https://git.k8s.io/community/contributors/devel/sig-architecture/api-conventions.md#resources |
|
|
| Kind is a string value representing the REST resource this object represents. Servers might infer this from the endpoint the client submits requests to. Cannot be updated. In CamelCase. More info: https://git.k8s.io/community/contributors/devel/sig-architecture/api-conventions.md#types-kinds |
|
|
| Standard object’s metadata. More info: https://git.k8s.io/community/contributors/devel/sig-architecture/api-conventions.md#metadata |
|
|
|
Defines the desired state of the FlowCollector resource. *: the mention of "unsupported" or "deprecated" for a feature throughout this document means that this feature is not officially supported by Red Hat. It might have been, for example, contributed by the community and accepted without a formal agreement for maintenance. The product maintainers might provide some support for these features as a best effort only. |
17.1.1. .metadata
- Description
- Standard object’s metadata. More info: https://git.k8s.io/community/contributors/devel/sig-architecture/api-conventions.md#metadata
- Type
-
object
17.1.2. .spec
- Description
Defines the desired state of the FlowCollector resource.
*: the mention of "unsupported" or "deprecated" for a feature throughout this document means that this feature is not officially supported by Red Hat. It might have been, for example, contributed by the community and accepted without a formal agreement for maintenance. The product maintainers might provide some support for these features as a best effort only.
- Type
-
object
| Property | Type | Description |
|---|---|---|
|
|
| Agent configuration for flows extraction. |
|
|
|
|
|
|
|
-
-
-
Kafka can provide better scalability, resiliency, and high availability (for more details, see https://www.redhat.com/en/topics/integration/what-is-apache-kafka).
|
|
|
|
|
|
|
|
Kafka configuration, allowing to use Kafka as a broker as part of the flow collection pipeline. Available when the |
|
|
|
|
|
|
| Namespace where Network Observability pods are deployed. |
|
|
|
|
|
|
|
|
|
|
|
|
17.1.3. .spec.agent
- Description
- Agent configuration for flows extraction.
- Type
-
object
| Property | Type | Description |
|---|---|---|
|
|
|
|
|
|
|
|
17.1.4. .spec.agent.ebpf
- Description
-
ebpfdescribes the settings related to the eBPF-based flow reporter whenspec.agent.typeis set toeBPF. - Type
-
object
| Property | Type | Description |
|---|---|---|
|
|
|
|
|
|
|
|
|
|
|
|
|
|
|
|
|
|
|
List of additional features to enable. They are all disabled by default. Enabling additional features might have performance impacts. Possible values are:
-
-
-
-
-
-
- |
|
|
|
|
|
|
|
|
|
|
|
|
|
|
|
|
|
|
|
|
|
|
|
|
|
|
|
Privileged mode for the eBPF Agent container. When set to |
|
|
|
|
|
|
| Sampling interval of the eBPF probe. 100 means one packet on 100 is sent. 0 or 1 means all packets are sampled. |
17.1.5. .spec.agent.ebpf.advanced
- Description
-
advancedallows setting some aspects of the internal configuration of the eBPF agent. This section is aimed mostly for debugging and fine-grained performance optimizations, such asGOGCandGOMAXPROCSenvironment variables. Set these values at your own risk. You can also override the default Linux capabilities from there. - Type
-
object
| Property | Type | Description |
|---|---|---|
|
|
|
|
|
|
| scheduling controls how the pods are scheduled on nodes. |
17.1.6. .spec.agent.ebpf.advanced.scheduling
- Description
- scheduling controls how the pods are scheduled on nodes.
- Type
-
object
| Property | Type | Description |
|---|---|---|
|
|
| If specified, the pod’s scheduling constraints. For documentation, refer to https://kubernetes.io/docs/reference/kubernetes-api/workload-resources/pod-v1/#scheduling. |
|
|
|
|
|
|
| If specified, indicates the pod’s priority. For documentation, refer to https://kubernetes.io/docs/concepts/scheduling-eviction/pod-priority-preemption/#how-to-use-priority-and-preemption. If not specified, default priority is used, or zero if there is no default. |
|
|
|
|
17.1.7. .spec.agent.ebpf.advanced.scheduling.affinity
- Description
- If specified, the pod’s scheduling constraints. For documentation, refer to https://kubernetes.io/docs/reference/kubernetes-api/workload-resources/pod-v1/#scheduling.
- Type
-
object
17.1.8. .spec.agent.ebpf.advanced.scheduling.tolerations
- Description
-
tolerationsis a list of tolerations that allow the pod to schedule onto nodes with matching taints. For documentation, refer to https://kubernetes.io/docs/reference/kubernetes-api/workload-resources/pod-v1/#scheduling. - Type
-
array
17.1.9. .spec.agent.ebpf.flowFilter
- Description
-
flowFilterdefines the eBPF agent configuration regarding flow filtering. - Type
-
object
| Property | Type | Description |
|---|---|---|
|
|
|
|
|
|
|
|
|
|
|
|
|
|
|
|
|
|
|
Set |
|
|
|
|
|
|
|
|
|
|
|
|
|
|
|
|
|
|
|
|
|
|
|
|
|
|
|
|
|
|
|
|
|
|
|
|
|
|
|
|
|
|
|
|
17.1.10. .spec.agent.ebpf.flowFilter.rules
- Description
-
rulesdefines a list of filtering rules on the eBPF Agents. When filtering is enabled, by default, flows that don’t match any rule are rejected. To change the default, you can define a rule that accepts everything:{ action: "Accept", cidr: "0.0.0.0/0" }, and then refine with rejecting rules. Unsupported *. - Type
-
array
17.1.11. .spec.agent.ebpf.flowFilter.rules[]
- Description
-
EBPFFlowFilterRuledefines the desired eBPF agent configuration regarding flow filtering rule. - Type
-
object
| Property | Type | Description |
|---|---|---|
|
|
|
|
|
|
|
|
|
|
|
|
|
|
|
|
|
|
|
|
|
|
|
|
|
|
|
|
|
|
|
|
|
|
|
|
|
|
|
|
|
|
|
|
|
|
|
|
|
|
|
|
|
|
|
|
17.1.12. .spec.agent.ebpf.metrics
- Description
-
metricsdefines the eBPF agent configuration regarding metrics. - Type
-
object
| Property | Type | Description |
|---|---|---|
|
|
|
|
|
|
|
Set |
|
|
| Metrics server endpoint configuration for the Prometheus scraper. |
17.1.13. .spec.agent.ebpf.metrics.server
- Description
- Metrics server endpoint configuration for the Prometheus scraper.
- Type
-
object
| Property | Type | Description |
|---|---|---|
|
|
| The metrics server HTTP port. |
|
|
| TLS configuration. |
17.1.14. .spec.agent.ebpf.metrics.server.tls
- Description
- TLS configuration.
- Type
-
object - Required
-
type
-
| Property | Type | Description |
|---|---|---|
|
|
|
|
|
|
|
TLS configuration when |
|
|
|
Reference to the CA file when |
|
|
|
Select the type of TLS configuration:
- |
17.1.15. .spec.agent.ebpf.metrics.server.tls.provided
- Description
-
TLS configuration when
typeis set toProvided. - Type
-
object
| Property | Type | Description |
|---|---|---|
|
|
|
|
|
|
|
|
|
|
| Name of the config map or secret containing certificates. |
|
|
| Namespace of the config map or secret containing certificates. If omitted, the default is to use the same namespace as where Network Observability is deployed. If the namespace is different, the config map or the secret is copied so that it can be mounted as required. |
|
|
|
Type for the certificate reference: |
17.1.16. .spec.agent.ebpf.metrics.server.tls.providedCaFile
- Description
-
Reference to the CA file when
typeis set toProvided. - Type
-
object
| Property | Type | Description |
|---|---|---|
|
|
| File name within the config map or secret. |
|
|
| Name of the config map or secret containing the file. |
|
|
| Namespace of the config map or secret containing the file. If omitted, the default is to use the same namespace as where Network Observability is deployed. If the namespace is different, the config map or the secret is copied so that it can be mounted as required. |
|
|
|
Type for the file reference: |
17.1.17. .spec.agent.ebpf.resources
- Description
-
resourcesare the compute resources required by this container. For more information, see https://kubernetes.io/docs/concepts/configuration/manage-resources-containers/ - Type
-
object
| Property | Type | Description |
|---|---|---|
|
|
| Limits describes the maximum amount of compute resources allowed. More info: https://kubernetes.io/docs/concepts/configuration/manage-resources-containers/ |
|
|
| Requests describes the minimum amount of compute resources required. If Requests is omitted for a container, it defaults to Limits if that is explicitly specified, otherwise to an implementation-defined value. Requests cannot exceed Limits. More info: https://kubernetes.io/docs/concepts/configuration/manage-resources-containers/ |
17.1.18. .spec.consolePlugin
- Description
-
consolePlugindefines the settings related to the OpenShift Container Platform Console plugin, when available. - Type
-
object
| Property | Type | Description |
|---|---|---|
|
|
|
|
|
|
|
|
|
|
| Enables the console plugin deployment. |
|
|
|
|
|
|
|
|
|
|
|
|
|
|
|
|
|
|
|
|
|
|
|
|
|
|
| Deploy as a standalone console, instead of a plugin of the OpenShift Container Platform Console. This is not recommended when using with OpenShift Container Platform, as it doesn’t provide an integrated experience. [Unsupported (*)]. |
|
|
|
If |
17.1.19. .spec.consolePlugin.advanced
- Description
-
advancedallows setting some aspects of the internal configuration of the console plugin. This section is aimed mostly for debugging and fine-grained performance optimizations, such asGOGCandGOMAXPROCSenvironment variables. Set these values at your own risk. - Type
-
object
| Property | Type | Description |
|---|---|---|
|
|
|
|
|
|
|
|
|
|
|
|
|
|
|
|
|
|
|
|
17.1.20. .spec.consolePlugin.advanced.scheduling
- Description
-
schedulingcontrols how the pods are scheduled on nodes. - Type
-
object
| Property | Type | Description |
|---|---|---|
|
|
| If specified, the pod’s scheduling constraints. For documentation, refer to https://kubernetes.io/docs/reference/kubernetes-api/workload-resources/pod-v1/#scheduling. |
|
|
|
|
|
|
| If specified, indicates the pod’s priority. For documentation, refer to https://kubernetes.io/docs/concepts/scheduling-eviction/pod-priority-preemption/#how-to-use-priority-and-preemption. If not specified, default priority is used, or zero if there is no default. |
|
|
|
|
17.1.21. .spec.consolePlugin.advanced.scheduling.affinity
- Description
- If specified, the pod’s scheduling constraints. For documentation, refer to https://kubernetes.io/docs/reference/kubernetes-api/workload-resources/pod-v1/#scheduling.
- Type
-
object
17.1.22. .spec.consolePlugin.advanced.scheduling.tolerations
- Description
-
tolerationsis a list of tolerations that allow the pod to schedule onto nodes with matching taints. For documentation, refer to https://kubernetes.io/docs/reference/kubernetes-api/workload-resources/pod-v1/#scheduling. - Type
-
array
17.1.23. .spec.consolePlugin.autoscaler
- Description
-
autoscaler[deprecated (*)] spec of a horizontal pod autoscaler to set up for the plugin Deployment. Deprecation notice: managed autoscaler will be removed in a future version. You might configure instead an autoscaler of your choice, and setspec.consolePlugin.unmanagedReplicastotrue. Refer to HorizontalPodAutoscaler documentation (autoscaling/v2). - Type
-
object
17.1.24. .spec.consolePlugin.portNaming
- Description
-
portNamingdefines the configuration of the port-to-service name translation. - Type
-
object
| Property | Type | Description |
|---|---|---|
|
|
| Enable the console plugin port-to-service name translation |
|
|
|
|
17.1.25. .spec.consolePlugin.quickFilters
- Description
-
quickFiltersconfigures quick filter presets for the Console plugin. Filters for external traffic assume the subnet labels are configured to distinguish internal and external traffic (seespec.processor.subnetLabels). - Type
-
array
17.1.26. .spec.consolePlugin.quickFilters[]
- Description
-
QuickFilterdefines preset configuration for Console’s quick filters - Type
-
object - Required
-
filter -
name
-
| Property | Type | Description |
|---|---|---|
|
|
|
|
|
|
|
|
|
|
| Name of the filter, that is displayed in the Console |
17.1.27. .spec.consolePlugin.resources
- Description
-
resources, in terms of compute resources, required by this container. For more information, see https://kubernetes.io/docs/concepts/configuration/manage-resources-containers/. - Type
-
object
| Property | Type | Description |
|---|---|---|
|
|
| Limits describes the maximum amount of compute resources allowed. More info: https://kubernetes.io/docs/concepts/configuration/manage-resources-containers/ |
|
|
| Requests describes the minimum amount of compute resources required. If Requests is omitted for a container, it defaults to Limits if that is explicitly specified, otherwise to an implementation-defined value. Requests cannot exceed Limits. More info: https://kubernetes.io/docs/concepts/configuration/manage-resources-containers/ |
17.1.28. .spec.exporters
- Description
-
exportersdefines additional optional exporters for custom consumption or storage. - Type
-
array
17.1.29. .spec.exporters[]
- Description
-
FlowCollectorExporterdefines an additional exporter to send enriched flows to. - Type
-
object - Required
-
type
-
| Property | Type | Description |
|---|---|---|
|
|
| IPFIX configuration, such as the IP address and port to send enriched IPFIX flows to. |
|
|
| Kafka configuration, such as the address and topic, to send enriched flows to. |
|
|
| OpenTelemetry configuration, such as the IP address and port to send enriched logs or metrics to. |
|
|
|
|
17.1.30. .spec.exporters[].ipfix
- Description
- IPFIX configuration, such as the IP address and port to send enriched IPFIX flows to.
- Type
-
object - Required
-
enterpriseID -
targetHost -
targetPort
-
| Property | Type | Description |
|---|---|---|
|
|
| EnterpriseID, or Private Enterprise Number (PEN). To date, Network Observability does not own an assigned number, so it is left open for configuration. The PEN is needed to collect non standard data, such as Kubernetes names, RTT, etc. |
|
|
| Address of the IPFIX external receiver. |
|
|
| Port for the IPFIX external receiver. |
|
|
|
Transport protocol ( |
17.1.31. .spec.exporters[].kafka
- Description
- Kafka configuration, such as the address and topic, to send enriched flows to.
- Type
-
object - Required
-
address -
topic
-
| Property | Type | Description |
|---|---|---|
|
|
| Address of the Kafka server |
|
|
| SASL authentication configuration. Unsupported *. |
|
|
| TLS client configuration. When using TLS, verify that the address matches the Kafka port used for TLS, generally 9093. |
|
|
| Kafka topic to use. It must exist. Network Observability does not create it. |
17.1.32. .spec.exporters[].kafka.sasl
- Description
- SASL authentication configuration. Unsupported *.
- Type
-
object
| Property | Type | Description |
|---|---|---|
|
|
| Reference to the secret or config map containing the client ID |
|
|
| Reference to the secret or config map containing the client secret |
|
|
|
Type of SASL authentication to use, or |
17.1.33. .spec.exporters[].kafka.sasl.clientIDReference
- Description
- Reference to the secret or config map containing the client ID
- Type
-
object
| Property | Type | Description |
|---|---|---|
|
|
| File name within the config map or secret. |
|
|
| Name of the config map or secret containing the file. |
|
|
| Namespace of the config map or secret containing the file. If omitted, the default is to use the same namespace as where Network Observability is deployed. If the namespace is different, the config map or the secret is copied so that it can be mounted as required. |
|
|
|
Type for the file reference: |
17.1.34. .spec.exporters[].kafka.sasl.clientSecretReference
- Description
- Reference to the secret or config map containing the client secret
- Type
-
object
| Property | Type | Description |
|---|---|---|
|
|
| File name within the config map or secret. |
|
|
| Name of the config map or secret containing the file. |
|
|
| Namespace of the config map or secret containing the file. If omitted, the default is to use the same namespace as where Network Observability is deployed. If the namespace is different, the config map or the secret is copied so that it can be mounted as required. |
|
|
|
Type for the file reference: |
17.1.35. .spec.exporters[].kafka.tls
- Description
- TLS client configuration. When using TLS, verify that the address matches the Kafka port used for TLS, generally 9093.
- Type
-
object
| Property | Type | Description |
|---|---|---|
|
|
|
|
|
|
| Enable TLS |
|
|
|
|
|
|
|
|
17.1.36. .spec.exporters[].kafka.tls.caCert
- Description
-
caCertdefines the reference of the certificate for the Certificate Authority. - Type
-
object
| Property | Type | Description |
|---|---|---|
|
|
|
|
|
|
|
|
|
|
| Name of the config map or secret containing certificates. |
|
|
| Namespace of the config map or secret containing certificates. If omitted, the default is to use the same namespace as where Network Observability is deployed. If the namespace is different, the config map or the secret is copied so that it can be mounted as required. |
|
|
|
Type for the certificate reference: |
17.1.37. .spec.exporters[].kafka.tls.userCert
- Description
-
userCertdefines the user certificate reference and is used for mTLS. When you use one-way TLS, you can ignore this property. - Type
-
object
| Property | Type | Description |
|---|---|---|
|
|
|
|
|
|
|
|
|
|
| Name of the config map or secret containing certificates. |
|
|
| Namespace of the config map or secret containing certificates. If omitted, the default is to use the same namespace as where Network Observability is deployed. If the namespace is different, the config map or the secret is copied so that it can be mounted as required. |
|
|
|
Type for the certificate reference: |
17.1.38. .spec.exporters[].openTelemetry
- Description
- OpenTelemetry configuration, such as the IP address and port to send enriched logs or metrics to.
- Type
-
object - Required
-
targetHost -
targetPort
-
| Property | Type | Description |
|---|---|---|
|
|
| Custom fields mapping to an OpenTelemetry conformant format. By default, Network Observability format proposal is used: https://github.com/rhobs/observability-data-model/blob/main/network-observability.md#format-proposal . As there is currently no accepted standard for L3 or L4 enriched network logs, you can freely override it with your own. |
|
|
| Headers to add to messages (optional) |
|
|
| OpenTelemetry configuration for logs. |
|
|
| OpenTelemetry configuration for metrics. |
|
|
|
Protocol of the OpenTelemetry connection. The available options are |
|
|
| Address of the OpenTelemetry receiver. |
|
|
| Port for the OpenTelemetry receiver. |
|
|
| TLS client configuration. |
17.1.39. .spec.exporters[].openTelemetry.fieldsMapping
- Description
- Custom fields mapping to an OpenTelemetry conformant format. By default, Network Observability format proposal is used: https://github.com/rhobs/observability-data-model/blob/main/network-observability.md#format-proposal . As there is currently no accepted standard for L3 or L4 enriched network logs, you can freely override it with your own.
- Type
-
array
17.1.40. .spec.exporters[].openTelemetry.fieldsMapping[]
- Description
- Type
-
object
| Property | Type | Description |
|---|---|---|
|
|
| |
|
|
| |
|
|
|
17.1.41. .spec.exporters[].openTelemetry.logs
- Description
- OpenTelemetry configuration for logs.
- Type
-
object
| Property | Type | Description |
|---|---|---|
|
|
|
Set |
17.1.42. .spec.exporters[].openTelemetry.metrics
- Description
- OpenTelemetry configuration for metrics.
- Type
-
object
| Property | Type | Description |
|---|---|---|
|
|
|
Set |
|
|
| Specify how often metrics are sent to a collector. |
17.1.43. .spec.exporters[].openTelemetry.tls
- Description
- TLS client configuration.
- Type
-
object
| Property | Type | Description |
|---|---|---|
|
|
|
|
|
|
| Enable TLS |
|
|
|
|
|
|
|
|
17.1.44. .spec.exporters[].openTelemetry.tls.caCert
- Description
-
caCertdefines the reference of the certificate for the Certificate Authority. - Type
-
object
| Property | Type | Description |
|---|---|---|
|
|
|
|
|
|
|
|
|
|
| Name of the config map or secret containing certificates. |
|
|
| Namespace of the config map or secret containing certificates. If omitted, the default is to use the same namespace as where Network Observability is deployed. If the namespace is different, the config map or the secret is copied so that it can be mounted as required. |
|
|
|
Type for the certificate reference: |
17.1.45. .spec.exporters[].openTelemetry.tls.userCert
- Description
-
userCertdefines the user certificate reference and is used for mTLS. When you use one-way TLS, you can ignore this property. - Type
-
object
| Property | Type | Description |
|---|---|---|
|
|
|
|
|
|
|
|
|
|
| Name of the config map or secret containing certificates. |
|
|
| Namespace of the config map or secret containing certificates. If omitted, the default is to use the same namespace as where Network Observability is deployed. If the namespace is different, the config map or the secret is copied so that it can be mounted as required. |
|
|
|
Type for the certificate reference: |
17.1.46. .spec.kafka
- Description
-
Kafka configuration, allowing to use Kafka as a broker as part of the flow collection pipeline. Available when the
spec.deploymentModelisKafka. - Type
-
object - Required
-
address -
topic
-
| Property | Type | Description |
|---|---|---|
|
|
| Address of the Kafka server |
|
|
| SASL authentication configuration. Unsupported *. |
|
|
| TLS client configuration. When using TLS, verify that the address matches the Kafka port used for TLS, generally 9093. |
|
|
| Kafka topic to use. It must exist. Network Observability does not create it. |
17.1.47. .spec.kafka.sasl
- Description
- SASL authentication configuration. Unsupported *.
- Type
-
object
| Property | Type | Description |
|---|---|---|
|
|
| Reference to the secret or config map containing the client ID |
|
|
| Reference to the secret or config map containing the client secret |
|
|
|
Type of SASL authentication to use, or |
17.1.48. .spec.kafka.sasl.clientIDReference
- Description
- Reference to the secret or config map containing the client ID
- Type
-
object
| Property | Type | Description |
|---|---|---|
|
|
| File name within the config map or secret. |
|
|
| Name of the config map or secret containing the file. |
|
|
| Namespace of the config map or secret containing the file. If omitted, the default is to use the same namespace as where Network Observability is deployed. If the namespace is different, the config map or the secret is copied so that it can be mounted as required. |
|
|
|
Type for the file reference: |
17.1.49. .spec.kafka.sasl.clientSecretReference
- Description
- Reference to the secret or config map containing the client secret
- Type
-
object
| Property | Type | Description |
|---|---|---|
|
|
| File name within the config map or secret. |
|
|
| Name of the config map or secret containing the file. |
|
|
| Namespace of the config map or secret containing the file. If omitted, the default is to use the same namespace as where Network Observability is deployed. If the namespace is different, the config map or the secret is copied so that it can be mounted as required. |
|
|
|
Type for the file reference: |
17.1.50. .spec.kafka.tls
- Description
- TLS client configuration. When using TLS, verify that the address matches the Kafka port used for TLS, generally 9093.
- Type
-
object
| Property | Type | Description |
|---|---|---|
|
|
|
|
|
|
| Enable TLS |
|
|
|
|
|
|
|
|
17.1.51. .spec.kafka.tls.caCert
- Description
-
caCertdefines the reference of the certificate for the Certificate Authority. - Type
-
object
| Property | Type | Description |
|---|---|---|
|
|
|
|
|
|
|
|
|
|
| Name of the config map or secret containing certificates. |
|
|
| Namespace of the config map or secret containing certificates. If omitted, the default is to use the same namespace as where Network Observability is deployed. If the namespace is different, the config map or the secret is copied so that it can be mounted as required. |
|
|
|
Type for the certificate reference: |
17.1.52. .spec.kafka.tls.userCert
- Description
-
userCertdefines the user certificate reference and is used for mTLS. When you use one-way TLS, you can ignore this property. - Type
-
object
| Property | Type | Description |
|---|---|---|
|
|
|
|
|
|
|
|
|
|
| Name of the config map or secret containing certificates. |
|
|
| Namespace of the config map or secret containing certificates. If omitted, the default is to use the same namespace as where Network Observability is deployed. If the namespace is different, the config map or the secret is copied so that it can be mounted as required. |
|
|
|
Type for the certificate reference: |
17.1.53. .spec.loki
- Description
-
loki, the flow store, client settings. - Type
-
object - Required
-
mode
-
| Property | Type | Description |
|---|---|---|
|
|
|
|
|
|
|
Set |
|
|
|
Loki configuration for |
|
|
|
Loki configuration for |
|
|
|
Loki configuration for |
|
|
|
- Use
- Use
- Use
- Use |
|
|
|
Loki configuration for |
|
|
|
|
|
|
|
|
|
|
|
|
|
|
|
|
17.1.54. .spec.loki.advanced
- Description
-
advancedallows setting some aspects of the internal configuration of the Loki clients. This section is aimed mostly for debugging and fine-grained performance optimizations. - Type
-
object
| Property | Type | Description |
|---|---|---|
|
|
|
|
|
|
|
|
|
|
|
|
|
|
|
|
|
|
|
|
17.1.55. .spec.loki.lokiStack
- Description
-
Loki configuration for
LokiStackmode. This is useful for an easy Loki Operator configuration. It is ignored for other modes. - Type
-
object - Required
-
name
-
| Property | Type | Description |
|---|---|---|
|
|
| Name of an existing LokiStack resource to use. |
|
|
|
Namespace where this |
17.1.56. .spec.loki.manual
- Description
-
Loki configuration for
Manualmode. This is the most flexible configuration. It is ignored for other modes. - Type
-
object
| Property | Type | Description |
|---|---|---|
|
|
|
-
-
-
When using the Loki Operator, this must be set to |
|
|
|
|
|
|
|
|
|
|
| TLS client configuration for Loki status URL. |
|
|
|
|
|
|
|
|
|
|
| TLS client configuration for Loki URL. |
17.1.57. .spec.loki.manual.statusTls
- Description
- TLS client configuration for Loki status URL.
- Type
-
object
| Property | Type | Description |
|---|---|---|
|
|
|
|
|
|
| Enable TLS |
|
|
|
|
|
|
|
|
17.1.58. .spec.loki.manual.statusTls.caCert
- Description
-
caCertdefines the reference of the certificate for the Certificate Authority. - Type
-
object
| Property | Type | Description |
|---|---|---|
|
|
|
|
|
|
|
|
|
|
| Name of the config map or secret containing certificates. |
|
|
| Namespace of the config map or secret containing certificates. If omitted, the default is to use the same namespace as where Network Observability is deployed. If the namespace is different, the config map or the secret is copied so that it can be mounted as required. |
|
|
|
Type for the certificate reference: |
17.1.59. .spec.loki.manual.statusTls.userCert
- Description
-
userCertdefines the user certificate reference and is used for mTLS. When you use one-way TLS, you can ignore this property. - Type
-
object
| Property | Type | Description |
|---|---|---|
|
|
|
|
|
|
|
|
|
|
| Name of the config map or secret containing certificates. |
|
|
| Namespace of the config map or secret containing certificates. If omitted, the default is to use the same namespace as where Network Observability is deployed. If the namespace is different, the config map or the secret is copied so that it can be mounted as required. |
|
|
|
Type for the certificate reference: |
17.1.60. .spec.loki.manual.tls
- Description
- TLS client configuration for Loki URL.
- Type
-
object
| Property | Type | Description |
|---|---|---|
|
|
|
|
|
|
| Enable TLS |
|
|
|
|
|
|
|
|
17.1.61. .spec.loki.manual.tls.caCert
- Description
-
caCertdefines the reference of the certificate for the Certificate Authority. - Type
-
object
| Property | Type | Description |
|---|---|---|
|
|
|
|
|
|
|
|
|
|
| Name of the config map or secret containing certificates. |
|
|
| Namespace of the config map or secret containing certificates. If omitted, the default is to use the same namespace as where Network Observability is deployed. If the namespace is different, the config map or the secret is copied so that it can be mounted as required. |
|
|
|
Type for the certificate reference: |
17.1.62. .spec.loki.manual.tls.userCert
- Description
-
userCertdefines the user certificate reference and is used for mTLS. When you use one-way TLS, you can ignore this property. - Type
-
object
| Property | Type | Description |
|---|---|---|
|
|
|
|
|
|
|
|
|
|
| Name of the config map or secret containing certificates. |
|
|
| Namespace of the config map or secret containing certificates. If omitted, the default is to use the same namespace as where Network Observability is deployed. If the namespace is different, the config map or the secret is copied so that it can be mounted as required. |
|
|
|
Type for the certificate reference: |
17.1.63. .spec.loki.microservices
- Description
-
Loki configuration for
Microservicesmode. Use this option when Loki is installed using the microservices deployment mode (https://grafana.com/docs/loki/latest/fundamentals/architecture/deployment-modes/#microservices-mode). It is ignored for other modes. - Type
-
object
| Property | Type | Description |
|---|---|---|
|
|
|
|
|
|
|
|
|
|
|
|
|
|
| TLS client configuration for Loki URL. |
17.1.64. .spec.loki.microservices.tls
- Description
- TLS client configuration for Loki URL.
- Type
-
object
| Property | Type | Description |
|---|---|---|
|
|
|
|
|
|
| Enable TLS |
|
|
|
|
|
|
|
|
17.1.65. .spec.loki.microservices.tls.caCert
- Description
-
caCertdefines the reference of the certificate for the Certificate Authority. - Type
-
object
| Property | Type | Description |
|---|---|---|
|
|
|
|
|
|
|
|
|
|
| Name of the config map or secret containing certificates. |
|
|
| Namespace of the config map or secret containing certificates. If omitted, the default is to use the same namespace as where Network Observability is deployed. If the namespace is different, the config map or the secret is copied so that it can be mounted as required. |
|
|
|
Type for the certificate reference: |
17.1.66. .spec.loki.microservices.tls.userCert
- Description
-
userCertdefines the user certificate reference and is used for mTLS. When you use one-way TLS, you can ignore this property. - Type
-
object
| Property | Type | Description |
|---|---|---|
|
|
|
|
|
|
|
|
|
|
| Name of the config map or secret containing certificates. |
|
|
| Namespace of the config map or secret containing certificates. If omitted, the default is to use the same namespace as where Network Observability is deployed. If the namespace is different, the config map or the secret is copied so that it can be mounted as required. |
|
|
|
Type for the certificate reference: |
17.1.67. .spec.loki.monolithic
- Description
-
Loki configuration for
Monolithicmode. Use this option when Loki is installed using the monolithic deployment mode (https://grafana.com/docs/loki/latest/fundamentals/architecture/deployment-modes/#monolithic-mode). It is ignored for other modes. - Type
-
object
| Property | Type | Description |
|---|---|---|
|
|
|
Set |
|
|
|
|
|
|
| TLS client configuration for Loki URL. |
|
|
|
|
17.1.68. .spec.loki.monolithic.tls
- Description
- TLS client configuration for Loki URL.
- Type
-
object
| Property | Type | Description |
|---|---|---|
|
|
|
|
|
|
| Enable TLS |
|
|
|
|
|
|
|
|
17.1.69. .spec.loki.monolithic.tls.caCert
- Description
-
caCertdefines the reference of the certificate for the Certificate Authority. - Type
-
object
| Property | Type | Description |
|---|---|---|
|
|
|
|
|
|
|
|
|
|
| Name of the config map or secret containing certificates. |
|
|
| Namespace of the config map or secret containing certificates. If omitted, the default is to use the same namespace as where Network Observability is deployed. If the namespace is different, the config map or the secret is copied so that it can be mounted as required. |
|
|
|
Type for the certificate reference: |
17.1.70. .spec.loki.monolithic.tls.userCert
- Description
-
userCertdefines the user certificate reference and is used for mTLS. When you use one-way TLS, you can ignore this property. - Type
-
object
| Property | Type | Description |
|---|---|---|
|
|
|
|
|
|
|
|
|
|
| Name of the config map or secret containing certificates. |
|
|
| Namespace of the config map or secret containing certificates. If omitted, the default is to use the same namespace as where Network Observability is deployed. If the namespace is different, the config map or the secret is copied so that it can be mounted as required. |
|
|
|
Type for the certificate reference: |
17.1.71. .spec.networkPolicy
- Description
-
networkPolicydefines network policy settings for Network Observability components isolation. - Type
-
object
| Property | Type | Description |
|---|---|---|
|
|
|
|
|
|
| Deploys network policies on the namespaces used by Network Observability (main and privileged). These network policies better isolate the Network Observability components to prevent undesired connections from and to them. This option is enabled by default when using with OVNKubernetes, and disabled otherwise (it has not been tested with other CNIs). When disabled, you can manually create the network policies for the Network Observability components. |
17.1.72. .spec.processor
- Description
-
processordefines the settings of the component that receives the flows from the agent, enriches them, generates metrics, and forwards them to the Loki persistence layer and/or any available exporter. - Type
-
object
| Property | Type | Description |
|---|---|---|
|
|
|
|
|
|
|
|
|
|
|
|
|
|
|
|
|
|
|
|
|
|
|
|
|
|
|
|
|
|
|
|
|
|
|
|
|
|
|
|
|
|
|
|
|
|
|
|
|
|
|
-
-
-
- |
|
|
|
|
|
|
|
Set |
|
|
|
|
|
|
| Global configuration managing FlowCollectorSlices custom resources. |
|
|
|
|
|
|
|
If |
17.1.73. .spec.processor.advanced
- Description
-
advancedallows setting some aspects of the internal configuration of the flow processor. This section is aimed mostly for debugging and fine-grained performance optimizations, such asGOGCandGOMAXPROCSenvironment variables. Set these values at your own risk. - Type
-
object
| Property | Type | Description |
|---|---|---|
|
|
|
|
|
|
|
|
|
|
|
|
|
|
|
|
|
|
|
|
|
|
|
|
|
|
|
|
|
|
| Port of the flow collector (host port). By convention, some values are forbidden. It must be greater than 1024 and different from 4500, 4789 and 6081. |
|
|
|
|
|
|
| scheduling controls how the pods are scheduled on nodes. |
|
|
| Defines secondary networks to be checked for resources identification. To guarantee a correct identification, indexed values must form an unique identifier across the cluster. If the same index is used by several resources, those resources might be incorrectly labeled. |
17.1.74. .spec.processor.advanced.scheduling
- Description
- scheduling controls how the pods are scheduled on nodes.
- Type
-
object
| Property | Type | Description |
|---|---|---|
|
|
| If specified, the pod’s scheduling constraints. For documentation, refer to https://kubernetes.io/docs/reference/kubernetes-api/workload-resources/pod-v1/#scheduling. |
|
|
|
|
|
|
| If specified, indicates the pod’s priority. For documentation, refer to https://kubernetes.io/docs/concepts/scheduling-eviction/pod-priority-preemption/#how-to-use-priority-and-preemption. If not specified, default priority is used, or zero if there is no default. |
|
|
|
|
17.1.75. .spec.processor.advanced.scheduling.affinity
- Description
- If specified, the pod’s scheduling constraints. For documentation, refer to https://kubernetes.io/docs/reference/kubernetes-api/workload-resources/pod-v1/#scheduling.
- Type
-
object
17.1.76. .spec.processor.advanced.scheduling.tolerations
- Description
-
tolerationsis a list of tolerations that allow the pod to schedule onto nodes with matching taints. For documentation, refer to https://kubernetes.io/docs/reference/kubernetes-api/workload-resources/pod-v1/#scheduling. - Type
-
array
17.1.77. .spec.processor.advanced.secondaryNetworks
- Description
- Defines secondary networks to be checked for resources identification. To guarantee a correct identification, indexed values must form an unique identifier across the cluster. If the same index is used by several resources, those resources might be incorrectly labeled.
- Type
-
array
17.1.78. .spec.processor.advanced.secondaryNetworks[]
- Description
- Type
-
object - Required
-
index -
name
-
| Property | Type | Description |
|---|---|---|
|
|
|
|
|
|
|
|
17.1.79. .spec.processor.deduper
- Description
-
deduperallows you to sample or drop flows identified as duplicates, in order to save on resource usage. Unsupported *. - Type
-
object
| Property | Type | Description |
|---|---|---|
|
|
|
Set the Processor de-duplication mode. It comes in addition to the Agent-based deduplication because the Agent cannot de-duplicate same flows reported from different nodes.
- Use
- Use
- Use |
|
|
|
|
17.1.80. .spec.processor.filters
- Description
-
filterslets you define custom filters to limit the amount of generated flows. These filters provide more flexibility than the eBPF Agent filters (inspec.agent.ebpf.flowFilter), such as allowing to filter by Kubernetes namespace, but with a lesser improvement in performance. Unsupported *. - Type
-
array
17.1.81. .spec.processor.filters[]
- Description
-
FLPFilterSetdefines the desired configuration for FLP-based filtering satisfying all conditions. - Type
-
object
| Property | Type | Description |
|---|---|---|
|
|
|
|
|
|
|
If specified, these filters only target a single output: |
|
|
|
|
17.1.82. .spec.processor.kafkaConsumerAutoscaler
- Description
-
kafkaConsumerAutoscaler[deprecated (*)] is the spec of a horizontal pod autoscaler to set up forflowlogs-pipeline-transformer, which consumes Kafka messages. This setting is ignored when Kafka is disabled. Deprecation notice: managed autoscaler will be removed in a future version. You might configure instead an autoscaler of your choice, and setspec.processor.unmanagedReplicastotrue. Refer to HorizontalPodAutoscaler documentation (autoscaling/v2). - Type
-
object
17.1.83. .spec.processor.metrics
- Description
-
Metricsdefine the processor configuration regarding metrics - Type
-
object
| Property | Type | Description |
|---|---|---|
|
|
|
|
|
|
|
|
|
|
|
|
|
|
| Metrics server endpoint configuration for Prometheus scraper |
17.1.84. .spec.processor.metrics.healthRules
- Description
-
healthRulesis a list of health rules to be created for Prometheus, organized by templates and variants. Each health rule can be configured to generate either alerts or recording rules based on the mode field. More information on health rules: https://github.com/netobserv/network-observability-operator/blob/main/docs/HealthRules.md - Type
-
array
17.1.85. .spec.processor.metrics.healthRules[]
- Description
- Type
-
object - Required
-
template -
variants
-
| Property | Type | Description |
|---|---|---|
|
|
|
Mode defines whether this health rule should be generated as an alert or a recording rule. Possible values are: |
|
|
|
Health rule template name. Possible values are: |
|
|
| A list of variants for this template |
17.1.86. .spec.processor.metrics.healthRules[].variants
- Description
- A list of variants for this template
- Type
-
array
17.1.87. .spec.processor.metrics.healthRules[].variants[]
- Description
- Type
-
object - Required
-
thresholds
-
| Property | Type | Description |
|---|---|---|
|
|
|
Optional grouping criteria, possible values are: |
|
|
| The low volume threshold allows to ignore metrics with a too low volume of traffic, in order to improve signal-to-noise. It is provided as an absolute rate (bytes per second or packets per second, depending on the context). When provided, it must be parsable as a float. |
|
|
|
Mode overrides the health rule mode for this specific variant. If not specified, inherits from the parent health rule’s mode. Possible values are: |
|
|
| Thresholds of the health rule per severity. They are expressed as a percentage of errors above which the alert is triggered. They must be parsable as floats. Required for both alert and recording modes |
|
|
| For trending health rules, the duration interval for baseline comparison. For example, "2h" means comparing against a 2-hours average. Defaults to 2h. |
|
|
| For trending health rules, the time offset for baseline comparison. For example, "1d" means comparing against yesterday. Defaults to 1d. |
17.1.88. .spec.processor.metrics.healthRules[].variants[].thresholds
- Description
- Thresholds of the health rule per severity. They are expressed as a percentage of errors above which the alert is triggered. They must be parsable as floats. Required for both alert and recording modes
- Type
-
object
| Property | Type | Description |
|---|---|---|
|
|
|
Threshold for severity |
|
|
|
Threshold for severity |
|
|
|
Threshold for severity |
17.1.89. .spec.processor.metrics.server
- Description
- Metrics server endpoint configuration for Prometheus scraper
- Type
-
object
| Property | Type | Description |
|---|---|---|
|
|
| The metrics server HTTP port. |
|
|
| TLS configuration. |
17.1.90. .spec.processor.metrics.server.tls
- Description
- TLS configuration.
- Type
-
object - Required
-
type
-
| Property | Type | Description |
|---|---|---|
|
|
|
|
|
|
|
TLS configuration when |
|
|
|
Reference to the CA file when |
|
|
|
Select the type of TLS configuration:
- |
17.1.91. .spec.processor.metrics.server.tls.provided
- Description
-
TLS configuration when
typeis set toProvided. - Type
-
object
| Property | Type | Description |
|---|---|---|
|
|
|
|
|
|
|
|
|
|
| Name of the config map or secret containing certificates. |
|
|
| Namespace of the config map or secret containing certificates. If omitted, the default is to use the same namespace as where Network Observability is deployed. If the namespace is different, the config map or the secret is copied so that it can be mounted as required. |
|
|
|
Type for the certificate reference: |
17.1.92. .spec.processor.metrics.server.tls.providedCaFile
- Description
-
Reference to the CA file when
typeis set toProvided. - Type
-
object
| Property | Type | Description |
|---|---|---|
|
|
| File name within the config map or secret. |
|
|
| Name of the config map or secret containing the file. |
|
|
| Namespace of the config map or secret containing the file. If omitted, the default is to use the same namespace as where Network Observability is deployed. If the namespace is different, the config map or the secret is copied so that it can be mounted as required. |
|
|
|
Type for the file reference: |
17.1.93. .spec.processor.resources
- Description
-
resourcesare the compute resources required by this container. For more information, see https://kubernetes.io/docs/concepts/configuration/manage-resources-containers/ - Type
-
object
| Property | Type | Description |
|---|---|---|
|
|
| Limits describes the maximum amount of compute resources allowed. More info: https://kubernetes.io/docs/concepts/configuration/manage-resources-containers/ |
|
|
| Requests describes the minimum amount of compute resources required. If Requests is omitted for a container, it defaults to Limits if that is explicitly specified, otherwise to an implementation-defined value. Requests cannot exceed Limits. More info: https://kubernetes.io/docs/concepts/configuration/manage-resources-containers/ |
17.1.94. .spec.processor.slicesConfig
- Description
- Global configuration managing FlowCollectorSlices custom resources.
- Type
-
object - Required
-
enable
-
| Property | Type | Description |
|---|---|---|
|
|
|
- When set to
- When set to |
|
|
|
|
|
|
|
|
17.1.95. .spec.processor.subnetLabels
- Description
-
subnetLabelsallows to define custom labels on subnets and IPs or to enable automatic labeling of recognized subnets in OpenShift Container Platform, which is used to identify cluster external traffic. When a subnet matches the source or destination IP of a flow, a corresponding field is added:SrcSubnetLabelorDstSubnetLabel. - Type
-
object
| Property | Type | Description |
|---|---|---|
|
|
|
If
If |
|
|
|
|
17.1.96. .spec.processor.subnetLabels.customLabels
- Description
customLabelsallows you to customize subnets and IPs labeling, such as to identify cluster external workloads or web services. External subnets must be labeled with the prefixEXT:, or not labeled at all, in order to work with default quick filters and some metrics examples provided.
If
openShiftAutoDetectis disabled or you are not using OpenShift Container Platform, it is recommended to manually configure labels for the cluster subnets, to distinguish internal traffic from external traffic.
If
openShiftAutoDetectis enabled,customLabelsoverrides the detected subnets when they overlap.
- Type
-
array
17.1.97. .spec.processor.subnetLabels.customLabels[]
- Description
- SubnetLabel allows to label subnets and IPs, such as to identify cluster-external workloads or web services.
- Type
-
object - Required
-
cidrs -
name
-
| Property | Type | Description |
|---|---|---|
|
|
|
List of CIDRs, such as |
|
|
|
Label name, used to flag matching flows. External subnets must be labeled with the prefix |
17.1.98. .spec.prometheus
- Description
-
prometheusdefines Prometheus settings, such as querier configuration used to fetch metrics from the Console plugin. - Type
-
object
| Property | Type | Description |
|---|---|---|
|
|
| Prometheus querying configuration, such as client settings, used in the Console plugin. |
17.1.99. .spec.prometheus.querier
- Description
- Prometheus querying configuration, such as client settings, used in the Console plugin.
- Type
-
object - Required
-
mode
-
| Property | Type | Description |
|---|---|---|
|
|
|
When |
|
|
|
Prometheus configuration for |
|
|
|
- Use
- Use |
|
|
|
|
17.1.100. .spec.prometheus.querier.manual
- Description
-
Prometheus configuration for
Manualmode. - Type
-
object
| Property | Type | Description |
|---|---|---|
|
|
| AlertManager configuration. This is used in the console to query silenced alerts, for displaying health information. When used in OpenShift Container Platform it can be left empty to use the Console API instead. [Unsupported (*)]. |
|
|
|
Set |
|
|
| TLS client configuration for Prometheus URL. |
|
|
|
|
17.1.101. .spec.prometheus.querier.manual.alertManager
- Description
- AlertManager configuration. This is used in the console to query silenced alerts, for displaying health information. When used in OpenShift Container Platform it can be left empty to use the Console API instead. [Unsupported (*)].
- Type
-
object
| Property | Type | Description |
|---|---|---|
|
|
| TLS client configuration for Prometheus AlertManager URL. |
|
|
|
|
17.1.102. .spec.prometheus.querier.manual.alertManager.tls
- Description
- TLS client configuration for Prometheus AlertManager URL.
- Type
-
object
| Property | Type | Description |
|---|---|---|
|
|
|
|
|
|
| Enable TLS |
|
|
|
|
|
|
|
|
17.1.103. .spec.prometheus.querier.manual.alertManager.tls.caCert
- Description
-
caCertdefines the reference of the certificate for the Certificate Authority. - Type
-
object
| Property | Type | Description |
|---|---|---|
|
|
|
|
|
|
|
|
|
|
| Name of the config map or secret containing certificates. |
|
|
| Namespace of the config map or secret containing certificates. If omitted, the default is to use the same namespace as where Network Observability is deployed. If the namespace is different, the config map or the secret is copied so that it can be mounted as required. |
|
|
|
Type for the certificate reference: |
17.1.104. .spec.prometheus.querier.manual.alertManager.tls.userCert
- Description
-
userCertdefines the user certificate reference and is used for mTLS. When you use one-way TLS, you can ignore this property. - Type
-
object
| Property | Type | Description |
|---|---|---|
|
|
|
|
|
|
|
|
|
|
| Name of the config map or secret containing certificates. |
|
|
| Namespace of the config map or secret containing certificates. If omitted, the default is to use the same namespace as where Network Observability is deployed. If the namespace is different, the config map or the secret is copied so that it can be mounted as required. |
|
|
|
Type for the certificate reference: |
17.1.105. .spec.prometheus.querier.manual.tls
- Description
- TLS client configuration for Prometheus URL.
- Type
-
object
| Property | Type | Description |
|---|---|---|
|
|
|
|
|
|
| Enable TLS |
|
|
|
|
|
|
|
|
17.1.106. .spec.prometheus.querier.manual.tls.caCert
- Description
-
caCertdefines the reference of the certificate for the Certificate Authority. - Type
-
object
| Property | Type | Description |
|---|---|---|
|
|
|
|
|
|
|
|
|
|
| Name of the config map or secret containing certificates. |
|
|
| Namespace of the config map or secret containing certificates. If omitted, the default is to use the same namespace as where Network Observability is deployed. If the namespace is different, the config map or the secret is copied so that it can be mounted as required. |
|
|
|
Type for the certificate reference: |
17.1.107. .spec.prometheus.querier.manual.tls.userCert
- Description
-
userCertdefines the user certificate reference and is used for mTLS. When you use one-way TLS, you can ignore this property. - Type
-
object
| Property | Type | Description |
|---|---|---|
|
|
|
|
|
|
|
|
|
|
| Name of the config map or secret containing certificates. |
|
|
| Namespace of the config map or secret containing certificates. If omitted, the default is to use the same namespace as where Network Observability is deployed. If the namespace is different, the config map or the secret is copied so that it can be mounted as required. |
|
|
|
Type for the certificate reference: |
Chapter 18. FlowMetric configuration parameters
The FlowMetric API is used to generate custom observability metrics from collected network flow logs.
18.1. FlowMetric [flows.netobserv.io/v1alpha1]
- Description
- FlowMetric is the API allowing to create custom metrics from the collected flow logs.
- Type
-
object
| Property | Type | Description |
|---|---|---|
|
|
| APIVersion defines the versioned schema of this representation of an object. Servers should convert recognized schemas to the latest internal value, and might reject unrecognized values. More info: https://git.k8s.io/community/contributors/devel/sig-architecture/api-conventions.md#resources |
|
|
| Kind is a string value representing the REST resource this object represents. Servers might infer this from the endpoint the client submits requests to. Cannot be updated. In CamelCase. More info: https://git.k8s.io/community/contributors/devel/sig-architecture/api-conventions.md#types-kinds |
|
|
| Standard object’s metadata. More info: https://git.k8s.io/community/contributors/devel/sig-architecture/api-conventions.md#metadata |
|
|
|
FlowMetricSpec defines the desired state of FlowMetric The provided API allows you to customize these metrics according to your needs.
When adding new metrics or modifying existing labels, you must carefully monitor the memory usage of Prometheus workloads as this could potentially have a high impact. Cf https://rhobs-handbook.netlify.app/products/openshiftmonitoring/telemetry.md/#what-is-the-cardinality-of-a-metric
To check the cardinality of all Network Observability metrics, run as |
18.1.1. .metadata
- Description
- Standard object’s metadata. More info: https://git.k8s.io/community/contributors/devel/sig-architecture/api-conventions.md#metadata
- Type
-
object
18.1.2. .spec
- Description
FlowMetricSpec defines the desired state of FlowMetric The provided API allows you to customize these metrics according to your needs.
When adding new metrics or modifying existing labels, you must carefully monitor the memory usage of Prometheus workloads as this could potentially have a high impact. Cf https://rhobs-handbook.netlify.app/products/openshiftmonitoring/telemetry.md/#what-is-the-cardinality-of-a-metric
To check the cardinality of all Network Observability metrics, run as
promql:count({name=~"netobserv.*"}) by (name).- Type
-
object - Required
-
type
-
| Property | Type | Description |
|---|---|---|
|
|
|
A list of buckets to use when |
|
|
| Charts configuration, for the OpenShift Container Platform Console in the administrator view, Dashboards menu. |
|
|
|
Filter for ingress, egress or any direction flows. When set to |
|
|
| When nonzero, scale factor (divider) of the value. Metric value = Flow value / Divider. |
|
|
|
|
|
|
|
|
|
|
| Help text of the metric, as it appears in Prometheus. |
|
|
|
|
|
|
|
Name of the metric. In Prometheus, it is automatically prefixed with "netobserv_". Leave empty to generate the name based on the |
|
|
|
Set the |
|
|
| Metric type: "Counter" or "Histogram". Use "Counter" for any value that increases over time and on which you can compute a rate, such as Bytes or Packets. Use "Histogram" for any value that must be sampled independently, such as latencies. |
|
|
|
|
18.1.3. .spec.charts
- Description
- Charts configuration, for the OpenShift Container Platform Console in the administrator view, Dashboards menu.
- Type
-
array
18.1.4. .spec.charts[]
- Description
- Configures charts / dashboard generation associated to a metric
- Type
-
object - Required
-
dashboardName -
queries -
title -
type
-
| Property | Type | Description |
|---|---|---|
|
|
| Name of the containing dashboard. If this name does not refer to an existing dashboard, a new dashboard is created. |
|
|
|
List of queries to be displayed on this chart. If |
|
|
|
Name of the containing dashboard section. If this name does not refer to an existing section, a new section is created. If |
|
|
| Title of the chart. |
|
|
| Type of the chart. |
|
|
| Unit of this chart. Only a few units are currently supported. Leave empty to use generic number. |
18.1.5. .spec.charts[].queries
- Description
-
List of queries to be displayed on this chart. If
typeisSingleStatand multiple queries are provided, this chart is automatically expanded in several panels (one per query). - Type
-
array
18.1.6. .spec.charts[].queries[]
- Description
- Configures PromQL queries
- Type
-
object - Required
-
legend -
promQL -
top
-
| Property | Type | Description |
|---|---|---|
|
|
|
The query legend that applies to each timeseries represented in this chart. When multiple timeseries are displayed, you should set a legend that distinguishes each of them. It can be done with the following format: |
|
|
|
The |
|
|
|
Top N series to display per timestamp. Does not apply to |
18.1.7. .spec.filters
- Description
-
filtersis a list of fields and values used to restrict which flows are taken into account. Refer to the documentation for the list of available fields: https://docs.redhat.com/en/documentation/openshift_container_platform/latest/html/network_observability/json-flows-format-reference. - Type
-
array
18.1.8. .spec.filters[]
- Description
- Type
-
object - Required
-
field -
matchType
-
| Property | Type | Description |
|---|---|---|
|
|
|
Name of the field to filter on (for example: |
|
|
| Type of matching to apply |
|
|
|
Value to filter on. When |
Chapter 19. Network flows format reference
Review the specifications for the network flow format, which is used internally and for exporting flow data to Kafka.
19.1. Network Flows format reference
This is the specification of the network flows format. That format is used when a Kafka exporter is configured, for Prometheus metrics labels as well as internally for the Loki store.
The "Filter ID" column shows which related name to use when defining Quick Filters (see spec.consolePlugin.quickFilters in the FlowCollector specification).
The "Loki label" column is useful when querying Loki directly: label fields need to be selected using stream selectors.
The "Cardinality" column gives information about the implied metric cardinality if this field was to be used as a Prometheus label with the FlowMetrics API. Refer to the FlowMetrics documentation for more information on using this API.
| Name | Type | Description | Filter ID | Loki label | Cardinality | OpenTelemetry |
|---|---|---|---|---|---|---|
|
| number | Number of bytes | n/a | no | avoid | bytes |
|
| number | Error number returned from DNS tracker ebpf hook function |
| no | fine | dns.errno |
|
| number | DNS flags for DNS record | n/a | no | fine | dns.flags |
|
| string | Parsed DNS header RCODEs name |
| no | fine | dns.responsecode |
|
| number | DNS record id |
| no | avoid | dns.id |
|
| number | Time between a DNS request and response, in milliseconds |
| no | avoid | dns.latency |
|
| string | DNS queried name |
| no | careful | n/a |
|
| number | Differentiated Services Code Point (DSCP) value |
| no | fine | dscp |
|
| string | Destination IP address (ipv4 or ipv6) |
| no | avoid | destination.address |
|
| string | Destination node IP |
| no | fine | destination.k8s.host.address |
|
| string | Destination node name |
| no | fine | destination.k8s.host.name |
|
| string | Name of the destination Kubernetes object, such as Pod name, Service name or Node name. |
| no | careful | destination.k8s.name |
|
| string | Destination namespace |
| yes | fine | destination.k8s.namespace.name |
|
| string | Destination network name |
| no | fine | n/a |
|
| string | Name of the destination owner, such as Deployment name, StatefulSet name, etc. |
| yes | fine | destination.k8s.owner.name |
|
| string | Kind of the destination owner, such as Deployment, StatefulSet, etc. |
| no | fine | destination.k8s.owner.kind |
|
| string | Kind of the destination Kubernetes object, such as Pod, Service or Node. |
| yes | fine | destination.k8s.kind |
|
| string | Destination availability zone |
| yes | fine | destination.zone |
|
| string | Destination MAC address |
| no | avoid | destination.mac |
|
| number | Destination port |
| no | careful | destination.port |
|
| string | Destination subnet label |
| no | fine | destination.subnet.label |
|
| string[] |
List of TCP flags comprised in the flow, according to RFC-9293, with additional custom flags to represent the following per-packet combinations: |
| no | careful | tcp.flags |
|
| number |
Flow interpreted direction from the node observation point. Can be one of: |
| yes | fine | host.direction |
|
| number | ICMP code |
| no | fine | icmp.code |
|
| number | ICMP type |
| no | fine | icmp.type |
|
| number[] |
Flow directions from the network interface observation point. Can be one of: |
| no | fine | interface.directions |
|
| string[] | Network interfaces |
| no | careful | interface.names |
|
| string | Cluster name or identifier |
| yes | fine | k8s.cluster.name |
|
| string | Flow layer: 'app' or 'infra' |
| yes | fine | k8s.layer |
|
| object[] |
Network events, such as network policy actions, composed of nested fields: |
| no | avoid | n/a |
|
| number | Number of packets |
| no | avoid | packets |
|
| number | Number of bytes dropped by the kernel | n/a | no | avoid | drops.bytes |
|
| string | Latest drop cause |
| no | fine | drops.latestcause |
|
| number | TCP flags on last dropped packet | n/a | no | fine | drops.latestflags |
|
| string | TCP state on last dropped packet |
| no | fine | drops.lateststate |
|
| number | Number of packets dropped by the kernel | n/a | no | avoid | drops.packets |
|
| number | L4 protocol |
| no | fine | protocol |
|
| number | Sampling interval used for this flow | n/a | no | fine | n/a |
|
| string | Source IP address (ipv4 or ipv6) |
| no | avoid | source.address |
|
| string | Source node IP |
| no | fine | source.k8s.host.address |
|
| string | Source node name |
| no | fine | source.k8s.host.name |
|
| string | Name of the source Kubernetes object, such as Pod name, Service name or Node name. |
| no | careful | source.k8s.name |
|
| string | Source namespace |
| yes | fine | source.k8s.namespace.name |
|
| string | Source network name |
| no | fine | n/a |
|
| string | Name of the source owner, such as Deployment name, StatefulSet name, etc. |
| yes | fine | source.k8s.owner.name |
|
| string | Kind of the source owner, such as Deployment, StatefulSet, etc. |
| no | fine | source.k8s.owner.kind |
|
| string | Kind of the source Kubernetes object, such as Pod, Service or Node. |
| yes | fine | source.k8s.kind |
|
| string | Source availability zone |
| yes | fine | source.zone |
|
| string | Source MAC address |
| no | avoid | source.mac |
|
| number | Source port |
| no | careful | source.port |
|
| string | Source subnet label |
| no | fine | source.subnet.label |
|
| number | End timestamp of this flow, in milliseconds | n/a | no | avoid | timeflowend |
|
| number | TCP Smoothed Round Trip Time (SRTT), in nanoseconds |
| no | avoid | tcp.rtt |
|
| number | Start timestamp of this flow, in milliseconds | n/a | no | avoid | timeflowstart |
|
| number | Timestamp when this flow was received and processed by the flow collector, in seconds | n/a | no | avoid | timereceived |
|
| string[] | List of User Defined Networks |
| no | careful | n/a |
|
| string | Packet translation destination address |
| no | avoid | n/a |
|
| number | Packet translation destination port |
| no | careful | n/a |
|
| string | Packet translation source address |
| no | avoid | n/a |
|
| number | Packet translation source port |
| no | careful | n/a |
|
| number | Packet translation zone id |
| no | avoid | n/a |
|
| string | In conversation tracking, the conversation identifier |
| no | avoid | n/a |
|
| string |
Type of record: |
| yes | fine | n/a |
Chapter 20. Troubleshooting network observability
Perform diagnostic actions to troubleshoot common issues related to the Network Observability Operator and its components.
20.1. Using the must-gather tool
You can use the must-gather tool to collect information about the Network Observability Operator resources and cluster-wide resources, such as pod logs, FlowCollector, and webhook configurations.
Procedure
- Navigate to the directory where you want to store the must-gather data.
Run the following command to collect cluster-wide must-gather resources:
$ oc adm must-gather --image-stream=openshift/must-gather \ --image=quay.io/netobserv/must-gather
20.2. Configuring network traffic menu entry in the OpenShift Container Platform console
Manually configure the network traffic menu entry in the OpenShift Container Platform console when the network traffic menu entry is not listed in Observe menu in the OpenShift Container Platform console.
Prerequisites
- You have installed OpenShift Container Platform version 4.10 or newer.
Procedure
Check if the
spec.consolePlugin.registerfield is set totrueby running the following command:$ oc -n netobserv get flowcollector cluster -o yamlExample output
apiVersion: flows.netobserv.io/v1alpha1 kind: FlowCollector metadata: name: cluster spec: consolePlugin: register: falseOptional: Add the
netobserv-pluginplugin by manually editing the Console Operator config:$ oc edit console.operator.openshift.io clusterExample output
... spec: plugins: - netobserv-plugin ...Optional: Set the
spec.consolePlugin.registerfield totrueby running the following command:$ oc -n netobserv edit flowcollector cluster -o yamlExample output
apiVersion: flows.netobserv.io/v1alpha1 kind: FlowCollector metadata: name: cluster spec: consolePlugin: register: trueEnsure the status of console pods is
runningby running the following command:$ oc get pods -n openshift-console -l app=consoleRestart the console pods by running the following command:
$ oc delete pods -n openshift-console -l app=console- Clear your browser cache and history.
Check the status of network observability plugin pods by running the following command:
$ oc get pods -n netobserv -l app=netobserv-pluginExample output
NAME READY STATUS RESTARTS AGE netobserv-plugin-68c7bbb9bb-b69q6 1/1 Running 0 21sCheck the logs of the network observability plugin pods by running the following command:
$ oc logs -n netobserv -l app=netobserv-pluginExample output
time="2022-12-13T12:06:49Z" level=info msg="Starting netobserv-console-plugin [build version: , build date: 2022-10-21 15:15] at log level info" module=main time="2022-12-13T12:06:49Z" level=info msg="listening on https://:9001" module=server
20.3. Flowlogs-Pipeline does not consume network flows after installing Kafka
If you deployed the flow collector first with deploymentModel: KAFKA and then deployed Kafka, the flow collector might not connect correctly to Kafka. Manually restart the flow-pipeline pods where Flowlogs-pipeline does not consume network flows from Kafka.
Procedure
Delete the flow-pipeline pods to restart them by running the following command:
$ oc delete pods -n netobserv -l app=flowlogs-pipeline-transformer
20.4. Failing to see network flows from both br-int and br-ex interfaces
br-ex` and br-int are virtual bridge devices operated at OSI layer 2. The eBPF agent works at the IP and TCP levels, layers 3 and 4 respectively. You can expect that the eBPF agent captures the network traffic passing through br-ex and br-int, when the network traffic is processed by other interfaces such as physical host or virtual pod interfaces. If you restrict the eBPF agent network interfaces to attach only to br-ex and br-int, you do not see any network flow.
Manually remove the part in the interfaces or excludeInterfaces that restricts the network interfaces to br-int and br-ex.
Procedure
Remove the
interfaces: [ 'br-int', 'br-ex' ]field. This allows the agent to fetch information from all the interfaces. Alternatively, you can specify the Layer-3 interface for example,eth0. Run the following command:$ oc edit -n netobserv flowcollector.yaml -o yamlExample output
apiVersion: flows.netobserv.io/v1alpha1 kind: FlowCollector metadata: name: cluster spec: agent: type: EBPF ebpf: interfaces: [ 'br-int', 'br-ex' ]1 - 1
- Specifies the network interfaces.
20.5. Network observability controller manager pod runs out of memory
You can increase memory limits for the Network Observability Operator by editing the spec.config.resources.limits.memory specification in the Subscription object.
Procedure
- In the web console, navigate to Operators → Installed Operators
- Click Network Observability and then select Subscription.
From the Actions menu, click Edit Subscription.
Alternatively, you can use the CLI to open the YAML configuration for the
Subscriptionobject by running the following command:$ oc edit subscription netobserv-operator -n openshift-netobserv-operator
Edit the
Subscriptionobject to add theconfig.resources.limits.memoryspecification and set the value to account for your memory requirements. See the Additional resources for more information about resource considerations:apiVersion: operators.coreos.com/v1alpha1 kind: Subscription metadata: name: netobserv-operator namespace: openshift-netobserv-operator spec: channel: stable config: resources: limits: memory: 800Mi1 requests: cpu: 100m memory: 100Mi installPlanApproval: Automatic name: netobserv-operator source: redhat-operators sourceNamespace: openshift-marketplace startingCSV: <network_observability_operator_latest_version>2
20.6. Running custom queries to Loki
For troubleshooting, can run custom queries to Loki. There are two examples of ways to do this, which you can adapt according to your needs by replacing the <api_token> with your own.
These examples use the netobserv namespace for the Network Observability Operator and Loki deployments. Additionally, the examples assume that the LokiStack is named loki. You can optionally use a different namespace and naming by adapting the examples, specifically the -n netobserv or the loki-gateway URL.
Prerequisites
- Installed Loki Operator for use with Network Observability Operator
Procedure
To get all available labels, run the following:
$ oc exec deployment/netobserv-plugin -n netobserv -- curl -G -s -H 'X-Scope-OrgID:network' -H 'Authorization: Bearer <api_token>' -k https://loki-gateway-http.netobserv.svc:8080/api/logs/v1/network/loki/api/v1/labels | jqTo get all flows from the source namespace,
my-namespace, run the following:$ oc exec deployment/netobserv-plugin -n netobserv -- curl -G -s -H 'X-Scope-OrgID:network' -H 'Authorization: Bearer <api_token>' -k https://loki-gateway-http.netobserv.svc:8080/api/logs/v1/network/loki/api/v1/query --data-urlencode 'query={SrcK8S_Namespace="my-namespace"}' | jq
20.7. Troubleshooting Loki ResourceExhausted error
Loki may return a ResourceExhausted error when network flow data sent by network observability exceeds the configured maximum message size. If you are using the Red Hat Loki Operator, this maximum message size is configured to 100 MiB.
Procedure
- Navigate to Operators → Installed Operators, viewing All projects from the Project drop-down menu.
- In the Provided APIs list, select the Network Observability Operator.
Click the Flow Collector then the YAML view tab.
-
If you are using the Loki Operator, check that the
spec.loki.batchSizevalue does not exceed 98 MiB. -
If you are using a Loki installation method that is different from the Red Hat Loki Operator, such as Grafana Loki, verify that the
grpc_server_max_recv_msg_sizeGrafana Loki server setting is higher than theFlowCollectorresourcespec.loki.batchSizevalue. If it is not, you must either increase thegrpc_server_max_recv_msg_sizevalue, or decrease thespec.loki.batchSizevalue so that it is lower than the limit.
-
If you are using the Loki Operator, check that the
- Click Save if you edited the FlowCollector.
20.8. Loki empty ring error
The Loki "empty ring" error results in flows not being stored in Loki and not showing up in the web console. This error might happen in various situations. A single workaround to address them all does not exist. There are some actions you can take to investigate the logs in your Loki pods, and verify that the LokiStack is healthy and ready.
Some of the situations where this error is observed are as follows:
After a
LokiStackis uninstalled and reinstalled in the same namespace, old PVCs are not removed, which can cause this error.-
Action: You can try removing the
LokiStackagain, removing the PVC, then reinstalling theLokiStack.
-
Action: You can try removing the
After a certificate rotation, this error can prevent communication with the
flowlogs-pipelineandconsole-pluginpods.- Action: You can restart the pods to restore the connectivity.
20.9. Resource troubleshooting
20.10. LokiStack rate limit errors
A rate-limit placed on the Loki tenant can result in potential temporary loss of data and a 429 error: Per stream rate limit exceeded (limit:xMB/sec) while attempting to ingest for stream. You might consider having an alert set to notify you of this error. For more information, see "Creating Loki rate limit alerts for the NetObserv dashboard" in the Additional resources of this section.
You can update the LokiStack CRD with the perStreamRateLimit and perStreamRateLimitBurst specifications, as shown in the following procedure.
Procedure
- Navigate to Operators → Installed Operators, viewing All projects from the Project dropdown.
- Look for Loki Operator, and select the LokiStack tab.
Create or edit an existing LokiStack instance using the YAML view to add the
perStreamRateLimitandperStreamRateLimitBurstspecifications:apiVersion: loki.grafana.com/v1 kind: LokiStack metadata: name: loki namespace: netobserv spec: limits: global: ingestion: perStreamRateLimit: 61 perStreamRateLimitBurst: 302 tenants: mode: openshift-network managementState: Managed- Click Save.
Verification
Once you update the perStreamRateLimit and perStreamRateLimitBurst specifications, the pods in your cluster restart and the 429 rate-limit error no longer occurs.
20.11. Running a large query results in Loki errors
When running large queries for a long time, Loki errors can occur, such as a timeout or too many outstanding requests. There is no complete corrective for this issue, but there are several ways to mitigate it:
- Adapt your query to add an indexed filter
-
With Loki queries, you can query on both indexed and non-indexed fields or labels. Queries that contain filters on labels perform better. For example, if you query for a particular Pod, which is not an indexed field, you can add its Namespace to the query. The list of indexed fields can be found in the "Network flows format reference", in the
Loki labelcolumn. - Consider querying Prometheus rather than Loki
- Prometheus is a better fit than Loki to query on large time ranges. However, whether or not you can use Prometheus instead of Loki depends on the use case. For example, queries on Prometheus are much faster than on Loki, and large time ranges do not impact performance. But Prometheus metrics do not contain as much information as flow logs in Loki. The Network Observability OpenShift web console automatically favors Prometheus over Loki if the query is compatible; otherwise, it defaults to Loki. If your query does not run against Prometheus, you can change some filters or aggregations to make the switch. In the OpenShift web console, you can force the use of Prometheus. An error message is displayed when incompatible queries fail, which can help you figure out which labels to change to make the query compatible. For example, changing a filter or an aggregation from Resource or Pods to Owner.
- Consider using the FlowMetrics API to create your own metric
- If the data that you need isn’t available as a Prometheus metric, you can use the FlowMetrics API to create your own metric. For more information, see "FlowMetrics API Reference" and "Configuring custom metrics by using FlowMetric API".
- Configure Loki to improve the query performance
If the problem persists, you can consider configuring Loki to improve the query performance. Some options depend on the installation mode you used for Loki, such as using the Operator and
LokiStack, orMonolithicmode, orMicroservicesmode.-
In
LokiStackorMicroservicesmodes, try increasing the number of querier replicas. -
Increase the query timeout. You must also increase the Network Observability read timeout to Loki in the
FlowCollectorspec.loki.readTimeout.
-
In
Legal Notice
Copyright © Red Hat
OpenShift documentation is licensed under the Apache License 2.0 (https://www.apache.org/licenses/LICENSE-2.0).
Modified versions must remove all Red Hat trademarks.
Portions adapted from https://github.com/kubernetes-incubator/service-catalog/ with modifications by Red Hat.
Red Hat, Red Hat Enterprise Linux, the Red Hat logo, the Shadowman logo, JBoss, OpenShift, Fedora, the Infinity logo, and RHCE are trademarks of Red Hat, Inc., registered in the United States and other countries.
Linux® is the registered trademark of Linus Torvalds in the United States and other countries.
Java® is a registered trademark of Oracle and/or its affiliates.
XFS® is a trademark of Silicon Graphics International Corp. or its subsidiaries in the United States and/or other countries.
MySQL® is a registered trademark of MySQL AB in the United States, the European Union and other countries.
Node.js® is an official trademark of the OpenJS Foundation.
The OpenStack® Word Mark and OpenStack logo are either registered trademarks/service marks or trademarks/service marks of the OpenStack Foundation, in the United States and other countries and are used with the OpenStack Foundation’s permission. We are not affiliated with, endorsed or sponsored by the OpenStack Foundation, or the OpenStack community.
All other trademarks are the property of their respective owners.