Chapter 1. Connectivity Link observability
You can use the Connectivity Link observability features to observe and monitor your Gateways, applications, and APIs on OpenShift.
1.1. Connectivity Link observability features
Connectivity Link uses metrics exposed by Connectivity Link components, Gateway API state metrics, and standard metrics exposed by Envoy to build a set template dashboards and alerts.
You can download and use these Kuadrant community-based templates to integrate with Grafana, Prometheus, and Alertmanager deployments, or use these templates as starting points to modify for your specific needs.
Figure 1.1. Platform engineer Grafana dashboard
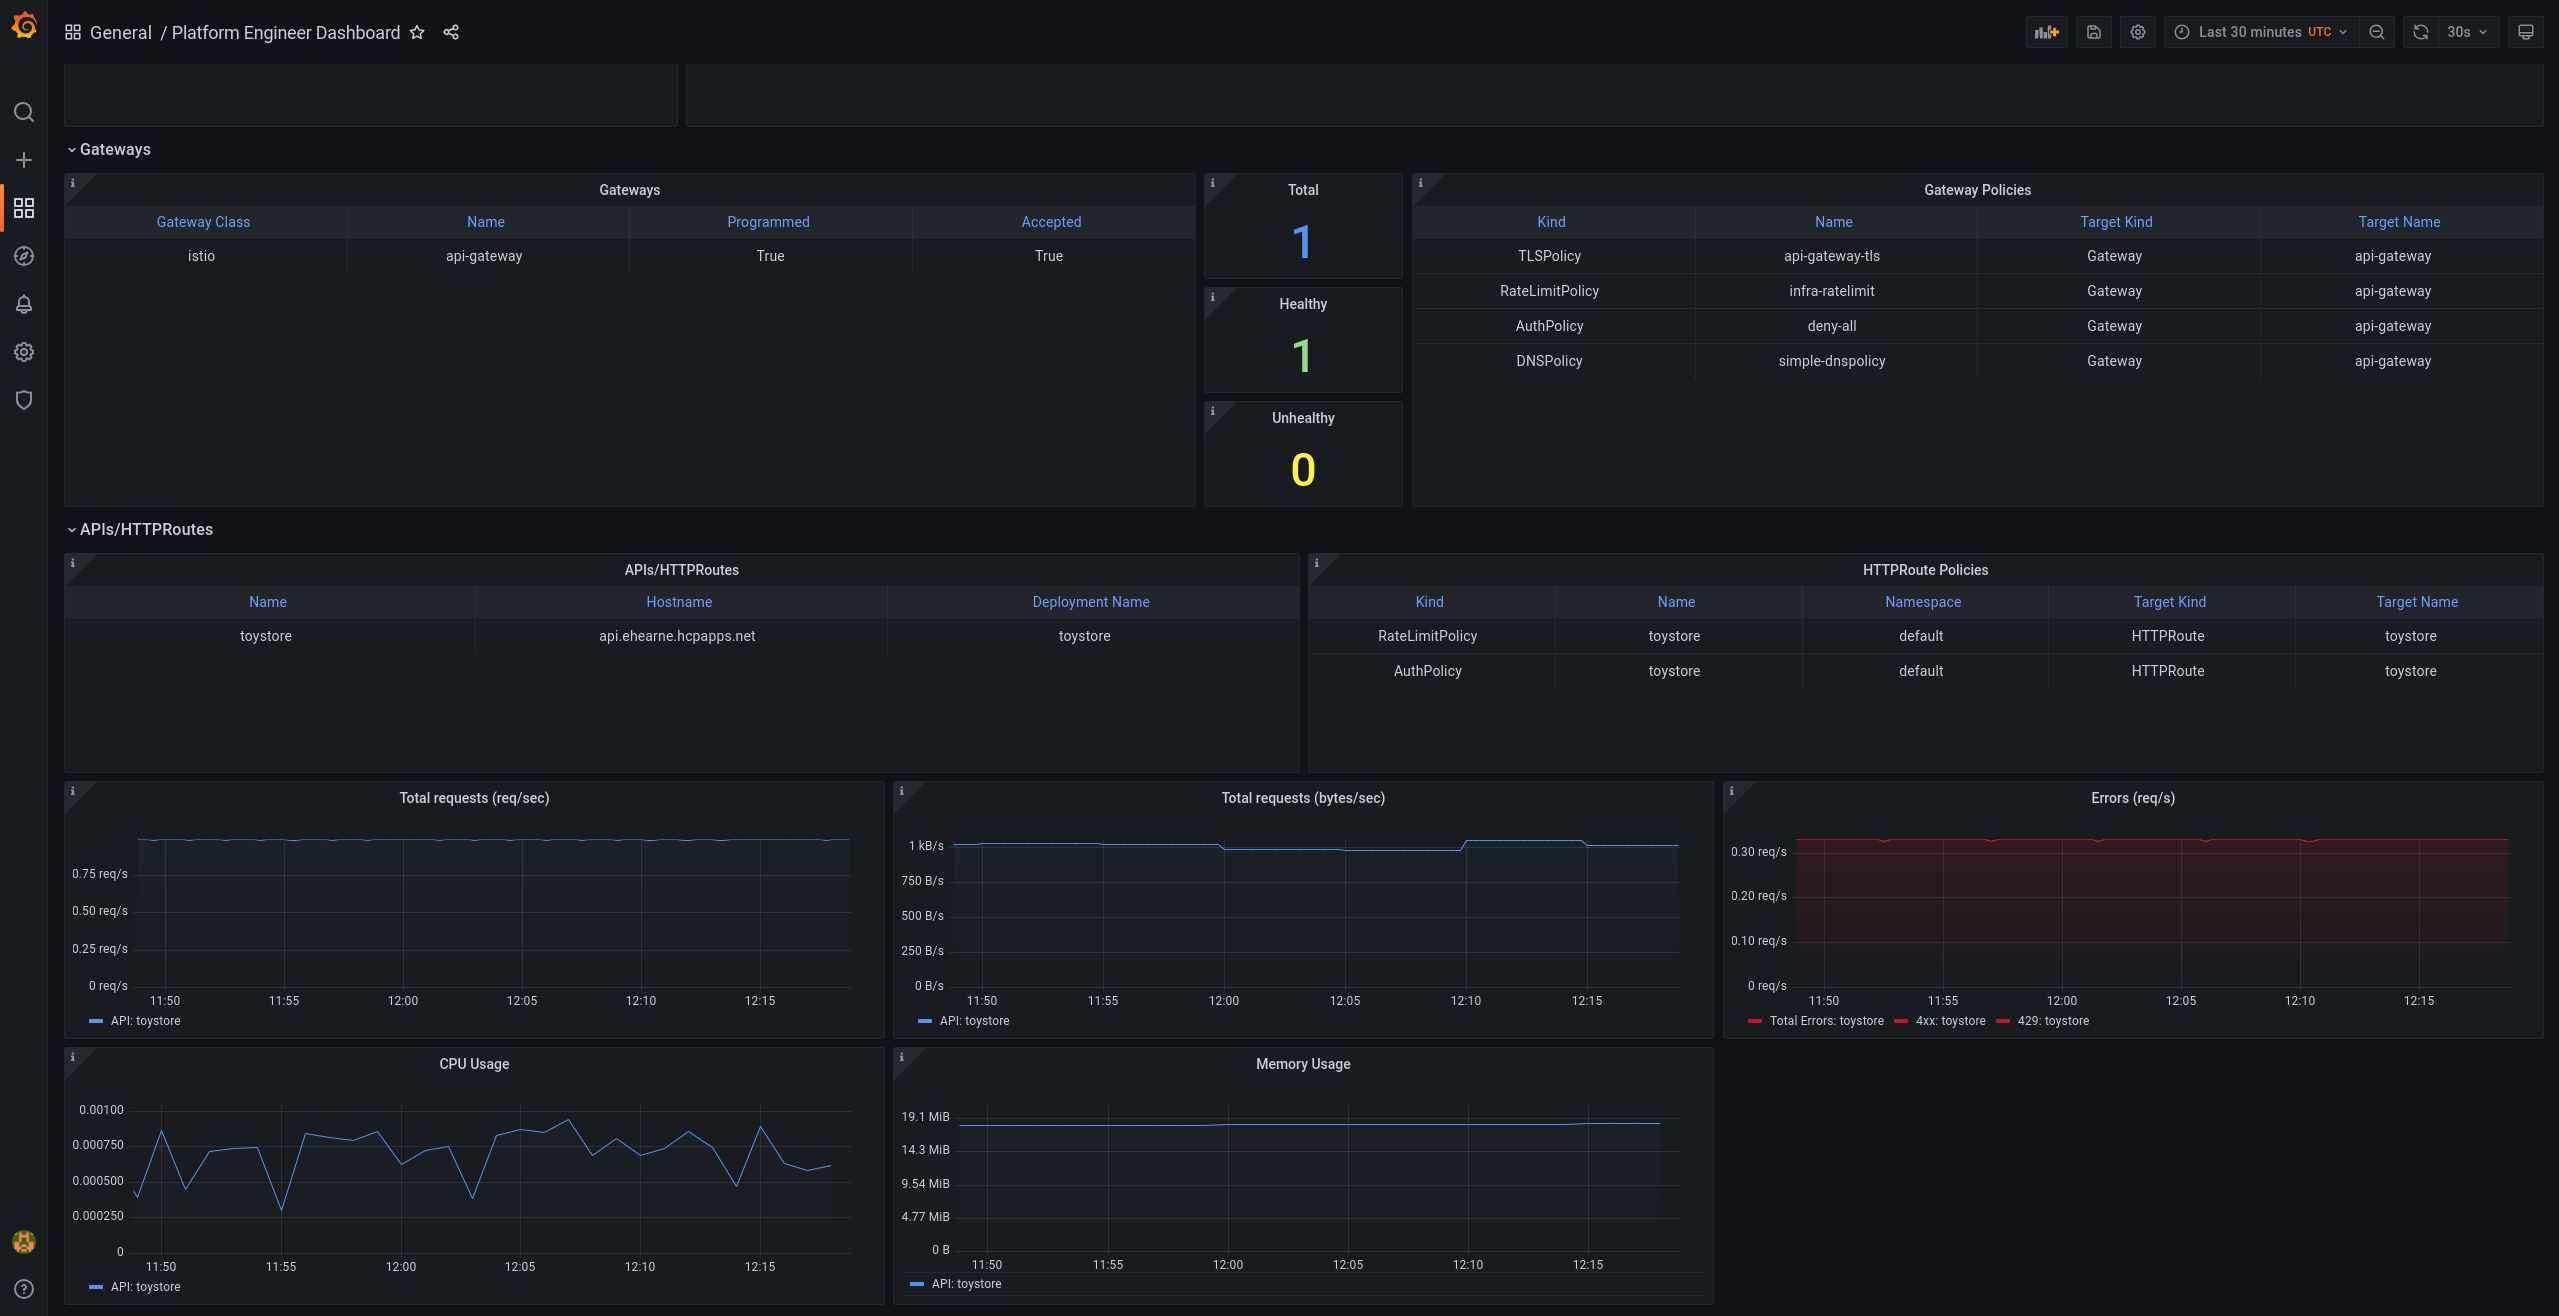
The platform engineer dashboard displays details such as the following:
- Policy compliance and governance.
- Resource consumption.
- Error rates.
- Request latency and throughput.
- Multi-window, multi-burn alert templates for API error rates and latency.
- Multicluster split.
Figure 1.2. Application developer Grafana dashboard
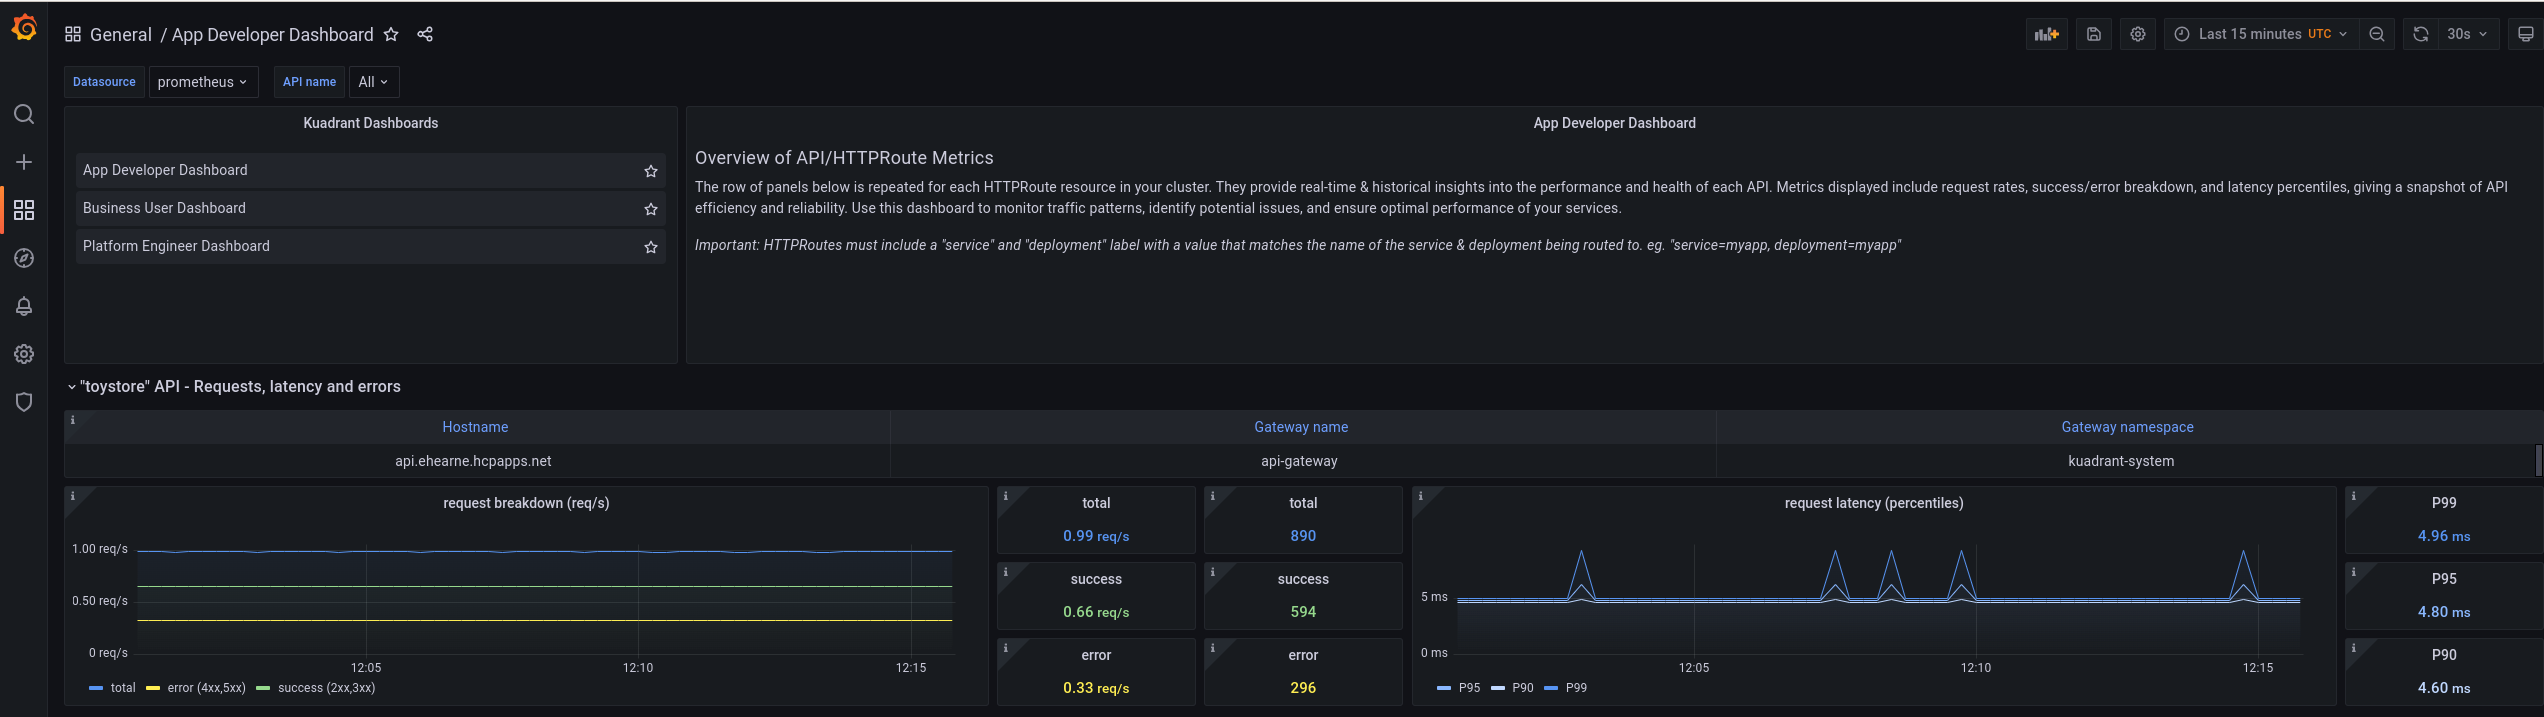
The application developer dashboard is less focused on policies than the platform engineer dashboard and is more focused on APIs and applications. For example, this includes details such as request latency and throughput per API, and total requests and error rates by API path.
Figure 1.3. Business user Grafana dashboard
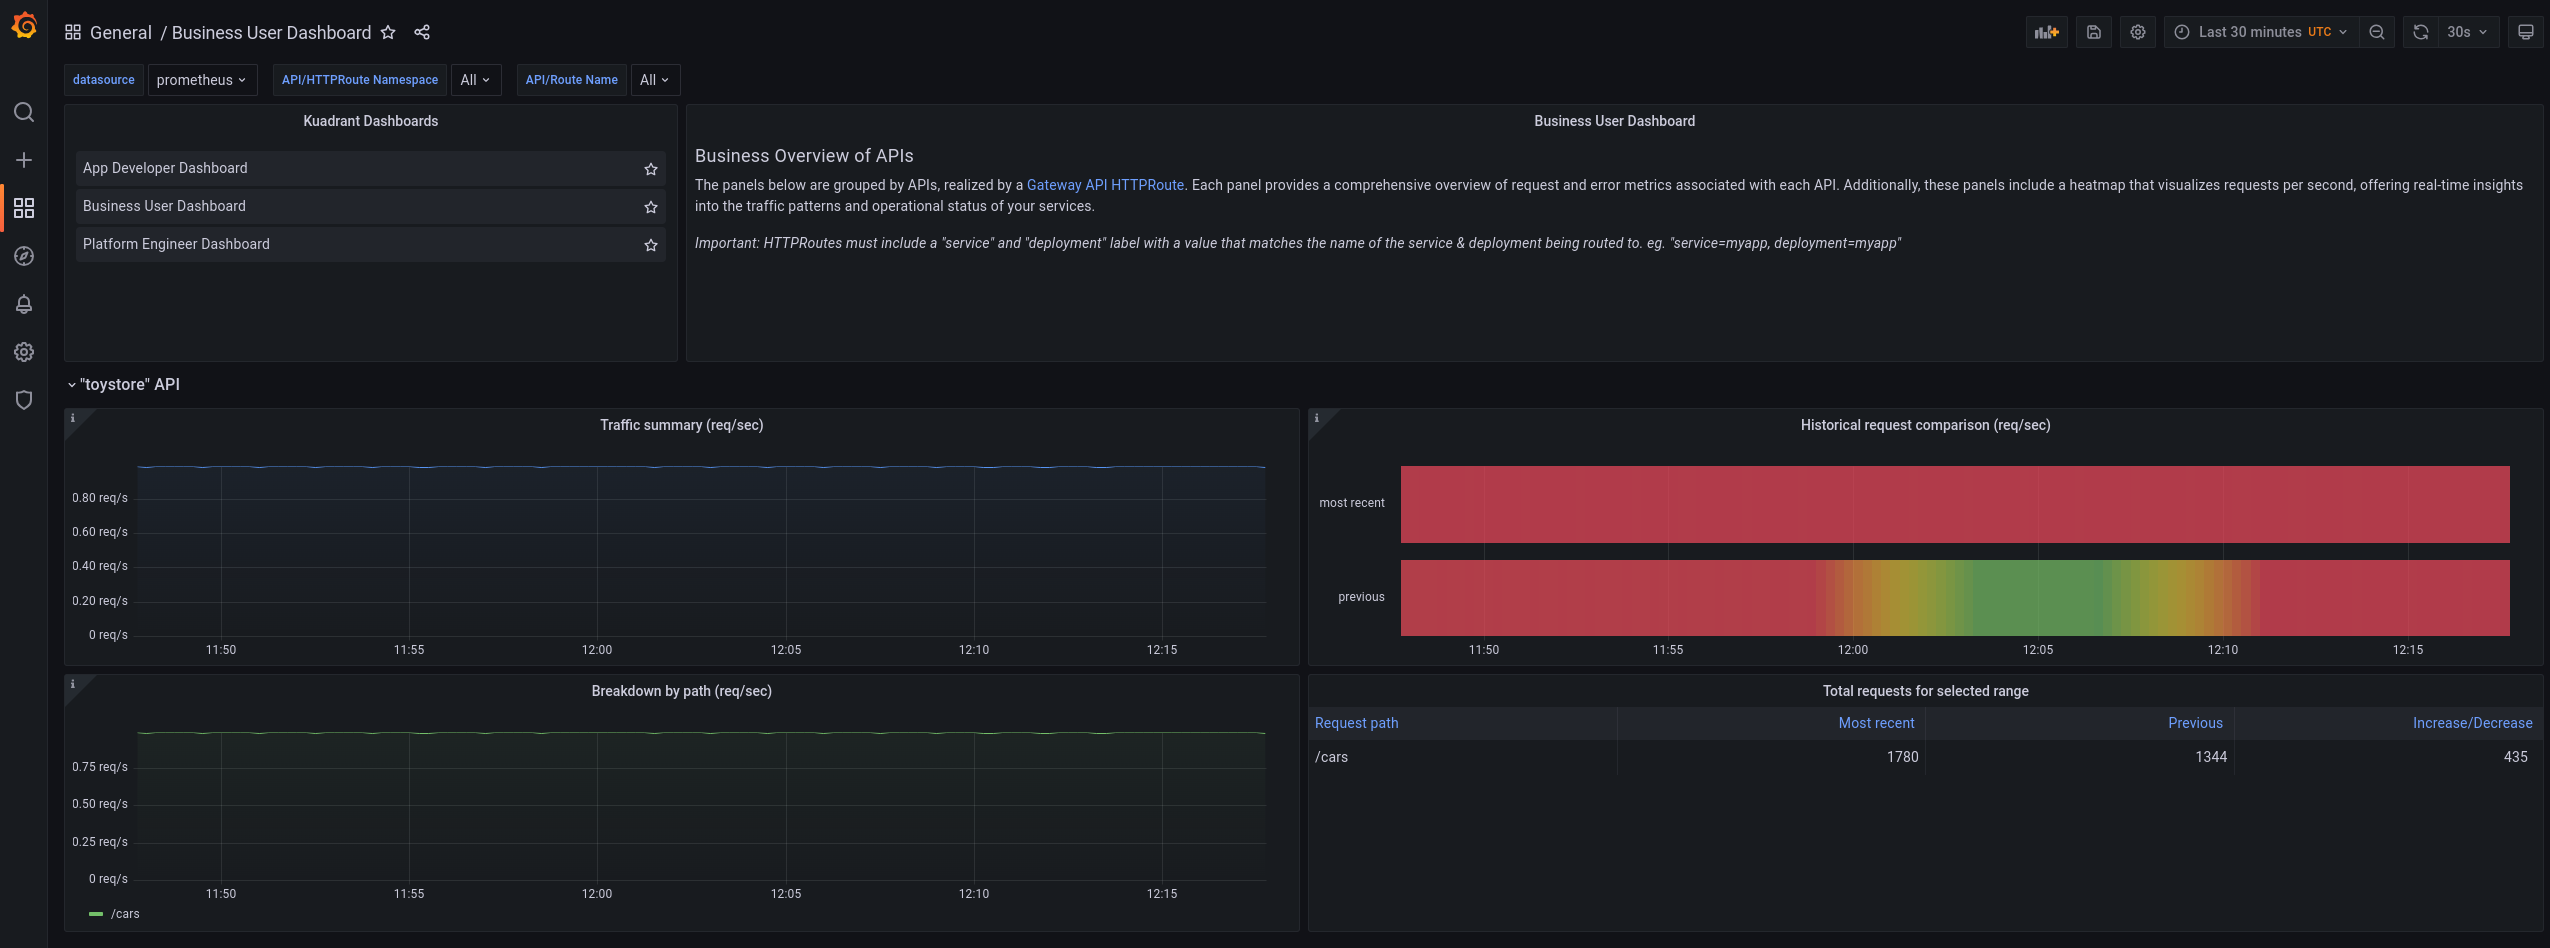
The business user dashboard includes details such as the following:
- Requests per second per API.
- Increase or decrease in rates of API usage over specified times.