Chapter 6. Troubleshooting by using traces and logs
You can use a tracing user interface such as Jaeger or Grafana to search for OpenShift Service Mesh and Connectivity Link trace information by trace ID. You can get the trace ID from logs, or from a header in a sample request that you want to troubleshoot. You can also search for recent traces, filtering by the service that you want to focus on.
6.1. Viewing Connectivity Link traces
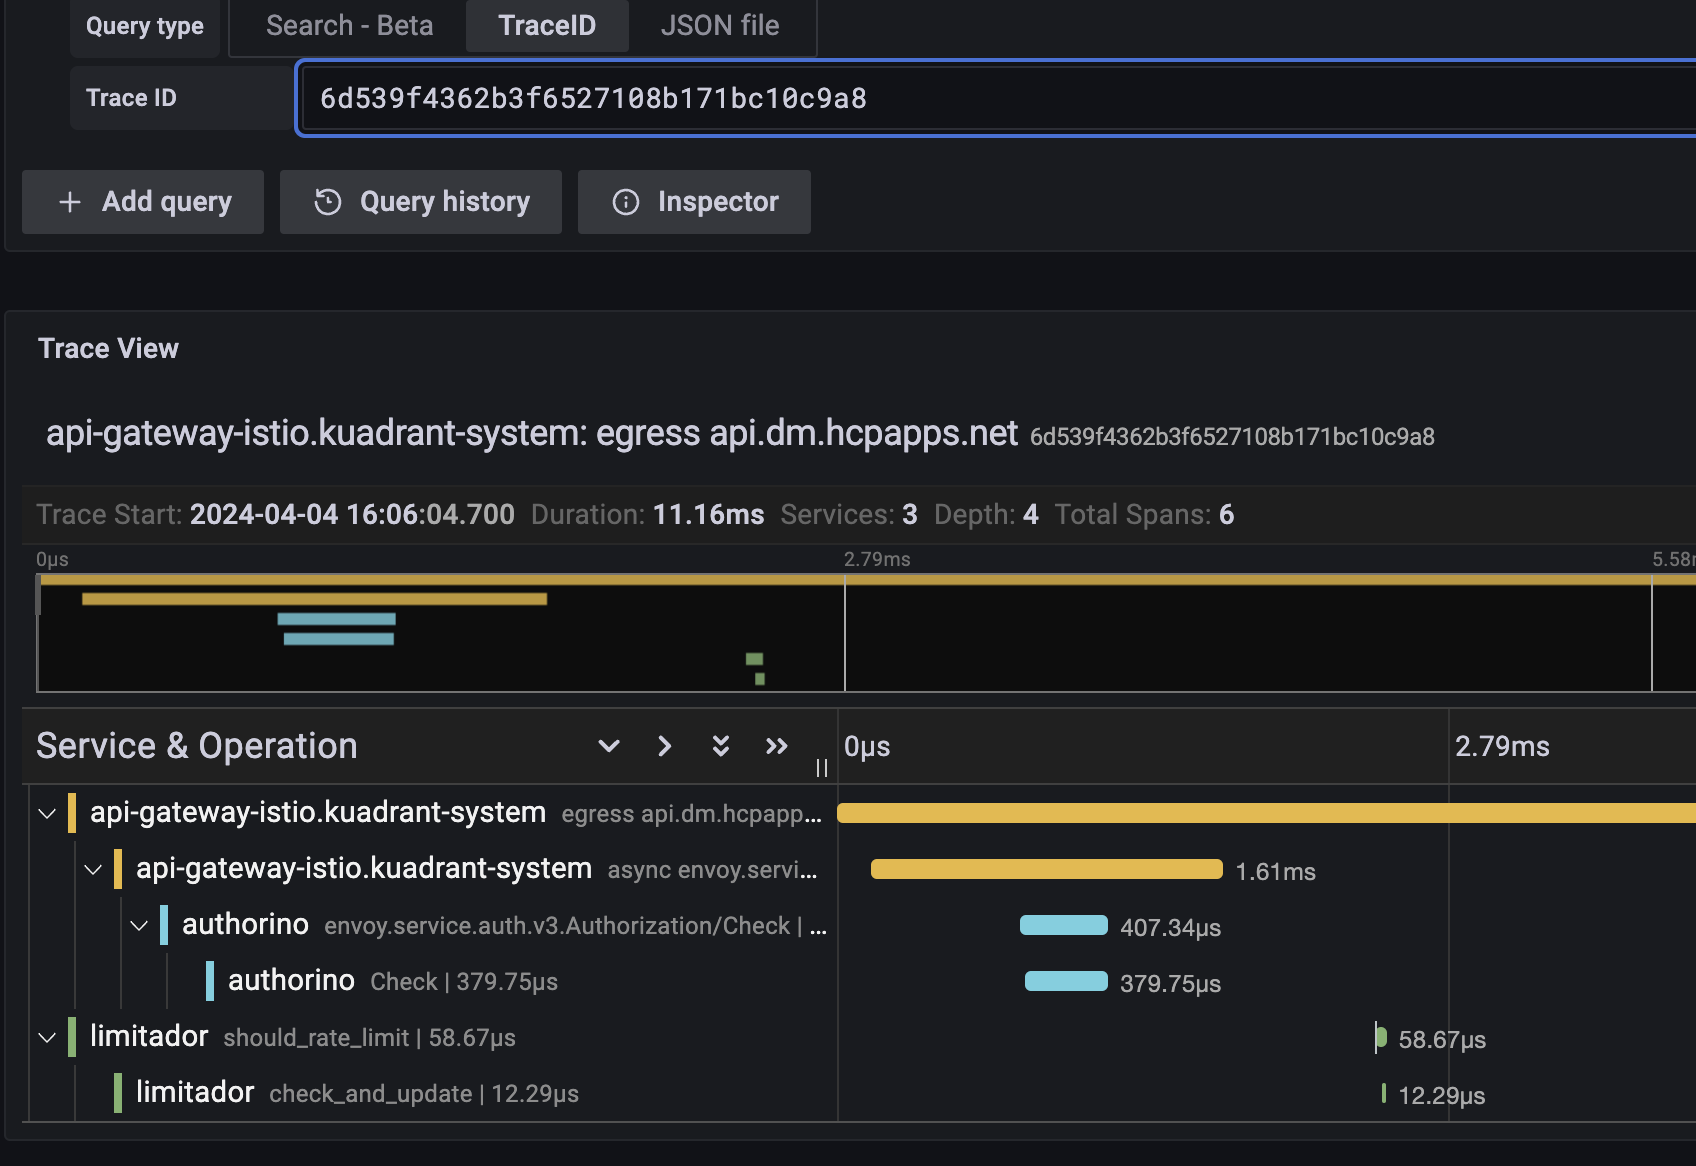
The following example trace in the Grafana user interface shows the total request time from the Istio-based Gateway, the time to check and update the rate limit count in Limitador, and the time to check authentication and authorization in Authorino:
Figure 6.1. Example Connectivity Link trace in Grafana
6.2. Viewing rate limit logging with trace IDs
When using the Limitador component of Connectivity Link for rate limiting, you can enable request logging with trace IDs to get more information on requests. This requires the log level to be increased to at least debug, so you must set the verbosity to 3 or higher in your Limitador custom resource as follows:
A log entry will look something like the following, with the traceparent field holding the trace ID:
"Request received: Request { metadata: MetadataMap { headers: {"te": "trailers", "grpc-timeout": "5000m", "content-type": "application/grpc", "traceparent": "00-4a2a933a23df267aed612f4694b32141-00f067aa0ba902b7-01", "x-envoy-internal": "true", "x-envoy-expected-rq-timeout-ms": "5000"} }, message: RateLimitRequest { domain: "default/toystore", descriptors: [RateLimitDescriptor { entries: [Entry { key: "limit.general_user__f5646550", value: "1" }, Entry { key: "metadata.filter_metadata.envoy\\.filters\\.http\\.ext_authz.identity.userid", value: "alice" }], limit: None }], hits_addend: 1 }, extensions: Extensions }"
"Request received: Request { metadata: MetadataMap { headers: {"te": "trailers", "grpc-timeout": "5000m", "content-type": "application/grpc", "traceparent": "00-4a2a933a23df267aed612f4694b32141-00f067aa0ba902b7-01", "x-envoy-internal": "true", "x-envoy-expected-rq-timeout-ms": "5000"} }, message: RateLimitRequest { domain: "default/toystore", descriptors: [RateLimitDescriptor { entries: [Entry { key: "limit.general_user__f5646550", value: "1" }, Entry { key: "metadata.filter_metadata.envoy\\.filters\\.http\\.ext_authz.identity.userid", value: "alice" }], limit: None }], hits_addend: 1 }, extensions: Extensions }"If you centrally aggregate logs by using tools such as Grafana Loki and Promtail, you can jump between trace information and the relevant logs for that service.
By using a combination of tracing and logs, you can visualize and troubleshoot request timing issues and drill down to specific services. This method becomes even more powerful when combined with Connectivity Link metrics and dashboards to get a more complete picture of your user traffic.
Additional resources
- For more details, see the Grafana user documentation.