6.2. Analysis
Successfully tuning storage stack performance requires an understanding of how data flows through the system, as well as intimate knowledge of the underlying storage and how it performs under varying workloads. It also requires an understanding of the actual workload being tuned.
Whenever you deploy a new system, it is a good idea to profile the storage from the bottom up. Start with the raw LUNs or disks, and evaluate their performance using direct I/O (I/O which bypasses the kernel's page cache). This is the most basic test you can perform, and will be the standard by which you measure I/O performance in the stack. Start with a basic workload generator (such as aio-stress) that produces sequential and random reads and writes across a variety of I/O sizes and queue depths.
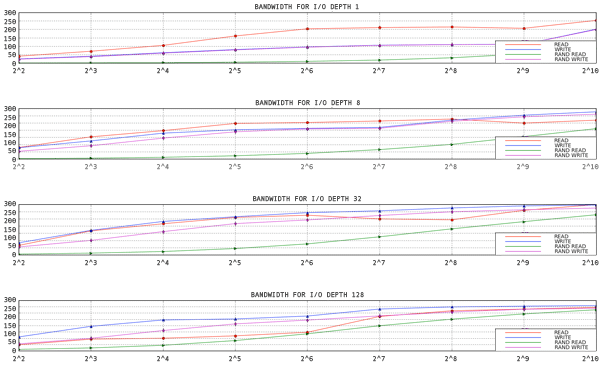
Following is a graph from a series of aio-stress runs, each of which performs four stages: sequential write, sequential read, random write and random read. In this example, the tool is configured to run across a range of record sizes (the x axis) and queue depths (one per graph). The queue depth represents the total number of I/O operations in progress at a given time.

The y-axis shows the bandwidth in megabytes per second. The x-axis shows the I/O Size in kilobytes.
Figure 6.1. aio-stress output for 1 thread, 1 file
Notice how the throughput line trends from the lower left corner to the upper right. Also note that, for a given record size, you can get more throughput from the storage by increasing the number of I/Os in progress.
By running these simple workloads against your storage, you will gain an understanding of how your storage performs under load. Retain the data generated by these tests for comparison when analyzing more complex workloads.
If you will be using device mapper or md, add that layer in next and repeat your tests. If there is a large loss in performance, ensure that it is expected, or can be explained. For example, a performance drop may be expected if a checksumming raid layer has been added to the stack. Unexpected performance drops can be caused by misaligned I/O operations. By default, Red Hat Enterprise Linux aligns partitions and device mapper metadata optimally. However, not all types of storage report their optimal alignment, and so may require manual tuning.
After adding the device mapper or md layer, add a file system on top of the block device and test against that, still using direct I/O. Again, compare results to the prior tests and ensure that you understand any discrepancies. Direct-write I/O typically performs better on pre-allocated files, so ensure that you pre-allocate files before testing for performance.
Synthetic workload generators that you may find useful include:
- aio-stress
- iozone
- fio