Chapter 6. Configuring action log storage for Elasticsearch and Splunk
By default, the previous three months of usage logs are stored in the Red Hat Quay database and exposed through the web UI on organization and repository levels. Appropriate administrative privileges are required to see log entries. For deployments with a large amount of logged operations, you can store the usage logs in Elasticsearch and Splunk instead of the Red Hat Quay database backend.
6.1. Configuring action log storage for Elasticsearch
To configure action log storage for Elasticsearch, you must provide your own Elasticsearch stack, as it is not included with Red Hat Quay as a customizable component.
Enabling Elasticsearch logging can be done during Red Hat Quay deployment or post-deployment using the configuration tool. The resulting configuration is stored in the config.yaml file. When configured, usage log access continues to be provided through the web UI for repositories and organizations.
Use the following procedure to configure action log storage for Elasticsearch:
Procedure
- Obtain an Elasticsearch account.
- Open the Red Hat Quay Config Tool (either during or after Red Hat Quay deployment).
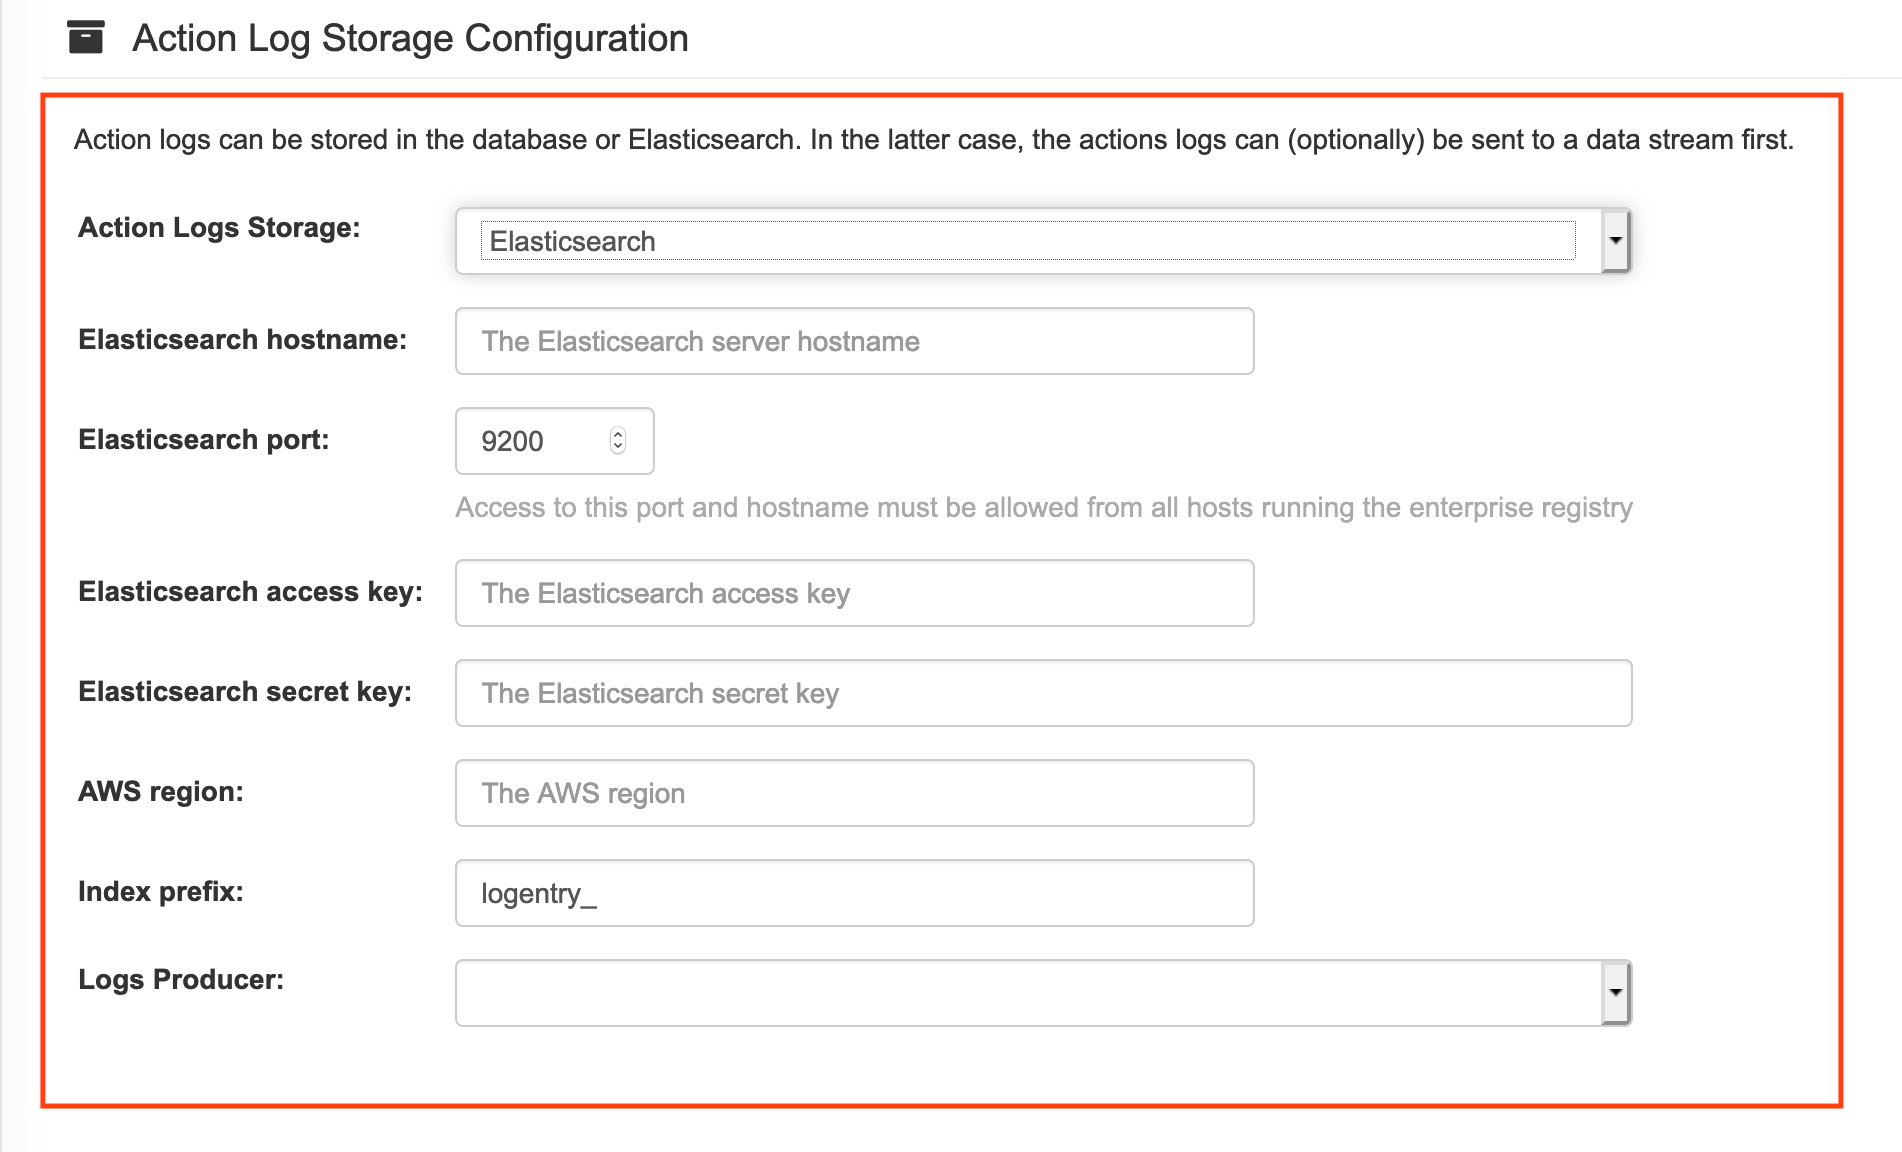
Scroll to the Action Log Storage Configuration setting and select Elasticsearch. The following figure shows the Elasticsearch settings that appear:

Fill in the following information for your Elasticsearch instance:
- Elasticsearch hostname: The hostname or IP address of the system providing the Elasticsearch service.
- Elasticsearch port: The port number providing the Elasticsearch service on the host you just entered. Note that the port must be accessible from all systems running the Red Hat Quay registry. The default is TCP port 9200.
- Elasticsearch access key: The access key needed to gain access to the Elastic search service, if required.
- Elasticsearch secret key: The secret key needed to gain access to the Elastic search service, if required.
- AWS region: If you are running on AWS, set the AWS region (otherwise, leave it blank).
- Index prefix: Choose a prefix to attach to log entries.
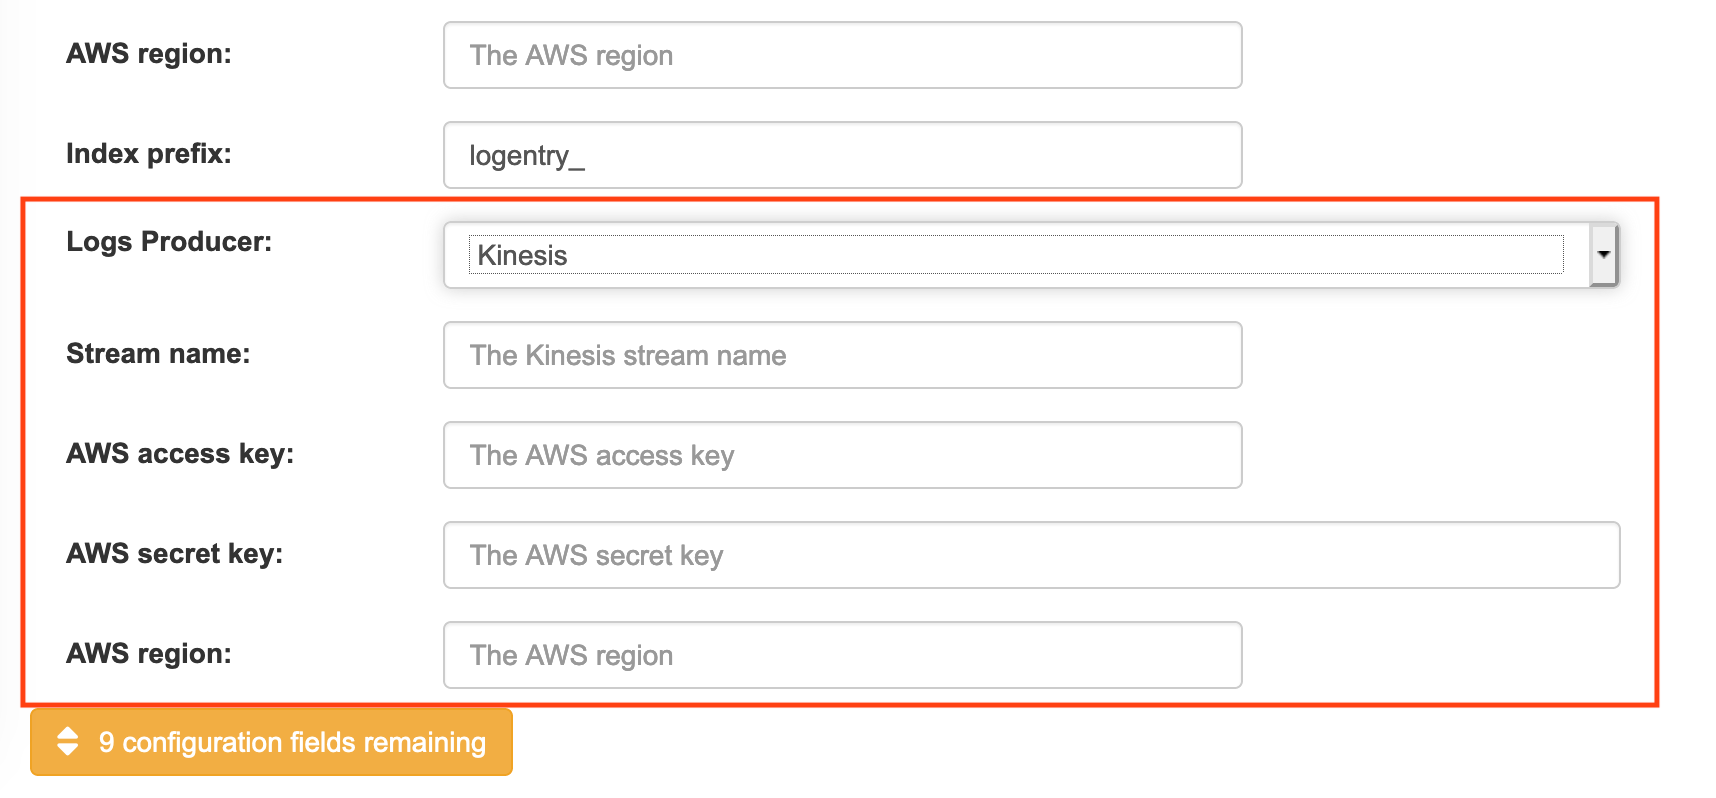
Logs Producer: Choose either Elasticsearch (default) or Kinesis to direct logs to an intermediate Kinesis stream on AWS. You need to set up your own pipeline to send logs from Kinesis to Elasticsearch (for example, Logstash). The following figure shows additional fields you would need to fill in for Kinesis:

If you chose Elasticsearch as the Logs Producer, no further configuration is needed. If you chose Kinesis, fill in the following:
- Stream name: The name of the Kinesis stream.
- AWS access key: The name of the AWS access key needed to gain access to the Kinesis stream, if required.
- AWS secret key: The name of the AWS secret key needed to gain access to the Kinesis stream, if required.
- AWS region: The AWS region.
- When you are done, save the configuration. The configuration tool checks your settings. If there is a problem connecting to the Elasticsearch or Kinesis services, you will see an error and have the opportunity to continue editing. Otherwise, logging will begin to be directed to your Elasticsearch configuration after the cluster restarts with the new configuration.
6.2. Configuring action log storage for Splunk
Splunk is an alternative to Elasticsearch that can provide log analyses for your Red Hat Quay data.
Enabling Splunk logging can be done during Red Hat Quay deployment or post-deployment using the configuration tool. The resulting configuration is stored in the config.yaml file. When configured, usage log access continues to be provided through the Splunk web UI for repositories and organizations.
Use the following procedures to enable Splunk for your Red Hat Quay deployment.
6.2.1. Installing and creating a username for Splunk
Use the following procedure to install and create Splunk credentials.
Procedure
- Create a Splunk account by navigating to Splunk and entering the required credentials.
- Navigate to the Splunk Enterprise Free Trial page, select your platform and installation package, and then click Download Now.
-
Install the Splunk software on your machine. When prompted, create a username, for example,
splunk_adminand password. -
After creating a username and password, a localhost URL will be provided for your Splunk deployment, for example,
http://<sample_url>.remote.csb:8000/. Open the URL in your preferred browser. - Log in with the username and password you created during installation. You are directed to the Splunk UI.
6.2.2. Generating a Splunk token
Use one of the following procedures to create a bearer token for Splunk.
6.2.2.1. Generating a Splunk token using the Splunk UI
Use the following procedure to create a bearer token for Splunk using the Splunk UI.
Prerequisites
- You have installed Splunk and created a username.
Procedure
-
On the Splunk UI, navigate to Settings
Tokens. - Click Enable Token Authentication.
- Ensure that Token Authentication is enabled by clicking Token Settings and selecting Token Authentication if necessary.
- Optional: Set the expiration time for your token. This defaults at 30 days.
- Click Save.
- Click New Token.
- Enter information for User and Audience.
- Optional: Set the Expiration and Not Before information.
Click Create. Your token appears in the Token box. Copy the token immediately.
ImportantIf you close out of the box before copying the token, you must create a new token. The token in its entirety is not available after closing the New Token window.
6.2.2.2. Generating a Splunk token using the CLI
Use the following procedure to create a bearer token for Splunk using the CLI.
Prerequisites
- You have installed Splunk and created a username.
Procedure
In your CLI, enter the following
CURLcommand to enable token authentication, passing in your Splunk username and password:curl -k -u <username>:<password> -X POST <scheme>://<host>:<port>/services/admin/token-auth/tokens_auth -d disabled=false
$ curl -k -u <username>:<password> -X POST <scheme>://<host>:<port>/services/admin/token-auth/tokens_auth -d disabled=falseCopy to Clipboard Copied! Toggle word wrap Toggle overflow Create a token by entering the following
CURLcommand, passing in your Splunk username and password.curl -k -u <username>:<password> -X POST <scheme>://<host>:<port>/services/authorization/tokens?output_mode=json --data name=<username> --data audience=Users --data-urlencode expires_on=+30d
$ curl -k -u <username>:<password> -X POST <scheme>://<host>:<port>/services/authorization/tokens?output_mode=json --data name=<username> --data audience=Users --data-urlencode expires_on=+30dCopy to Clipboard Copied! Toggle word wrap Toggle overflow - Save the generated bearer token.
6.2.3. Configuring Red Hat Quay to use Splunk
Use the following procedure to configure Red Hat Quay to use Splunk.
Prerequisites
- You have installed Splunk and created a username.
- You have generated a Splunk bearer token.
Procedure
Open your Red Hat Quay
config.yamlfile and add the following configuration fields:Copy to Clipboard Copied! Toggle word wrap Toggle overflow - 1
- String. The Splunk cluster endpoint.
- 2
- Integer. The Splunk management cluster endpoint port. Differs from the Splunk GUI hosted port. Can be found on the Splunk UI under Settings
Server Settings General Settings. - 3
- String. The generated bearer token for Splunk.
- 4
- String. The URL scheme for access the Splunk service. If Splunk is configured to use TLS/SSL, this must be
https. - 5
- Boolean. Whether to enable TLS/SSL. Defaults to
True. - 6
- String. The Splunk index prefix. Can be a new, or used, index. Can be created from the Splunk UI.
- 7
- String. The relative container path to a single
.pemfile containing a certificate authority (CA) for TLS/SSL validation.
If you are configuring
ssl_ca_path, you must configure the SSL/TLS certificate so that Red Hat Quay will trust it.-
If you are using a standalone deployment of Red Hat Quay, SSL/TLS certificates can be provided by placing the certificate file inside of the
extra_ca_certsdirectory, or inside of the relative container path and specified byssl_ca_path. If you are using the Red Hat Quay Operator, create a config bundle secret, including the certificate authority (CA) of the Splunk server. For example:
oc create secret generic --from-file config.yaml=./config_390.yaml --from-file extra_ca_cert_splunkserver.crt=./splunkserver.crt config-bundle-secret
$ oc create secret generic --from-file config.yaml=./config_390.yaml --from-file extra_ca_cert_splunkserver.crt=./splunkserver.crt config-bundle-secretCopy to Clipboard Copied! Toggle word wrap Toggle overflow Specify the
conf/stack/extra_ca_certs/splunkserver.crtfile in yourconfig.yaml. For example:Copy to Clipboard Copied! Toggle word wrap Toggle overflow
-
If you are using a standalone deployment of Red Hat Quay, SSL/TLS certificates can be provided by placing the certificate file inside of the
6.2.4. Creating an action log
Use the following procedure to create a user account that can forward action logs to Splunk.
You must use the Splunk UI to view Red Hat Quay action logs. At this time, viewing Splunk action logs on the Red Hat Quay Usage Logs page is unsupported, and returns the following message: Method not implemented. Splunk does not support log lookups.
Prerequisites
- You have installed Splunk and created a username.
- You have generated a Splunk bearer token.
-
You have configured your Red Hat Quay
config.yamlfile to enable Splunk.
Procedure
- Log in to your Red Hat Quay deployment.
- Click on the name of the organization that you will use to create an action log for Splunk.
-
In the navigation pane, click Robot Accounts
Create Robot Account. -
When prompted, enter a name for the robot account, for example
spunkrobotaccount, then click Create robot account. - On your browser, open the Splunk UI.
- Click Search and Reporting.
In the search bar, enter the name of your index, for example,
<splunk_log_index_name>and press Enter.The search results populate on the Splunk UI, showing information like
host,sourcetype, etc. By clicking the>arrow, you can see metadata for the logs, such as theip, JSON metadata, and account name.